- +1-315-215-1633
- sales@thebrainyinsights.com

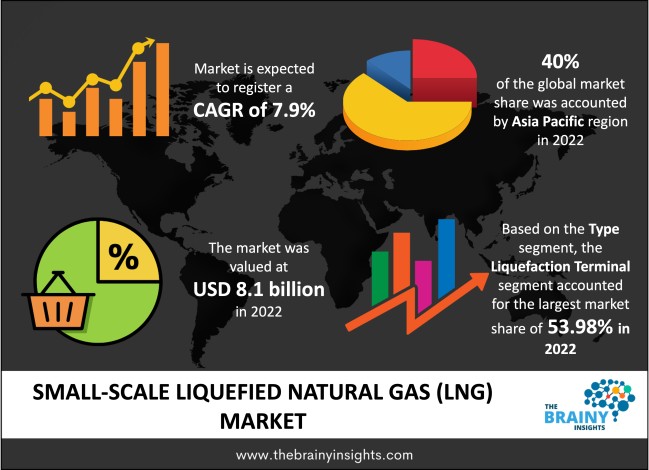
The global Small-Scale Liquefied Natural Gas (LNG) market is expected to reach USD 17.3 billion by 2032, at a CAGR of 7.9% during the forecast period 2023 to 2032. North America is expected to grow the fastest during the forecast period.
Liquefied natural gas (LNG) is a form of natural gas that has been cooled and compressed into liquid form, mainly composed of methane (CH4) and ethane (C2H6). It is much more efficient to store and transport than in its gaseous state, taking up only 1/600th of the original volume. It is odourless, non-corrosive, and colourless, and components such as acid gases, dust, water, helium, and heavy hydrocarbons have been removed to prevent potential problems. The liquefaction process is done by cooling the gas to 162°C (260°F) and then reducing the transport pressure to around 25 kPa (4 psi). Natural gas is comprised of varying mixtures of methane (CH4), ethane (C2H6), propane (C3H8), and butane (C4H10). With the increasing demand for sustainable electricity, there has been an increased demand for LNG and other renewable energies, as coal supplies have depleted and the negative environmental impact has become more apparent. Due to this, the market is expected to expand due to increased distributed power and utility projects.
Get an overview of this study by requesting a free sample
Primary Fuel for the Transportation Industry- LNG is an ideal alternative to diesel fuel for trucks and ships, as it contributes to environmental sustainability by significantly reducing CO2 emissions and fuel costs. Additionally, it is a much more viable option than traditional fuels for the transportation industry. By using LNG, companies can reduce their environmental footprint and operating costs, making it a preferable choice for many end-user industries.
Leakage of Methane Gas- Natural gas is easily transported and comes from worldwide. Unfortunately, at every stage of the supply chain, these activities emit methane, a vital greenhouse gas. Methane has a global warming potential of 28 to 34 times that of carbon dioxide, restricting the market growth.
Increased Demand for Natural Gas- One of the reasons for the increased demand for natural gas is that it is a plentiful natural resource. According to the International Energy Agency (IEA), there are enough recoverable natural gas resources to last approximately 230 years. This factor is expected to provide growth opportunities for the market during the forecast period.
Health Problems- The fracking technique involves pumping water into a subsurface gas deposit to bring it closer to the surface, which is the most commonly used method of extracting natural gas. Unfortunately, this practice has been linked to various health issues, environmental damage, and a spike in methane emissions. These factors will likely impede the market's growth in the coming years.
The regions analysed for the market include North America, South America, Europe, Asia Pacific, and Middle East & Africa. Asia Pacific emerged as the largest market for the global small-scale liquefied natural gas (LNG) market, with a 40% market revenue share in 2022.
Asia Pacific dominates the small-scale liquefied natural gas (LNG) market with a 40% market revenue share in 2022. Japan accounted for the most country-level demand and is expected to expand rapidly during the forecast period. China will have the highest growth rate in the Asia Pacific region in the following years. Energy mix gas accounts for only 4%-5% of primary energy consumption in the country, leaving plenty of room for growth. Robust economic expansion across the country also drives the consumption of gas-powered power plants, which has expanded the market's application reach.
North America is expected to witness the fastest growth during the forecast period. The abundance of shale gas deposits in the United States and an increased government focus on expanding renewable energy sources in the country's energy mix fuel the high demand for LNG. Alberta, New Brunswick, British Columbia, Saskatchewan, Manitoba, Ontario, Quebec, and Nova Scotia, among other areas, have shale gas deposits.
Asia Pacific Region Small-Scale Liquefied Natural Gas (LNG) Market Share in 2022 - 40%
www.thebrainyinsights.com
Check the geographical analysis of this market by requesting a free sample
The type segment is divided into a liquefaction terminal and a regasification terminal. The liquefaction terminal segment dominated the market, with a market share of around 53.98% in 2022. Liquefaction terminals convert natural gas into a liquid form, while regasification terminals convert it back into gas for use in homes and businesses. Currently, liquefaction terminals dominate the small-scale LNG market. This factor is due to their versatility and the fact that they are more cost-effective for small-scale operations.
The application segment is divided into power generation, transportation fuel, and others. The power generation segment dominated the market, with a market share of around 42.79% in 2022. Rising natural gas demand also aids in the reduction of harmful greenhouse gas emissions. The increased use of this fuel in the power generation sectors has shown a substantial change over time. Price reductions and reduced fuel switching costs boost industry expansion in power generation applications.
| Attribute | Description |
|---|---|
| Market Size | Revenue (USD Billion) |
| Market size value in 2022 | USD 8.1 billion |
| Market size value in 2032 | USD 17.3 billion |
| CAGR (2023 to 2032) | 7.9% |
| Historical data | 2019-2021 |
| Base Year | 2022 |
| Forecast | 2023-2032 |
| Regional Segments | North America, Asia Pacific, Europe, Latin America, Middle East and Africa |
| Segments | Type, Application |
As per The Brainy Insights, the size of the Small-Scale Liquefied Natural Gas (LNG) market was valued at USD 8.1 billion in 2022 to USD 17.3 billion by 2032.
The global small-scale liquefied natural gas (LNG) market is growing at a CAGR of 7.9% during the forecast period 2023-2032.
Asia Pacific emerged as the largest Small-Scale Liquefied Natural Gas (LNG) market.
1. Introduction
1.1. Objectives of the Study
1.2. Market Definition
1.3. Research Scope
1.4. Currency
1.5. Key Target Audience
2. Research Methodology and Assumptions
3. Executive Summary
4. Premium Insights
4.1. Porter’s Five Forces Analysis
4.2. Value Chain Analysis
4.3. Top Investment Pockets
4.3.1. Market Attractiveness Analysis by Type
4.3.2. Market Attractiveness Analysis by Application
4.3.3. Market Attractiveness Analysis by Region
4.4. Industry Trends
5. Market Dynamics
5.1. Market Evaluation
5.2. Drivers
5.2.1. Primary Fuel for the Transportation Industry
5.3. Restraints
5.3.1. Leakage of Methane Gas
5.4. Opportunities
5.4.1. Increased Demand for Natural Gas
5.5. Challenges
5.5.1. Health Problems
6. Global Small-Scale Liquefied Natural Gas (LNG) Market Analysis and Forecast, By Type
6.1. Segment Overview
6.2. Liquefaction Terminal
6.3. Regasification Terminal
7. Global Small-Scale Liquefied Natural Gas (LNG) Market Analysis and Forecast, By Application
7.1. Segment Overview
7.2. Power Generation
7.3. Transportation Fuel
7.4. Others
8. Global Small-Scale Liquefied Natural Gas (LNG) Market Analysis and Forecast, By Regional Analysis
8.1. Segment Overview
8.2. North America
8.2.1. U.S.
8.2.2. Canada
8.2.3. Mexico
8.3. Europe
8.3.1. Germany
8.3.2. France
8.3.3. U.K.
8.3.4. Italy
8.3.5. Spain
8.4. Asia-Pacific
8.4.1. Japan
8.4.2. China
8.4.3. India
8.5. South America
8.5.1. Brazil
8.6. Middle East and Africa
8.6.1. UAE
8.6.2. South Africa
9. Global Small-Scale Liquefied Natural Gas (LNG) Market-Competitive Landscape
9.1. Overview
9.2. Market Share of Key Players in the Global Small-Scale Liquefied Natural Gas (LNG) Market
9.2.1. Global Company Market Share
9.2.2. North America Company Market Share
9.2.3. Europe Company Market Share
9.2.4. APAC Company Market Share
9.3. Competitive Situations and Trends
9.3.1. Product Launches and Developments
9.3.2. Partnerships, Collaborations, and Agreements
9.3.3. Mergers & Acquisitions
9.3.4. Expansions
10. Company Profiles
10.1. British Petroleum (BP) p.l.c.
10.1.1. Business Overview
10.1.2. Company Snapshot
10.1.3. Company Market Share Analysis
10.1.4. Company Product Portfolio
10.1.5. Recent Developments
10.1.6. SWOT Analysis
10.2. Equinor ASA
10.2.1. Business Overview
10.2.2. Company Snapshot
10.2.3. Company Market Share Analysis
10.2.4. Company Product Portfolio
10.2.5. Recent Developments
10.2.6. SWOT Analysis
10.3. Chevron Corporation
10.3.1. Business Overview
10.3.2. Company Snapshot
10.3.3. Company Market Share Analysis
10.3.4. Company Product Portfolio
10.3.5. Recent Developments
10.3.6. SWOT Analysis
10.4. Gazprom Energy
10.4.1. Business Overview
10.4.2. Company Snapshot
10.4.3. Company Market Share Analysis
10.4.4. Company Product Portfolio
10.4.5. Recent Developments
10.4.6. SWOT Analysis
10.5. China Petroleum & Chemical Corporation
10.5.1. Business Overview
10.5.2. Company Snapshot
10.5.3. Company Market Share Analysis
10.5.4. Company Product Portfolio
10.5.5. Recent Developments
10.5.6. SWOT Analysis
10.6. Eni SpA
10.6.1. Business Overview
10.6.2. Company Snapshot
10.6.3. Company Market Share Analysis
10.6.4. Company Product Portfolio
10.6.5. Recent Developments
10.6.6. SWOT Analysis
10.7. Exxon Mobil Corporation
10.7.1. Business Overview
10.7.2. Company Snapshot
10.7.3. Company Market Share Analysis
10.7.4. Company Product Portfolio
10.7.5. Recent Developments
10.7.6. SWOT Analysis
10.8. Royal Dutch Shell PLC
10.8.1. Business Overview
10.8.2. Company Snapshotx`
10.8.3. Company Market Share Analysis
10.8.4. Company Product Portfolio
10.8.5. Recent Developments
10.8.6. SWOT Analysis
10.9. PetroChina Company Limited
10.9.1. Business Overview
10.9.2. Company Snapshot
10.9.3. Company Market Share Analysis
10.9.4. Company Product Portfolio
10.9.5. Recent Developments
10.9.6. SWOT Analysis
10.10. Total S.A.
10.10.1. Business Overview
10.10.2. Company Snapshot
10.10.3. Company Market Share Analysis
10.10.4. Company Product Portfolio
10.10.5. Recent Developments
10.10.6. SWOT Analysis
List of Table
1. Global Small-Scale Liquefied Natural Gas (LNG) Market, By Type, 2019-2032 (USD Billion)
2. Global Liquefaction Terminal, Small-Scale Liquefied Natural Gas (LNG) Market, By Region, 2019-2032 (USD Billion)
3. Global Regasification Terminal, Small-Scale Liquefied Natural Gas (LNG) Market, By Region, 2019-2032 (USD Billion)
4. Global Small-Scale Liquefied Natural Gas (LNG) Market, By Application, 2019-2032 (USD Billion)
5. Global Power Generation, Small-Scale Liquefied Natural Gas (LNG) Market, By Region, 2019-2032 (USD Billion)
6. Global Transportation Fuel, Small-Scale Liquefied Natural Gas (LNG) Market, By Region, 2019-2032 (USD Billion)
7. Global Others, Small-Scale Liquefied Natural Gas (LNG) Market, By Region, 2019-2032 (USD Billion)
8. North America Small-Scale Liquefied Natural Gas (LNG) Market, By Type, 2019-2032 (USD Billion)
9. North America Small-Scale Liquefied Natural Gas (LNG) Market, By Application, 2019-2032 (USD Billion)
10. U.S. Small-Scale Liquefied Natural Gas (LNG) Market, By Type, 2019-2032 (USD Billion)
11. U.S. Small-Scale Liquefied Natural Gas (LNG) Market, By Application, 2019-2032 (USD Billion)
12. Canada Small-Scale Liquefied Natural Gas (LNG) Market, By Type, 2019-2032 (USD Billion)
13. Canada Small-Scale Liquefied Natural Gas (LNG) Market, By Application, 2019-2032 (USD Billion)
14. Mexico Small-Scale Liquefied Natural Gas (LNG) Market, By Type, 2019-2032 (USD Billion)
15. Mexico Small-Scale Liquefied Natural Gas (LNG) Market, By Application, 2019-2032 (USD Billion)
16. Europe Small-Scale Liquefied Natural Gas (LNG) Market, By Type, 2019-2032 (USD Billion)
17. Europe Small-Scale Liquefied Natural Gas (LNG) Market, By Application, 2019-2032 (USD Billion)
18. Germany Small-Scale Liquefied Natural Gas (LNG) Market, By Type, 2019-2032 (USD Billion)
19. Germany Small-Scale Liquefied Natural Gas (LNG) Market, By Application, 2019-2032 (USD Billion)
20. France Small-Scale Liquefied Natural Gas (LNG) Market, By Type, 2019-2032 (USD Billion)
21. France Small-Scale Liquefied Natural Gas (LNG) Market, By Application, 2019-2032 (USD Billion)
22. U.K. Small-Scale Liquefied Natural Gas (LNG) Market, By Type, 2019-2032 (USD Billion)
23. U.K. Small-Scale Liquefied Natural Gas (LNG) Market, By Application, 2019-2032 (USD Billion)
24. Italy Small-Scale Liquefied Natural Gas (LNG) Market, By Type, 2019-2032 (USD Billion)
25. Italy Small-Scale Liquefied Natural Gas (LNG) Market, By Application, 2019-2032 (USD Billion)
26. Spain Small-Scale Liquefied Natural Gas (LNG) Market, By Type, 2019-2032 (USD Billion)
27. Spain Small-Scale Liquefied Natural Gas (LNG) Market, By Application, 2019-2032 (USD Billion)
28. Asia Pacific Small-Scale Liquefied Natural Gas (LNG) Market, By Type, 2019-2032 (USD Billion)
29. Asia Pacific Small-Scale Liquefied Natural Gas (LNG) Market, By Application, 2019-2032 (USD Billion)
30. Japan Small-Scale Liquefied Natural Gas (LNG) Market, By Type, 2019-2032 (USD Billion)
31. Japan Small-Scale Liquefied Natural Gas (LNG) Market, By Application, 2019-2032 (USD Billion)
32. China Small-Scale Liquefied Natural Gas (LNG) Market, By Type, 2019-2032 (USD Billion)
33. China Small-Scale Liquefied Natural Gas (LNG) Market, By Application, 2019-2032 (USD Billion)
34. India Small-Scale Liquefied Natural Gas (LNG) Market, By Type, 2019-2032 (USD Billion)
35. India Small-Scale Liquefied Natural Gas (LNG) Market, By Application, 2019-2032 (USD Billion)
36. South America Small-Scale Liquefied Natural Gas (LNG) Market, By Type, 2019-2032 (USD Billion)
37. South America Small-Scale Liquefied Natural Gas (LNG) Market, By Application, 2019-2032 (USD Billion)
38. Brazil Small-Scale Liquefied Natural Gas (LNG) Market, By Type, 2019-2032 (USD Billion)
39. Brazil Small-Scale Liquefied Natural Gas (LNG) Market, By Application, 2019-2032 (USD Billion)
40. Middle East and Africa Small-Scale Liquefied Natural Gas (LNG) Market, By Type, 2019-2032 (USD Billion)
41. Middle East and Africa Small-Scale Liquefied Natural Gas (LNG) Market, By Application, 2019-2032 (USD Billion)
42. UAE Small-Scale Liquefied Natural Gas (LNG) Market, By Type, 2019-2032 (USD Billion)
43. UAE Small-Scale Liquefied Natural Gas (LNG) Market, By Application, 2019-2032 (USD Billion)
44. South Africa Small-Scale Liquefied Natural Gas (LNG) Market, By Type, 2019-2032 (USD Billion)
45. South Africa Small-Scale Liquefied Natural Gas (LNG) Market, By Application, 2019-2032 (USD Billion)
List of Figures
1. Global Small-Scale Liquefied Natural Gas (LNG) Market Segmentation
2. Global Small-Scale Liquefied Natural Gas (LNG) Market: Research Methodology
3. Market Size Estimation Methodology: Bottom-Up Approach
4. Market Size Estimation Methodology: Top-Down Approach
5. Data Triangulation
6. Porter’s Five Forces Analysis
7. Value Chain Analysis
8. Global Small-Scale Liquefied Natural Gas (LNG) Market Attractiveness Analysis by Type
9. Global Small-Scale Liquefied Natural Gas (LNG) Market Attractiveness Analysis by Application
10. Global Small-Scale Liquefied Natural Gas (LNG) Market Attractiveness Analysis by Region
11. Global Small-Scale Liquefied Natural Gas (LNG) Market: Dynamics
12. Global Small-Scale Liquefied Natural Gas (LNG) Market Share by Type (2023 & 2032)
13. Global Small-Scale Liquefied Natural Gas (LNG) Market Share by Application (2023 & 2032)
14. Global Small-Scale Liquefied Natural Gas (LNG) Market Share by Regions (2023 & 2032)
15. Global Small-Scale Liquefied Natural Gas (LNG) Market Share by Company (2022)
This study forecasts global, regional, and country revenue from 2019 to 2032. The Brainy Insights has segmented the global small-scale liquefied natural gas (LNG) market based on the below-mentioned segments:
Global Small-Scale Liquefied Natural Gas (LNG) Market by Type:
Global Small-Scale Liquefied Natural Gas (LNG) Market by Application:
Global Small-Scale Liquefied Natural Gas (LNG) Market by Region:
Research has its special purpose to undertake marketing efficiently. In this competitive scenario, businesses need information across all industry verticals; the information about customer wants, market demand, competition, industry trends, distribution channels etc. This information needs to be updated regularly because businesses operate in a dynamic environment. Our organization, The Brainy Insights incorporates scientific and systematic research procedures in order to get proper market insights and industry analysis for overall business success. The analysis consists of studying the market from a miniscule level wherein we implement statistical tools which helps us in examining the data with accuracy and precision.
Our research reports feature both; quantitative and qualitative aspects for any market. Qualitative information for any market research process are fundamental because they reveal the customer needs and wants, usage and consumption for any product/service related to a specific industry. This in turn aids the marketers/investors in knowing certain perceptions of the customers. Qualitative research can enlighten about the different product concepts and designs along with unique service offering that in turn, helps define marketing problems and generate opportunities. On the other hand, quantitative research engages with the data collection process through interviews, e-mail interactions, surveys and pilot studies. Quantitative aspects for the market research are useful to validate the hypotheses generated during qualitative research method, explore empirical patterns in the data with the help of statistical tools, and finally make the market estimations.
The Brainy Insights offers comprehensive research and analysis, based on a wide assortment of factual insights gained through interviews with CXOs and global experts and secondary data from reliable sources. Our analysts and industry specialist assume vital roles in building up statistical tools and analysis models, which are used to analyse the data and arrive at accurate insights with exceedingly informative research discoveries. The data provided by our organization have proven precious to a diverse range of companies, facilitating them to address issues such as determining which products/services are the most appealing, whether or not customers use the product in the manner anticipated, the purchasing intentions of the market and many others.
Our research methodology encompasses an idyllic combination of primary and secondary initiatives. Key phases involved in this process are listed below:

The phase involves the gathering and collecting of market data and its related information with the help of different sources & research procedures.

The data procurement stage involves in data gathering and collecting through various data sources.
This stage involves in extensive research. These data sources includes:
Purchased Database: Purchased databases play a crucial role in estimating the market sizes irrespective of the domain. Our purchased database includes:
Primary Research: The Brainy Insights interacts with leading companies and experts of the concerned domain to develop the analyst team’s market understanding and expertise. It improves and substantiates every single data presented in the market reports. Primary research mainly involves in telephonic interviews, E-mail interactions and face-to-face interviews with the raw material providers, manufacturers/producers, distributors, & independent consultants. The interviews that we conduct provides valuable data on market size and industry growth trends prevailing in the market. Our organization also conducts surveys with the various industry experts in order to gain overall insights of the industry/market. For instance, in healthcare industry we conduct surveys with the pharmacists, doctors, surgeons and nurses in order to gain insights and key information of a medical product/device/equipment which the customers are going to usage. Surveys are conducted in the form of questionnaire designed by our own analyst team. Surveys plays an important role in primary research because surveys helps us to identify the key target audiences of the market. Additionally, surveys helps to identify the key target audience engaged with the market. Our survey team conducts the survey by targeting the key audience, thus gaining insights from them. Based on the perspectives of the customers, this information is utilized to formulate market strategies. Moreover, market surveys helps us to understand the current competitive situation of the industry. To be precise, our survey process typically involve with the 360 analysis of the market. This analytical process begins by identifying the prospective customers for a product or service related to the market/industry to obtain data on how a product/service could fit into customers’ lives.

Secondary Research: The secondary data sources includes information published by the on-profit organizations such as World bank, WHO, company fillings, investor presentations, annual reports, national government documents, statistical databases, blogs, articles, white papers and others. From the annual report, we analyse a company’s revenue to understand the key segment and market share of that organization in a particular region. We analyse the company websites and adopt the product mapping technique which is important for deriving the segment revenue. In the product mapping method, we select and categorize the products offered by the companies catering to domain specific market, deduce the product revenue for each of the companies so as to get overall estimation of the market size. We also source data and analyses trends based on information received from supply side and demand side intermediaries in the value chain. The supply side denotes the data gathered from supplier, distributor, wholesaler and the demand side illustrates the data gathered from the end customers for respective market domain.

The supply side for a domain specific market is analysed by:
The demand side for the market is estimated through:
In-house Library: Apart from these third-party sources, we have our in-house library of qualitative and quantitative information. Our in-house database includes market data for various industry and domains. These data are updated on regular basis as per the changing market scenario. Our library includes, historic databases, internal audit reports and archives.
Sometimes there are instances where there is no metadata or raw data available for any domain specific market. For those cases, we use our expertise to forecast and estimate the market size in order to generate comprehensive data sets. Our analyst team adopt a robust research technique in order to produce the estimates:
Data Synthesis: This stage involves the analysis & mapping of all the information obtained from the previous step. It also involves in scrutinizing the data for any discrepancy observed while data gathering related to the market. The data is collected with consideration to the heterogeneity of sources. Robust scientific techniques are in place for synthesizing disparate data sets and provide the essential contextual information that can orient market strategies. The Brainy Insights has extensive experience in data synthesis where the data passes through various stages:


Market Deduction & Formulation: The final stage comprises of assigning data points at appropriate market spaces so as to deduce feasible conclusions. Analyst perspective & subject matter expert based holistic form of market sizing coupled with industry analysis also plays a crucial role in this stage.
This stage involves in finalization of the market size and numbers that we have collected from data integration step. With data interpolation, it is made sure that there is no gap in the market data. Successful trend analysis is done by our analysts using extrapolation techniques, which provide the best possible forecasts for the market.
Data Validation & Market Feedback: Validation is the most important step in the process. Validation & re-validation via an intricately designed process helps us finalize data-points to be used for final calculations.

The Brainy Insights interacts with leading companies and experts of the concerned domain to develop the analyst team’s market understanding and expertise. It improves and substantiates every single data presented in the market reports. The data validation interview and discussion panels are typically composed of the most experienced industry members. The participants include, however, are not limited to:
Moreover, we always validate our data and findings through primary respondents from all the major regions we are working on.


Free Customization
Fortune 500 Clients
Free Yearly Update On Purchase Of Multi/Corporate License
Companies Served Till Date