- +1-315-215-1633
- sales@thebrainyinsights.com

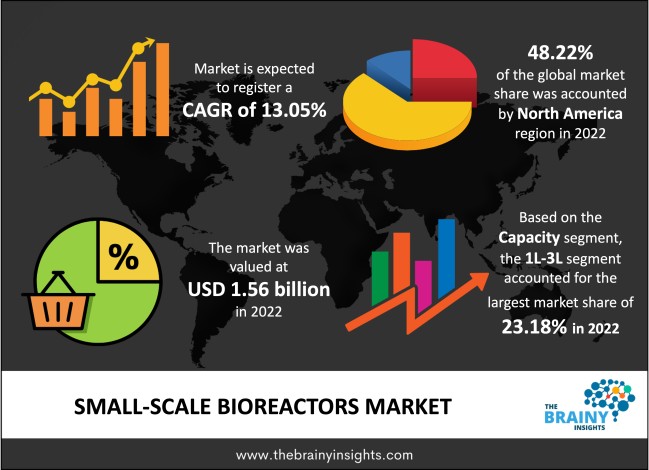
The global small-scale bioreactors market was valued at USD 1.56 billion in 2022, increasing at a CAGR of 13.05% from 2023 to 2032 and anticipated to reach USD 5.32 billion by 2032. Asia Pacific is expected to grow the fastest during the forecast period. Also, an increase in investment and the number of biomanufacturing facilities is expected to propel the market growth during the forecast period.
Bioreactors are basically bioprocessing devices that have been used for biochemical processing. The various bioreactors are planned as round & hollow designs and come in multiple sizes and limits with varying materials like carbon steel, glass bioreactors, artistic bioreactors, Polytetrafluoroethylene (PTFE) plastic, and tempered steel bioreactors. Small-scale systems have traditionally been used for preliminary research, such as screening many experimental conditions. Single-use bioreactor utilizes disposable bag instead of reusable steel vessel operated in conventional bioreactors. Small-scale bioreactors (less than 100 mL working volume) require fewer cells, are more economical, and require less labour than larger bioreactors. Using small-scale bioreactors potentially permits high-throughput experimentation to test operating & growth conditions (media components, agitation rate, cell density) and the resulting interactions. Small-scale bioreactors shorten the turnaround time by saving time on assembly, sanitization, and autoclaving processes. A scalable, small-scale suspension bioreactor system would need fewer cells & less labour than was previously possible with larger suspension bioreactors.
Get an overview of this study by requesting a free sample
The increased adoption of single-use bioreactors: The increased usage of single-use bioreactors by biopharmaceutical companies and research institutions drives the market growth. Moreover, the increasing demand for monoclonal antibodies and biosimilars and the rising usage of single-use bioreactors for mammalian cell culture in several research studies are the driving factors of the market growth. Single-use bioreactors, also called disposable bioreactors, use disposable bags rather than stainless steel or glass culture vessels. Single-use bioreactors have a broad range of uses in academic & industrial laboratories, including pharmaceutical, drug discovery, environmental, and life science research for producing vaccines, cell culture, antibodies, and biofuels, among other things. These factors are also helping to boost the market growth. However, single-use bioreactors (SUBs) reduce labour costs, minimize the risk of cross-contamination, and eliminate cleaning process and verification issues.
The lack of availability: The regulatory concerns regarding the use of bioreactors, and increasingly stringent government policies, are expected to hinder the market growth. Also, the large-scale disposal of plastic derivatives is becoming a growing environmental concern, which is expected to hamper market growth during the forecast period.
The rising R&D activities: The growing R&D activities for preventive vaccine development worldwide have raised the demand for clinical-stage bioreactors. Further, the ever-increasing prevalence of chronic disorders and other infectious diseases, the robustness of venture capital investments, and the increasing demand for therapeutically effective vaccines are expected to propel market growth. Additionally, the considerable expansion potential of developing nations like Indonesia, India, and China could be explained by strong growth in the individual biotechnology and pharmaceutical industries because of the availability of trained labour, low-cost and far less restrictive regulatory laws. These factors are also helping to boost the market growth over the forecast period.
The regions analyzed for the market include Europe, South America, Asia Pacific, North America, the Middle East, and Africa. North America emerged as the largest global small-scale bioreactors market, with a 48.22% market revenue share in 2022. North America dominates the small-scale bioreactors market due to the increasing number of product launches. Moreover, the presence of many biopharmaceutical and biotechnology companies, coupled with the rising prevalence of chronic diseases, is anticipated to propel the market growth in this region over the forthcoming year. Additionally, the growing application of single-use and the innovation of new products are expected to drive market growth in this region. Asia Pacific is expected to grow the fastest during the forecast period due to the increasing investments in life sciences research. Moreover, the presence of key manufacturers of bioreactors, increasing demand for effective therapeutics, and the presence of several service providers and a higher concentration & number of biopharmaceutical firms are expected to drive the market growth in this region over the forecast period. Additionally, favourable government initiatives for developing healthcare infrastructure propel the market growth during the forecast period.
North America Region Small-Scale Bioreactors Market Share in 2022 - 48.22%
www.thebrainyinsights.com
Check the geographical analysis of this market by requesting a free sample
The capacity segment is divided into 5 ML -100 ML, 100 ML-250 ML, 250 ML -500 ML, 500 ML-1 L, 1L-3L, and 3L-5L. The 1L-3L segment dominated, with a market share of around 23.18% in 2022. This growth is attributed to the broad-scale availability of bioreactors with a working volume capacity of 1L-3L.
The product segment is divided into single-use bioreactors and reusable bioreactors. The reusable bioreactors sub-segment is divided into glass bioreactors and stainless-steel bioreactors. In 2022, the single-use bioreactors segment dominated the market with 56.21% and a revenue of USD 0.87 billion. This growth is attributed to the increase in government support for biopharmaceutical research. Additionally, an increase in the focus of key manufacturers on offering small-scale bioreactors and the technological advancements in single-use bioreactors is expected to boost the segment’s market growth. Further, by 2032, the reusable bioreactors segment will likely dominate the market due to their increased use in bulk product manufacturing. Due to its rigid design, the reusable bioreactor has multiple other advantages, like a long lifespan, flexible accessory configuration, low costs, a long lifespan, and simple handling.
The end-user segment is divided into CROs & CMOs, pharmaceutical & biopharmaceutical companies, and academic & research institutes. In 2022, the CROs & CMOs segment dominated the market with 45.13% and a revenue of USD 0.70 billion. This growth is attributed to the increasing interest of conventional drug developers in biological therapeutics. Further, by 2032, the pharmaceutical & biopharmaceutical companies segment will likely dominate the market due to the rising elderly population base.
| Attribute | Description |
|---|---|
| Market Size | Revenue (USD Billion) |
| Market size value in 2022 | USD 1.56 billion |
| Market size value in 2032 | USD 5.32 billion |
| CAGR (2023 to 2032) | 13.05% |
| Historical data | 2019-2021 |
| Base Year | 2022 |
| Forecast | 2023-2032 |
| Regional Segments | The key regions are North America, South America, Europe, Asia Pacific, and Middle East & Africa. |
| Segments | Key Segments are capacity, product, end-user, and regions |
North America region emerged as the largest market for small-scale bioreactors.
The market's growth will be influenced by the increased adoption of single-use bioreactors.
The lack of availability could hamper the market growth.
The rising R&D activities will provide huge opportunities to the market.
Key players include Thermo Fisher Scientific Inc., Sartorius AG, Eppendorf AG, Lonza Group, Merck KGaA, Eppendorf AG, Danaher Corp, Solaris Biotechnology Srl, Getinge AB, Miltenyi Biotec, Infors AG, and among others
1. Introduction
1.1. Objectives of the Study
1.2. Market Definition
1.3. Research Scope
1.4. Currency
1.5. Key Target Audience
2. Research Methodology and Assumptions
3. Executive Summary
4. Premium Insights
4.1. Porter’s Five Forces Analysis
4.2. Value Chain Analysis
4.3. Top Investment Pockets
4.3.1. Market Attractiveness Analysis By Capacity
4.3.2. Market Attractiveness Analysis By Product
4.3.3. Market Attractiveness Analysis By End-User
4.3.4. Market Attractiveness Analysis By Region
4.4. Industry Trends
5. Market Dynamics
5.1. Market Evaluation
5.2. Drivers
5.2.1. The growth of bioreactors in pharmaceuticals
5.2.2. The increased adoption of single-use bioreactors
5.3. Restraints
5.3.1. The lack of availability
5.3.2. The concerns regarding the use of single-use bioreactors (SUBs)
5.4. Opportunities
5.4.1. The rising R&D activities
5.4.2. The technological advancements in single-use bioreactors
6. Global Small-Scale Bioreactors Market Analysis and Forecast, By Capacity
6.1. Segment Overview
6.2. 5 ML -100 ML
6.3. 100 ML-250 ML
6.4. 250 ML -500 ML
6.5. 500 ML-1 L
6.6. 1L-3L
6.7. 3L-5L
7. Global Small-Scale Bioreactors Market Analysis and Forecast, By Product
7.1. Segment Overview
7.2. Single-Use Bioreactors
7.3. Reusable Bioreactors
7.3.1. Glass Bioreactors
7.3.2. Stainless-Steel Bioreactors
8. Global Small-Scale Bioreactors Market Analysis and Forecast, By End-User
8.1. Segment Overview
8.2. CROs & CMOs
8.3. Pharmaceutical & Biopharmaceutical Companies
8.4. Academic & Research Institutes
9. Global Small-Scale Bioreactors Market Analysis and Forecast, By Regional Analysis
9.1. Segment Overview
9.2. North America
9.2.1. U.S.
9.2.2. Canada
9.2.3. Mexico
9.3. Europe
9.3.1. Germany
9.3.2. France
9.3.3. U.K.
9.3.4. Italy
9.3.5. Spain
9.4. Asia-Pacific
9.4.1. Japan
9.4.2. China
9.4.3. India
9.5. South America
9.5.1. Brazil
9.6. Middle East and Africa
9.6.1. UAE
9.6.2. South Africa
10. Global Small-Scale Bioreactors Market-Competitive Landscape
10.1. Overview
10.2. Market Share of Key Players in Global Small-Scale Bioreactors Market
10.2.1. Global Company Market Share
10.2.2. North America Company Market Share
10.2.3. Europe Company Market Share
10.2.4. APAC Company Market Share
10.3. Competitive Situations and Trends
10.3.1. Product Launches and Developments
10.3.2. Partnerships, Collaborations, and Agreements
10.3.3. Mergers & Acquisitions
10.3.4. Expansions
11. Company Profiles
11.1. Thermo Fisher Scientific Inc.
11.1.1. Business Overview
11.1.2. Company Snapshot
11.1.3. Company Market Share Analysis
11.1.4. Company Product Portfolio
11.1.5. Recent Developments
11.1.6. SWOT Analysis
11.2. Sartorius AG
11.2.1. Business Overview
11.2.2. Company Snapshot
11.2.3. Company Market Share Analysis
11.2.4. Company Product Portfolio
11.2.5. Recent Developments
11.2.6. SWOT Analysis
11.3. Eppendorf AG
11.3.1. Business Overview
11.3.2. Company Snapshot
11.3.3. Company Market Share Analysis
11.3.4. Company Product Portfolio
11.3.5. Recent Developments
11.3.6. SWOT Analysis
11.4. Lonza Group
11.4.1. Business Overview
11.4.2. Company Snapshot
11.4.3. Company Market Share Analysis
11.4.4. Company Product Portfolio
11.4.5. Recent Developments
11.4.6. SWOT Analysis
11.5. Merck KGaA
11.5.1. Business Overview
11.5.2. Company Snapshot
11.5.3. Company Market Share Analysis
11.5.4. Company Product Portfolio
11.5.5. Recent Developments
11.5.6. SWOT Analysis
11.6. Eppendorf AG
11.6.1. Business Overview
11.6.2. Company Snapshot
11.6.3. Company Market Share Analysis
11.6.4. Company Product Portfolio
11.6.5. Recent Developments
11.6.6. SWOT Analysis
11.7. Danaher Corp
11.7.1. Business Overview
11.7.2. Company Snapshot
11.7.3. Company Market Share Analysis
11.7.4. Company Product Portfolio
11.7.5. Recent Developments
11.7.6. SWOT Analysis
11.8. Solaris Biotechnology Srl
11.8.1. Business Overview
11.8.2. Company Snapshot
11.8.3. Company Market Share Analysis
11.8.4. Company Product Portfolio
11.8.5. Recent Developments
11.8.6. SWOT Analysis
11.9. Getinge AB
11.9.1. Business Overview
11.9.2. Company Snapshot
11.9.3. Company Market Share Analysis
11.9.4. Company Product Portfolio
11.9.5. Recent Developments
11.9.6. SWOT Analysis
11.10. Miltenyi Biotec
11.10.1. Business Overview
11.10.2. Company Snapshot
11.10.3. Company Market Share Analysis
11.10.4. Company Product Portfolio
11.10.5. Recent Developments
11.10.6. SWOT Analysis
11.11. Infors AG
11.11.1. Business Overview
11.11.2. Company Snapshot
11.11.3. Company Market Share Analysis
11.11.4. Company Product Portfolio
11.11.5. Recent Developments
11.11.6. SWOT Analysis
List of Table
1. Global Small-Scale Bioreactors Market, By Capacity, 2019-2032 (USD Billion)
2. Global 5 ML -100 ML, Small-Scale Bioreactors Market, By Region, 2019-2032 (USD Billion)
3. Global 100 ML-250 ML, Small-Scale Bioreactors Market, By Region, 2019-2032 (USD Billion)
4. Global 250 ML -500 ML, Small-Scale Bioreactors Market, By Region, 2019-2032 (USD Billion)
5. Global 500 ML-1 L, Small-Scale Bioreactors Market, By Region, 2019-2032 (USD Billion)
6. Global 1L-3L, Small-Scale Bioreactors Market, By Region, 2019-2032 (USD Billion)
7. Global 3L-5L, Small-Scale Bioreactors Market, By Region, 2019-2032 (USD Billion)
8. Global Small-Scale Bioreactors Market, By Product, 2019-2032 (USD Billion)
9. Global Single-Use Bioreactors, Small-Scale Bioreactors Market, By Region, 2019-2032 (USD Billion)
10. Global Reusable Bioreactors, Small-Scale Bioreactors Market, By Region, 2019-2032 (USD Billion)
11. Global Small-Scale Bioreactors Market, By End-User, 2019-2032 (USD Billion)
12. Global CROs & CMOs, Small-Scale Bioreactors Market, By Region, 2019-2032 (USD Billion)
13. Global Pharmaceutical & Biopharmaceutical Companies, Small-Scale Bioreactors Market, By Region, 2019-2032 (USD Billion)
14. Global Academic & Research Institutes, Small-Scale Bioreactors Market, By Region, 2019-2032 (USD Billion)
15. North America Small-Scale Bioreactors Market, By Capacity, 2019-2032 (USD Billion)
16. North America Small-Scale Bioreactors Market, By Product, 2019-2032 (USD Billion)
17. North America Small-Scale Bioreactors Market, By End-User, 2019-2032 (USD Billion)
18. U.S. Small-Scale Bioreactors Market, By Capacity, 2019-2032 (USD Billion)
19. U.S. Small-Scale Bioreactors Market, By Product, 2019-2032 (USD Billion)
20. U.S. Small-Scale Bioreactors Market, By End-User, 2019-2032 (USD Billion)
21. Canada Small-Scale Bioreactors Market, By Capacity, 2019-2032 (USD Billion)
22. Canada Small-Scale Bioreactors Market, By Product, 2019-2032 (USD Billion)
23. Canada Small-Scale Bioreactors Market, By End-User, 2019-2032 (USD Billion)
24. Mexico Small-Scale Bioreactors Market, By Capacity, 2019-2032 (USD Billion)
25. Mexico Small-Scale Bioreactors Market, By Product, 2019-2032 (USD Billion)
26. Mexico Small-Scale Bioreactors Market, By End-User, 2019-2032 (USD Billion)
27. Europe Small-Scale Bioreactors Market, By Capacity, 2019-2032 (USD Billion)
28. Europe Small-Scale Bioreactors Market, By Product, 2019-2032 (USD Billion)
29. Europe Small-Scale Bioreactors Market, By End-User, 2019-2032 (USD Billion)
30. Germany Small-Scale Bioreactors Market, By Capacity, 2019-2032 (USD Billion)
31. Germany Small-Scale Bioreactors Market, By Product, 2019-2032 (USD Billion)
32. Germany Small-Scale Bioreactors Market, By End-User, 2019-2032 (USD Billion)
33. France Small-Scale Bioreactors Market, By Capacity, 2019-2032 (USD Billion)
34. France Small-Scale Bioreactors Market, By Product, 2019-2032 (USD Billion)
35. France Small-Scale Bioreactors Market, By End-User, 2019-2032 (USD Billion)
36. U.K. Small-Scale Bioreactors Market, By Capacity, 2019-2032 (USD Billion)
37. U.K. Small-Scale Bioreactors Market, By Product, 2019-2032 (USD Billion)
38. U.K. Small-Scale Bioreactors Market, By End-User, 2019-2032 (USD Billion)
39. Italy Small-Scale Bioreactors Market, By Capacity, 2019-2032 (USD Billion)
40. Italy Small-Scale Bioreactors Market, By Product, 2019-2032 (USD Billion)
41. Italy Small-Scale Bioreactors Market, By End-User, 2019-2032 (USD Billion)
42. Spain Small-Scale Bioreactors Market, By Capacity, 2019-2032 (USD Billion)
43. Spain Small-Scale Bioreactors Market, By Product, 2019-2032 (USD Billion)
44. Spain Small-Scale Bioreactors Market, By End-User, 2019-2032 (USD Billion)
45. Asia Pacific Small-Scale Bioreactors Market, By Capacity, 2019-2032 (USD Billion)
46. Asia Pacific Small-Scale Bioreactors Market, By Product, 2019-2032 (USD Billion)
47. Asia Pacific Small-Scale Bioreactors Market, By End-User, 2019-2032 (USD Billion)
48. Japan Small-Scale Bioreactors Market, By Capacity, 2019-2032 (USD Billion)
49. Japan Small-Scale Bioreactors Market, By Product, 2019-2032 (USD Billion)
50. Japan Small-Scale Bioreactors Market, By End-User, 2019-2032 (USD Billion)
51. China Small-Scale Bioreactors Market, By Capacity, 2019-2032 (USD Billion)
52. China Small-Scale Bioreactors Market, By Product, 2019-2032 (USD Billion)
53. China Small-Scale Bioreactors Market, By End-User, 2019-2032 (USD Billion)
54. India Small-Scale Bioreactors Market, By Capacity, 2019-2032 (USD Billion)
55. India Small-Scale Bioreactors Market, By Product, 2019-2032 (USD Billion)
56. India Small-Scale Bioreactors Market, By End-User, 2019-2032 (USD Billion)
57. South America Small-Scale Bioreactors Market, By Capacity, 2019-2032 (USD Billion)
58. South America Small-Scale Bioreactors Market, By Product, 2019-2032 (USD Billion)
59. South America Small-Scale Bioreactors Market, By End-User, 2019-2032 (USD Billion)
60. Brazil Small-Scale Bioreactors Market, By Capacity, 2019-2032 (USD Billion)
61. Brazil Small-Scale Bioreactors Market, By Product, 2019-2032 (USD Billion)
62. Brazil Small-Scale Bioreactors Market, By End-User, 2019-2032 (USD Billion)
63. Middle East and Africa Small-Scale Bioreactors Market, By Capacity, 2019-2032 (USD Billion)
64. Middle East and Africa Small-Scale Bioreactors Market, By Product, 2019-2032 (USD Billion)
65. Middle East and Africa Small-Scale Bioreactors Market, By End-User, 2019-2032 (USD Billion)
66. UAE Small-Scale Bioreactors Market, By Capacity, 2019-2032 (USD Billion)
67. UAE Small-Scale Bioreactors Market, By Product, 2019-2032 (USD Billion)
68. UAE Small-Scale Bioreactors Market, By End-User, 2019-2032 (USD Billion)
69. South Africa Small-Scale Bioreactors Market, By Capacity, 2019-2032 (USD Billion)
70. South Africa Small-Scale Bioreactors Market, By Product, 2019-2032 (USD Billion)
71. South Africa Small-Scale Bioreactors Market, By End-User, 2019-2032 (USD Billion)
List of Figures
1. Global Small-Scale Bioreactors Market Segmentation
2. Global Small-Scale Bioreactors Market: Research Methodology
3. Market Size Estimation Methodology: Bottom-Up Approach
4. Market Size Estimation Methodology: Top- Approach
5. Data Triangulation
6. Porter’s Five Forces Analysis
7. Value Chain Analysis
8. Global Small-Scale Bioreactors Market Attractiveness Analysis By Capacity
9. Global Small-Scale Bioreactors Market Attractiveness Analysis By Product
10. Global Small-Scale Bioreactors Market Attractiveness Analysis By End-User
11. Global Small-Scale Bioreactors Market Attractiveness Analysis By Region
12. Global Small-Scale Bioreactors Market: Dynamics
13. Global Small-Scale Bioreactors Market Share By Capacity (2023 & 2032)
14. Global Small-Scale Bioreactors Market Share By Product (2023 & 2032)
15. Global Small-Scale Bioreactors Market Share By End-User (2023 & 2032)
16. Global Small-Scale Bioreactors Market Share By Regions (2023 & 2032)
17. Global Small-Scale Bioreactors Market Share By Company (2022)
This study forecasts revenue at global, regional, and country levels from 2019 to 2032. The Brainy Insights has segmented the global small-scale bioreactors based on below mentioned segments:
Global Small-Scale Bioreactors Market by Capacity:
Global Small-Scale Bioreactors Market by Product:
Global Small-Scale Bioreactors Market by End-User:
Global Small-Scale Bioreactors by Region:
Research has its special purpose to undertake marketing efficiently. In this competitive scenario, businesses need information across all industry verticals; the information about customer wants, market demand, competition, industry trends, distribution channels etc. This information needs to be updated regularly because businesses operate in a dynamic environment. Our organization, The Brainy Insights incorporates scientific and systematic research procedures in order to get proper market insights and industry analysis for overall business success. The analysis consists of studying the market from a miniscule level wherein we implement statistical tools which helps us in examining the data with accuracy and precision.
Our research reports feature both; quantitative and qualitative aspects for any market. Qualitative information for any market research process are fundamental because they reveal the customer needs and wants, usage and consumption for any product/service related to a specific industry. This in turn aids the marketers/investors in knowing certain perceptions of the customers. Qualitative research can enlighten about the different product concepts and designs along with unique service offering that in turn, helps define marketing problems and generate opportunities. On the other hand, quantitative research engages with the data collection process through interviews, e-mail interactions, surveys and pilot studies. Quantitative aspects for the market research are useful to validate the hypotheses generated during qualitative research method, explore empirical patterns in the data with the help of statistical tools, and finally make the market estimations.
The Brainy Insights offers comprehensive research and analysis, based on a wide assortment of factual insights gained through interviews with CXOs and global experts and secondary data from reliable sources. Our analysts and industry specialist assume vital roles in building up statistical tools and analysis models, which are used to analyse the data and arrive at accurate insights with exceedingly informative research discoveries. The data provided by our organization have proven precious to a diverse range of companies, facilitating them to address issues such as determining which products/services are the most appealing, whether or not customers use the product in the manner anticipated, the purchasing intentions of the market and many others.
Our research methodology encompasses an idyllic combination of primary and secondary initiatives. Key phases involved in this process are listed below:

The phase involves the gathering and collecting of market data and its related information with the help of different sources & research procedures.

The data procurement stage involves in data gathering and collecting through various data sources.
This stage involves in extensive research. These data sources includes:
Purchased Database: Purchased databases play a crucial role in estimating the market sizes irrespective of the domain. Our purchased database includes:
Primary Research: The Brainy Insights interacts with leading companies and experts of the concerned domain to develop the analyst team’s market understanding and expertise. It improves and substantiates every single data presented in the market reports. Primary research mainly involves in telephonic interviews, E-mail interactions and face-to-face interviews with the raw material providers, manufacturers/producers, distributors, & independent consultants. The interviews that we conduct provides valuable data on market size and industry growth trends prevailing in the market. Our organization also conducts surveys with the various industry experts in order to gain overall insights of the industry/market. For instance, in healthcare industry we conduct surveys with the pharmacists, doctors, surgeons and nurses in order to gain insights and key information of a medical product/device/equipment which the customers are going to usage. Surveys are conducted in the form of questionnaire designed by our own analyst team. Surveys plays an important role in primary research because surveys helps us to identify the key target audiences of the market. Additionally, surveys helps to identify the key target audience engaged with the market. Our survey team conducts the survey by targeting the key audience, thus gaining insights from them. Based on the perspectives of the customers, this information is utilized to formulate market strategies. Moreover, market surveys helps us to understand the current competitive situation of the industry. To be precise, our survey process typically involve with the 360 analysis of the market. This analytical process begins by identifying the prospective customers for a product or service related to the market/industry to obtain data on how a product/service could fit into customers’ lives.

Secondary Research: The secondary data sources includes information published by the on-profit organizations such as World bank, WHO, company fillings, investor presentations, annual reports, national government documents, statistical databases, blogs, articles, white papers and others. From the annual report, we analyse a company’s revenue to understand the key segment and market share of that organization in a particular region. We analyse the company websites and adopt the product mapping technique which is important for deriving the segment revenue. In the product mapping method, we select and categorize the products offered by the companies catering to domain specific market, deduce the product revenue for each of the companies so as to get overall estimation of the market size. We also source data and analyses trends based on information received from supply side and demand side intermediaries in the value chain. The supply side denotes the data gathered from supplier, distributor, wholesaler and the demand side illustrates the data gathered from the end customers for respective market domain.

The supply side for a domain specific market is analysed by:
The demand side for the market is estimated through:
In-house Library: Apart from these third-party sources, we have our in-house library of qualitative and quantitative information. Our in-house database includes market data for various industry and domains. These data are updated on regular basis as per the changing market scenario. Our library includes, historic databases, internal audit reports and archives.
Sometimes there are instances where there is no metadata or raw data available for any domain specific market. For those cases, we use our expertise to forecast and estimate the market size in order to generate comprehensive data sets. Our analyst team adopt a robust research technique in order to produce the estimates:
Data Synthesis: This stage involves the analysis & mapping of all the information obtained from the previous step. It also involves in scrutinizing the data for any discrepancy observed while data gathering related to the market. The data is collected with consideration to the heterogeneity of sources. Robust scientific techniques are in place for synthesizing disparate data sets and provide the essential contextual information that can orient market strategies. The Brainy Insights has extensive experience in data synthesis where the data passes through various stages:


Market Deduction & Formulation: The final stage comprises of assigning data points at appropriate market spaces so as to deduce feasible conclusions. Analyst perspective & subject matter expert based holistic form of market sizing coupled with industry analysis also plays a crucial role in this stage.
This stage involves in finalization of the market size and numbers that we have collected from data integration step. With data interpolation, it is made sure that there is no gap in the market data. Successful trend analysis is done by our analysts using extrapolation techniques, which provide the best possible forecasts for the market.
Data Validation & Market Feedback: Validation is the most important step in the process. Validation & re-validation via an intricately designed process helps us finalize data-points to be used for final calculations.

The Brainy Insights interacts with leading companies and experts of the concerned domain to develop the analyst team’s market understanding and expertise. It improves and substantiates every single data presented in the market reports. The data validation interview and discussion panels are typically composed of the most experienced industry members. The participants include, however, are not limited to:
Moreover, we always validate our data and findings through primary respondents from all the major regions we are working on.


Free Customization
Fortune 500 Clients
Free Yearly Update On Purchase Of Multi/Corporate License
Companies Served Till Date