- +1-315-215-1633
- sales@thebrainyinsights.com

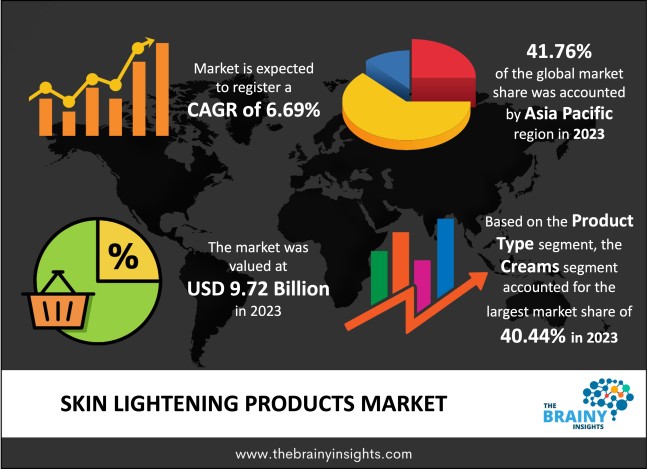
The global skin-lightening products market was valued at USD 9.72 billion in 2023 and grew at a CAGR of 6.69% from 2024 to 2033. The market is expected to reach USD 18.57 billion by 2033. The increasing awareness about personal care will drive the growth of the global skin-lightening products market.
Skincare is an essential part of personal care in the modern world. Increasing awareness and knowledge about such products have recently increased demand. The niche segment of skin-lightening products has grown significantly compared to other segments. Skin brightening products aim to reduce the melanin content in the body, which is the prime driver of skin darkening. Skin-lightening products can be used to lighten the entire face of the skin or to lighten dark spots that may have appeared due to acne marks or hyperpigmentation. Skin-lightening products are used to reduce dark pigmentation that is left after a cut, nick, or wound. Glutathione is injected into the face or skin and is the most known and asked-for ingredient for skin lightening. It can be injected directly into the skin through injections. Hydroquinone is a potent ingredient used in skin-lightening products as it effectively reduces melanocytes. Similarly, Vitamin C is also used in skin-lightening products. Vitamin C has been quite popular in the past few years as an active ingredient to brighten and lighten skin. Vitamin C is also known to effectively reduce melanin synthesis in skin cells. Furthermore, glycolic acid and kojic acid are known to lighten skin effectively. These products are available in various sizes, textures, forms and packaging. They are found in the form of creams, serums, lotions etc.
Get an overview of this study by requesting a free sample
The rising awareness about skincare – the internet and social media have contributed to growing information about skincare, their causes and solutions. The increasing knowledge and information facilitating self-awareness about one's skin, hair, and overall physical appearance have increased the demand for personal care products that cater to each person's needs and requirements. Skin lightening products are one of the most demanded products as it helps in brightening, de-tanning, exfoliation, spot treatment or reducing blemishes, pigmentation, scars etc. furthermore, the introduction of home-grown brands with natural ingredients and the concept of personalized skincare has led to the expansion of personal care products market. The rise in disposable income of the population has increased the willingness and desire to spend on personal care products. Therefore, the rising awareness about skincare will bode well for the market's growth.
The growing awareness about the side effects of skin-lightening products – several studies have examined the effects of skin-lightening products and concluded that these products are unsafe and can cause harmful side effects. One of the most significant and lethal harmful effects is mercury poising which can cause irreversible damage to organs like kidneys and liver. Furthermore, these products can lead to rashes, hives, dermatitis, skin thinning, and darkening. They also affect the mental health of the consumer besides physical consequences. The growing awareness about the side effects of skin-lightening products will hamper the market's growth.
The introduction of skin-lightening products for other body parts – for years, the skin-lightening products market was dominated by facial products. However, over the years, the products have diversified to include skin-lightening products for knees, elbows, armpits, back of the neck, inner thighs and other human body areas. Furthermore, these products have created a niche segment catering to one specific body part, thereby increasing revenue and sales for market players. Additionally, introducing natural skin-lightening products with organic ingredients claiming to be effective minus any side effects, has expanded the market. Therefore, product diversification in skin-lightening products will drive market expansion and development in the forecast period.
The regions analyzed for the market include North America, Europe, South America, Asia Pacific, the Middle East, and Africa. Asia Pacific emerged as the most significant global skin-lightening products market, with a 41.76% market revenue share in 2023.
The region's population size is a significant contributor to the market's growth. The colonization of India and other parts of the South Asian world has left a psychological imprint on the region's population concerning skin colour, meaning that lighter skin is considered more beautiful. Furthermore, the extensive advertising by skin care companies offering skin-lightening products and their endorsement by big celebrities influenced the market demand positively. Many market players offering effective skin-lightening products cater to the market demand. The increase in advertising of skin-lightening products for dark armpits, knees, elbows, necks and other body parts is also driving the market's growth.
Asia Pacific Region Skin Lightening Products Market Share in 2023 – 41.76%
www.thebrainyinsights.com
Check the geographical analysis of this market by requesting a free sample
The product type segment is divided into creams, toners, cleansers, lotions, masks and others. The creams segment dominated, with a market share of around 40.44% in 2023. Essentially, a cream is an oil and water mixture. More specifically, it is a sort of emulsion composed of oil and water phases. Creams offer moisturizing and soothing effects for the skin. They provide hydration, and the user feels the texture to be smooth and to their liking. Multiple brands offer several cream-based skin-lightening products. Furthermore, creams with skin-lightening properties can be infused with other ingredients to offer more benefits like sun protection, anti-ageing, reduced pigmentation etc. the affordability and accessibility of creams also drive the segment's growth.
The end-user segment is divided into men and women. The women's segment dominated, with a market share of around 69.56% in 2023. Women are more concerned about beauty and looks than men. They are also expected to be more presentable in society. The societal pressure and association of beauty with lighter skin for several reasons also add to women's growing demand for skin-lightening products. The majority of the products in the skincare market cater to the female audience. Skincare and personal care habits and products associated with women are more discussed than men. Beauty brands' extensive marketing and advertising target the female audience, driving the segment's growth.
The distribution channel segment is divided into supermarkets/hypermarkets, pharmacies, online, speciality stores, beauty stores, convenience stores and others. The supermarkets/hypermarkets segment dominated, with a market share of around 35.78% in 2023. Supermarkets/hypermarkets have a dedicated aisle for personal care products, within which there is a section catering to only skin care products, which offers visibility to brands and greater accessibility and choice for consumers in a single place. Supermarkets/hypermarkets have products of all kinds in all sizes. Furthermore, they offer discounts and deals from time to time. They also have free samples and demonstrations presented by different brands. The extensive network of supermarkets/hypermarkets makes them a preferred choice over other sales channels as it is convenient, affordable, accessible and familiar for consumers.
| Attribute | Description |
|---|---|
| Market Size | Revenue (USD Billion) |
| Market size value in 2023 | USD 9.72 Billion |
| Market size value in 2033 | USD 18.57 Billion |
| CAGR (2024 to 2033) | 6.69% |
| Historical data | 2020-2022 |
| Base Year | 2023 |
| Forecast | 2024-2033 |
| Region | The regions analyzed for the market are Asia Pacific, Europe, South America, North America, and Middle East & Africa. Furthermore, the regions are further analyzed at the country level. |
| Segments | Product Type, End-User and Distribution Channel |
As per The Brainy Insights, the size of the global skin lightening products market was valued at USD 9.72 billion in 2023 to USD 18.57 billion by 2033.
Global skin lightening products market is growing at a CAGR of 6.69% during the forecast period 2024-2033.
The market's growth will be influenced by the rising awareness about skin care.
The growing awareness about the side effects of skin lightening products could hamper the market growth.
1. Introduction
1.1. Objectives of the Study
1.2. Market Definition
1.3. Research Scope
1.4. Currency
1.5. Key Target Audience
2. Research Methodology and Assumptions
3. Executive Summary
4. Premium Insights
4.1. Porter’s Five Forces Analysis
4.2. Value Chain Analysis
4.3. Top Investment Pockets
4.3.1. Market Attractiveness Analysis by Product Type
4.3.2. Market Attractiveness Analysis by End User
4.3.3. Market Attractiveness Analysis by Distribution Channel
4.3.4. Market Attractiveness Analysis by Region
4.4. Industry Trends
5. Market Dynamics
5.1. Market Evaluation
5.2. Drivers
5.2.1. The rising awareness about skin care
5.3. Restraints
5.3.1. The growing awareness about the side effects of skin lightening products
5.4. Opportunities
5.4.1. The introduction of skin lightening products for other body parts
5.5. Challenges
5.5.1. The vocal activism against colourism
6. Global Skin Lightening Products Market Analysis and Forecast, By Product Type
6.1. Segment Overview
6.2. Creams
6.3. Toners
6.4. Cleansers
6.5. Lotions
6.6. Masks
6.7. Others
7. Global Skin Lightening Products Market Analysis and Forecast, By End User
7.1. Segment Overview
7.2. Men
7.3. Women
8. Global Skin Lightening Products Market Analysis and Forecast, By Distribution Channel
8.1. Segment Overview
8.2. Supermarkets/Hypermarkets
8.3. Pharmacies
8.4. Online
8.5. Specialty Stores
8.6. Beauty Stores
8.7. Convenience Stores
8.8. Others
9. Global Skin Lightening Products Market Analysis and Forecast, By Regional Analysis
9.1. Segment Overview
9.2. North America
9.2.1. U.S.
9.2.2. Canada
9.2.3. Mexico
9.3. Europe
9.3.1. Germany
9.3.2. France
9.3.3. U.K.
9.3.4. Italy
9.3.5. Spain
9.4. Asia-Pacific
9.4.1. Japan
9.4.2. China
9.4.3. India
9.5. South America
9.5.1. Brazil
9.6. Middle East and Africa
9.6.1. UAE
9.6.2. South Africa
10. Global Skin Lightening Products Market-Competitive Landscape
10.1. Overview
10.2. Market Share of Key Players in the Skin Lightening Products Market
10.2.1. Global Company Market Share
10.2.2. North America Company Market Share
10.2.3. Europe Company Market Share
10.2.4. APAC Company Market Share
10.3. Competitive Situations and Trends
10.3.1. Product Launches and Developments
10.3.2. Partnerships, Collaborations, and Agreements
10.3.3. Mergers & Acquisitions
10.3.4. Expansions
11. Company Profiles
11.1. Avon Products, Inc.
11.1.1. Business Overview
11.1.2. Company Snapshot
11.1.3. Company Market Share Analysis
11.1.4. Company Product Portfolio
11.1.5. Recent Developments
11.1.6. SWOT Analysis
11.2. Beiersdorf AG
11.2.1. Business Overview
11.2.2. Company Snapshot
11.2.3. Company Market Share Analysis
11.2.4. Company Product Portfolio
11.2.5. Recent Developments
11.2.6. SWOT Analysis
11.3. Himalaya Global Holdings Ltd.
11.3.1. Business Overview
11.3.2. Company Snapshot
11.3.3. Company Market Share Analysis
11.3.4. Company Product Portfolio
11.3.5. Recent Developments
11.3.6. SWOT Analysis
11.4. Kao Corporation
11.4.1. Business Overview
11.4.2. Company Snapshot
11.4.3. Company Market Share Analysis
11.4.4. Company Product Portfolio
11.4.5. Recent Developments
11.4.6. SWOT Analysis
11.5. L’Oréal S.A.
11.5.1. Business Overview
11.5.2. Company Snapshot
11.5.3. Company Market Share Analysis
11.5.4. Company Product Portfolio
11.5.5. Recent Developments
11.5.6. SWOT Analysis
11.6. Lotus Herbals Pvt. Ltd.
11.6.1. Business Overview
11.6.2. Company Snapshot
11.6.3. Company Market Share Analysis
11.6.4. Company Product Portfolio
11.6.5. Recent Developments
11.6.6. SWOT Analysis
11.7. Procter & Gamble
11.7.1. Business Overview
11.7.2. Company Snapshot
11.7.3. Company Market Share Analysis
11.7.4. Company Product Portfolio
11.7.5. Recent Developments
11.7.6. SWOT Analysis
11.8. Shiseido Co., Ltd.
11.8.1. Business Overview
11.8.2. Company Snapshot
11.8.3. Company Market Share Analysis
11.8.4. Company Product Portfolio
11.8.5. Recent Developments
11.8.6. SWOT Analysis
11.9. Unilever
11.9.1. Business Overview
11.9.2. Company Snapshot
11.9.3. Company Market Share Analysis
11.9.4. Company Product Portfolio
11.9.5. Recent Developments
11.9.6. SWOT Analysis
11.10. VLCC Health Care Limited
11.10.1. Business Overview
11.10.2. Company Snapshot
11.10.3. Company Market Share Analysis
11.10.4. Company Product Portfolio
11.10.5. Recent Developments
11.10.6. SWOT Analysis
List of Table
1. Global Skin Lightening Products Market, By Product Type, 2020-2033 (USD Billion)
2. Global Creams Skin Lightening Products Market, By Region, 2020-2033 (USD Billion)
3. Global Toners Skin Lightening Products Market, By Region, 2020-2033 (USD Billion)
4. Global Cleansers Skin Lightening Products Market, By Region, 2020-2033 (USD Billion)
5. Global Lotions Skin Lightening Products Market, By Region, 2020-2033 (USD Billion)
6. Global Masks Skin Lightening Products Market, By Region, 2020-2033 (USD Billion)
7. Global Others Skin Lightening Products Market, By Region, 2020-2033 (USD Billion)
8. Global Skin Lightening Products Market, By End User, 2020-2033 (USD Billion)
9. Global Men Skin Lightening Products Market, By Region, 2020-2033 (USD Billion)
10. Global Women Skin Lightening Products Market, By Region, 2020-2033 (USD Billion)
11. Global Skin Lightening Products Market, By Distribution Channel, 2020-2033 (USD Billion)
12. Global Supermarkets/Hypermarkets Skin Lightening Products Market, By Region, 2020-2033 (USD Billion)
13. Global Pharmacies Skin Lightening Products Market, By Region, 2020-2033 (USD Billion)
14. Global Online Skin Lightening Products Market, By Region, 2020-2033 (USD Billion)
15. Global Specialty Stores Skin Lightening Products Market, By Region, 2020-2033 (USD Billion)
16. Global Beauty Stores Skin Lightening Products Market, By Region, 2020-2033 (USD Billion)
17. Global Convenience Stores Skin Lightening Products Market, By Region, 2020-2033 (USD Billion)
18. Global Others Skin Lightening Products Market, By Region, 2020-2033 (USD Billion)
19. Global Skin Lightening Products Market, By Region, 2020-2033 (USD Billion)
20. North America Skin Lightening Products Market, By Product Type, 2020-2033 (USD Billion)
21. North America Skin Lightening Products Market, By End User, 2020-2033 (USD Billion)
22. North America Skin Lightening Products Market, By Distribution Channel, 2020-2033 (USD Billion)
23. U.S. Skin Lightening Products Market, By Product Type, 2020-2033 (USD Billion)
24. U.S. Skin Lightening Products Market, By End User, 2020-2033 (USD Billion)
25. U.S. Skin Lightening Products Market, By Distribution Channel, 2020-2033 (USD Billion)
26. Canada Skin Lightening Products Market, By Product Type, 2020-2033 (USD Billion)
27. Canada Skin Lightening Products Market, By End User, 2020-2033 (USD Billion)
28. Canada Skin Lightening Products Market, By Distribution Channel, 2020-2033 (USD Billion)
29. Mexico Skin Lightening Products Market, By Product Type, 2020-2033 (USD Billion)
30. Mexico Skin Lightening Products Market, By End User, 2020-2033 (USD Billion)
31. Mexico Skin Lightening Products Market, By Distribution Channel, 2020-2033 (USD Billion)
32. Europe Skin Lightening Products Market, By Product Type, 2020-2033 (USD Billion)
33. Europe Skin Lightening Products Market, By End User, 2020-2033 (USD Billion)
34. Europe Skin Lightening Products Market, By Distribution Channel, 2020-2033 (USD Billion)
35. Germany Skin Lightening Products Market, By Product Type, 2020-2033 (USD Billion)
36. Germany Skin Lightening Products Market, By End User, 2020-2033 (USD Billion)
37. Germany Skin Lightening Products Market, By Distribution Channel, 2020-2033 (USD Billion)
38. France Skin Lightening Products Market, By Product Type, 2020-2033 (USD Billion)
39. France Skin Lightening Products Market, By End User, 2020-2033 (USD Billion)
40. France Skin Lightening Products Market, By Distribution Channel, 2020-2033 (USD Billion)
41. U.K. Skin Lightening Products Market, By Product Type, 2020-2033 (USD Billion)
42. U.K. Skin Lightening Products Market, By End User, 2020-2033 (USD Billion)
43. U.K. Skin Lightening Products Market, By Distribution Channel, 2020-2033 (USD Billion)
44. Italy Skin Lightening Products Market, By Product Type, 2020-2033 (USD Billion)
45. Italy Skin Lightening Products Market, By End User, 2020-2033 (USD Billion)
46. Italy Skin Lightening Products Market, By Distribution Channel, 2020-2033 (USD Billion)
47. Spain Skin Lightening Products Market, By Product Type, 2020-2033 (USD Billion)
48. Spain Skin Lightening Products Market, By End User, 2020-2033 (USD Billion)
49. Spain Skin Lightening Products Market, By Distribution Channel, 2020-2033 (USD Billion)
50. Asia Pacific Skin Lightening Products Market, By Product Type, 2020-2033 (USD Billion)
51. Asia Pacific Skin Lightening Products Market, By End User, 2020-2033 (USD Billion)
52. Asia Pacific Skin Lightening Products Market, By Distribution Channel, 2020-2033 (USD Billion)
53. Japan Skin Lightening Products Market, By Product Type, 2020-2033 (USD Billion)
54. Japan Skin Lightening Products Market, By End User, 2020-2033 (USD Billion)
55. Japan Skin Lightening Products Market, By Distribution Channel, 2020-2033 (USD Billion)
56. China Skin Lightening Products Market, By Product Type, 2020-2033 (USD Billion)
57. China Skin Lightening Products Market, By End User, 2020-2033 (USD Billion)
58. China Skin Lightening Products Market, By Distribution Channel, 2020-2033 (USD Billion)
59. India Skin Lightening Products Market, By Product Type, 2020-2033 (USD Billion)
60. India Skin Lightening Products Market, By End User, 2020-2033 (USD Billion)
61. India Skin Lightening Products Market, By Distribution Channel, 2020-2033 (USD Billion)
62. South America Skin Lightening Products Market, By Product Type, 2020-2033 (USD Billion)
63. South America Skin Lightening Products Market, By End User, 2020-2033 (USD Billion)
64. South America Skin Lightening Products Market, By Distribution Channel, 2020-2033 (USD Billion)
65. Brazil Skin Lightening Products Market, By Product Type, 2020-2033 (USD Billion)
66. Brazil Skin Lightening Products Market, By End User, 2020-2033 (USD Billion)
67. Brazil Skin Lightening Products Market, By Distribution Channel, 2020-2033 (USD Billion)
68. Middle East and Africa Skin Lightening Products Market, By Product Type, 2020-2033 (USD Billion)
69. Middle East and Africa Skin Lightening Products Market, By End User, 2020-2033 (USD Billion)
70. Middle East and Africa Skin Lightening Products Market, By Distribution Channel, 2020-2033 (USD Billion)
71. UAE Skin Lightening Products Market, By Product Type, 2020-2033 (USD Billion)
72. UAE Skin Lightening Products Market, By End User, 2020-2033 (USD Billion)
73. UAE Skin Lightening Products Market, By Distribution Channel, 2020-2033 (USD Billion)
74. South Africa Skin Lightening Products Market, By Product Type, 2020-2033 (USD Billion)
75. South Africa Skin Lightening Products Market, By End User, 2020-2033 (USD Billion)
76. South Africa Skin Lightening Products Market, By Distribution Channel, 2020-2033 (USD Billion)
List of Figures
1. Global Skin Lightening Products Market Segmentation
2. Skin Lightening Products Market: Research Methodology
3. Market Size Estimation Methodology: Bottom-Up Approach
4. Market Size Estimation Methodology: Top-Down Approach
5. Data Triangulation
6. Porter’s Five Forces Analysis
7. Value Chain Analysis
8. Global Skin Lightening Products Market Attractiveness Analysis by Product Type
9. Global Skin Lightening Products Market Attractiveness Analysis by End User
10. Global Skin Lightening Products Market Attractiveness Analysis by Distribution Channel
11. Global Skin Lightening Products Market Attractiveness Analysis by Region
12. Global Skin Lightening Products Market: Dynamics
13. Global Skin Lightening Products Market Share by Product Type (2023 & 2033)
14. Global Skin Lightening Products Market Share by End User (2023 & 2033)
15. Global Skin Lightening Products Market Share by Distribution Channel (2023 & 2033)
16. Global Skin Lightening Products Market Share by Regions (2023 & 2033)
17. Global Skin Lightening Products Market Share by Company (2023)
This study forecasts revenue at global, regional, and country levels from 2020 to 2033. The Brainy Insights has segmented the global skin lightening products market based on below mentioned segments:
Global Skin Lightening Products Market by Product Type:
Global Skin Lightening Products Market by End User:
Global Skin Lightening Products Market by Distribution channel:
Global Skin Lightening Products Market by Region:
Research has its special purpose to undertake marketing efficiently. In this competitive scenario, businesses need information across all industry verticals; the information about customer wants, market demand, competition, industry trends, distribution channels etc. This information needs to be updated regularly because businesses operate in a dynamic environment. Our organization, The Brainy Insights incorporates scientific and systematic research procedures in order to get proper market insights and industry analysis for overall business success. The analysis consists of studying the market from a miniscule level wherein we implement statistical tools which helps us in examining the data with accuracy and precision.
Our research reports feature both; quantitative and qualitative aspects for any market. Qualitative information for any market research process are fundamental because they reveal the customer needs and wants, usage and consumption for any product/service related to a specific industry. This in turn aids the marketers/investors in knowing certain perceptions of the customers. Qualitative research can enlighten about the different product concepts and designs along with unique service offering that in turn, helps define marketing problems and generate opportunities. On the other hand, quantitative research engages with the data collection process through interviews, e-mail interactions, surveys and pilot studies. Quantitative aspects for the market research are useful to validate the hypotheses generated during qualitative research method, explore empirical patterns in the data with the help of statistical tools, and finally make the market estimations.
The Brainy Insights offers comprehensive research and analysis, based on a wide assortment of factual insights gained through interviews with CXOs and global experts and secondary data from reliable sources. Our analysts and industry specialist assume vital roles in building up statistical tools and analysis models, which are used to analyse the data and arrive at accurate insights with exceedingly informative research discoveries. The data provided by our organization have proven precious to a diverse range of companies, facilitating them to address issues such as determining which products/services are the most appealing, whether or not customers use the product in the manner anticipated, the purchasing intentions of the market and many others.
Our research methodology encompasses an idyllic combination of primary and secondary initiatives. Key phases involved in this process are listed below:

The phase involves the gathering and collecting of market data and its related information with the help of different sources & research procedures.

The data procurement stage involves in data gathering and collecting through various data sources.
This stage involves in extensive research. These data sources includes:
Purchased Database: Purchased databases play a crucial role in estimating the market sizes irrespective of the domain. Our purchased database includes:
Primary Research: The Brainy Insights interacts with leading companies and experts of the concerned domain to develop the analyst team’s market understanding and expertise. It improves and substantiates every single data presented in the market reports. Primary research mainly involves in telephonic interviews, E-mail interactions and face-to-face interviews with the raw material providers, manufacturers/producers, distributors, & independent consultants. The interviews that we conduct provides valuable data on market size and industry growth trends prevailing in the market. Our organization also conducts surveys with the various industry experts in order to gain overall insights of the industry/market. For instance, in healthcare industry we conduct surveys with the pharmacists, doctors, surgeons and nurses in order to gain insights and key information of a medical product/device/equipment which the customers are going to usage. Surveys are conducted in the form of questionnaire designed by our own analyst team. Surveys plays an important role in primary research because surveys helps us to identify the key target audiences of the market. Additionally, surveys helps to identify the key target audience engaged with the market. Our survey team conducts the survey by targeting the key audience, thus gaining insights from them. Based on the perspectives of the customers, this information is utilized to formulate market strategies. Moreover, market surveys helps us to understand the current competitive situation of the industry. To be precise, our survey process typically involve with the 360 analysis of the market. This analytical process begins by identifying the prospective customers for a product or service related to the market/industry to obtain data on how a product/service could fit into customers’ lives.

Secondary Research: The secondary data sources includes information published by the on-profit organizations such as World bank, WHO, company fillings, investor presentations, annual reports, national government documents, statistical databases, blogs, articles, white papers and others. From the annual report, we analyse a company’s revenue to understand the key segment and market share of that organization in a particular region. We analyse the company websites and adopt the product mapping technique which is important for deriving the segment revenue. In the product mapping method, we select and categorize the products offered by the companies catering to domain specific market, deduce the product revenue for each of the companies so as to get overall estimation of the market size. We also source data and analyses trends based on information received from supply side and demand side intermediaries in the value chain. The supply side denotes the data gathered from supplier, distributor, wholesaler and the demand side illustrates the data gathered from the end customers for respective market domain.

The supply side for a domain specific market is analysed by:
The demand side for the market is estimated through:
In-house Library: Apart from these third-party sources, we have our in-house library of qualitative and quantitative information. Our in-house database includes market data for various industry and domains. These data are updated on regular basis as per the changing market scenario. Our library includes, historic databases, internal audit reports and archives.
Sometimes there are instances where there is no metadata or raw data available for any domain specific market. For those cases, we use our expertise to forecast and estimate the market size in order to generate comprehensive data sets. Our analyst team adopt a robust research technique in order to produce the estimates:
Data Synthesis: This stage involves the analysis & mapping of all the information obtained from the previous step. It also involves in scrutinizing the data for any discrepancy observed while data gathering related to the market. The data is collected with consideration to the heterogeneity of sources. Robust scientific techniques are in place for synthesizing disparate data sets and provide the essential contextual information that can orient market strategies. The Brainy Insights has extensive experience in data synthesis where the data passes through various stages:


Market Deduction & Formulation: The final stage comprises of assigning data points at appropriate market spaces so as to deduce feasible conclusions. Analyst perspective & subject matter expert based holistic form of market sizing coupled with industry analysis also plays a crucial role in this stage.
This stage involves in finalization of the market size and numbers that we have collected from data integration step. With data interpolation, it is made sure that there is no gap in the market data. Successful trend analysis is done by our analysts using extrapolation techniques, which provide the best possible forecasts for the market.
Data Validation & Market Feedback: Validation is the most important step in the process. Validation & re-validation via an intricately designed process helps us finalize data-points to be used for final calculations.

The Brainy Insights interacts with leading companies and experts of the concerned domain to develop the analyst team’s market understanding and expertise. It improves and substantiates every single data presented in the market reports. The data validation interview and discussion panels are typically composed of the most experienced industry members. The participants include, however, are not limited to:
Moreover, we always validate our data and findings through primary respondents from all the major regions we are working on.


Free Customization
Fortune 500 Clients
Free Yearly Update On Purchase Of Multi/Corporate License
Companies Served Till Date