- +1-315-215-1633
- sales@thebrainyinsights.com

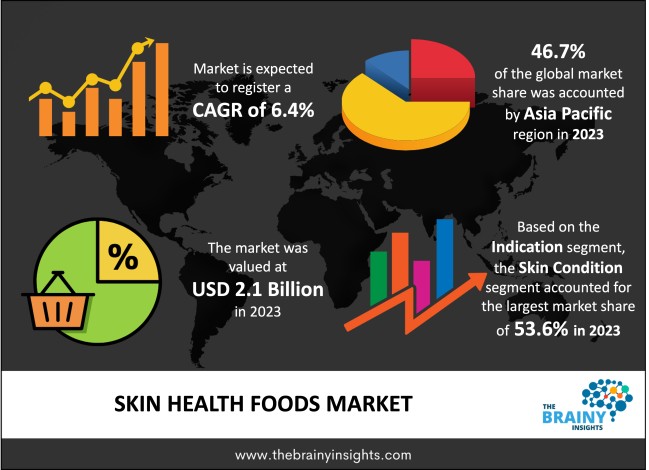
The Skin Health Foods Market was valued at USD 2.1 billion in 2023 and grew at a CAGR of 6.4% from 2024 to 2033. Skin Health Foods are nutrient-rich edibles that support and enhance skin health. Packed with vitamins, minerals, antioxidants, and essential fatty acids, these foods include fruits like berries and citrus, leafy greens, fatty fish, flaxseeds, chia seeds, nuts, and seeds. Vitamin C and antioxidants combat free radicals and promote collagen production, while omega-3 fatty acids reduce inflammation and boost skin hydration. Vitamin E aids in skin repair and UV protection. Integrating these foods into a balanced diet promotes a radiant complexion and overall skin health.
A fast expanding subset of the larger health and wellness sector is the market for skin health foods. Customers are looking for dietary solutions that can improve skin health as they become more conscious of how important it is to keep good skin. This market focuses on goods that address problems including aging, dehydration, acne, and general skin vitality by nourishing and supporting the skin from the inside out.
Get an overview of this study by requesting a free sample
Customers are now more equipped to educate themselves about the relationship between nutrition and skin health because to the increased availability of information on the internet and social media platforms. One of the main drivers is also the growing awareness of general wellness and the importance of diet in preserving healthy skin. Proactively, consumers are looking for goods that improve their general well-being. Additionally, as the world's population ages, there is a growing need for solutions that deal with skin problems associated with aging. The aging population is drawn to diets high in antioxidants and collagen, which are components of skin health.
Strict adherence to rules and requirements for health claims might be difficult. Market participants face a challenge in ensuring that products meet regulatory criteria while making verifiable and accurate claims. Adding some healthy elements to food goods without sacrificing flavor and palatability can sometimes be difficult. If skin health foods don't appeal to consumers, they can be reluctant to try them.
There are chances for businesses to help customers understand how important nutrition is for healthy skin. Businesses might develop educational programs to draw attention to and emphasize the advantages of particular meals for healthy skin. The move toward personalized nutrition makes it possible to create foods for skin health that are specifically suited to each person's needs, taking into consideration variables like age, skin type, and lifestyle. Customer happiness and product efficacy can both be improved with customized solutions.
Asia Pacific led the market in 2023 with the largest market share of 46.7%. Young, clear skin is highly valued in many Asian cultures. The importance of having healthy skin in culture drives the demand for skincare items, including foods that are good for the skin. Additionally, the popularity of Japanese (J-Beauty) and Korean (K-Beauty) beauty trends has had a big impact on product preferences and skincare regimens. Asia-Pacific consumers are more likely to include foods that are good for their skin in their beauty routine.
Asia Pacific Region Skin Health Foods Market Share in 2023 - 46.7%
www.thebrainyinsights.com
Check the geographical analysis of this market by requesting a free sample
The Skin condition segment dominated the global market in 2023 with a market share of 53.6%. One major factor driving the demand for anti-aging skin health foods is the aging population worldwide. Products like collagen, antioxidants, and vitamins gain popularity as customers look for ways to reduce fine lines and wrinkles. Additionally, consumers with delicate skin look for skin-healthy meals that contain antioxidants, aloe vera, and chamomile, among other mild and calming elements. Items having anti-inflammatory qualities are especially desirable.
The fatty fish segment dominated the global market in 2023 with a market share of 33.8%. Rich in fatty fish, omega-3 fatty acids contain anti-inflammatory qualities that can help control inflammation brought on by skin disorders like eczema, psoriasis, and acne. Furthermore, eating fatty fish may be beneficial for people who have surgical scars or skin injuries due to the anti-inflammatory qualities of omega-3 fatty acids, which may promote wound healing and minimize the production of scars.
The offline segment dominated the global market in 2023 with a market share of 63.7%. One benefit of physical establishments is that their staff members are knowledgeable and can assist you in person. This individual touch can improve the whole shopping experience, particularly for customers looking for nutrition and skincare guidance. Instant product access is offered by offline retailers, enabling customers to buy and use skin-healthy items right away. This sudden satisfaction may be alluring, particularly to people who are searching for speedy fixes for their skincare issues.
| Attribute | Description |
|---|---|
| Market Size | Revenue (USD Billion) |
| Market size value in 2023 | USD 2.1 Billion |
| Market size value in 2033 | USD 3.6 Billion |
| CAGR (2024 to 2033) | 6.4% |
| Historical data | 2020-2022 |
| Base Year | 2023 |
| Forecast | 2024-2033 |
| Region | The regions analyzed for the market are Asia Pacific, Europe, South America, North America, and Middle East & Africa. Furthermore, the regions are further analyzed at the country level. |
| Segments | Indication, Source, Distribution Channel |
As per The Brainy Insights, the size of the skin health foods market was valued at USD 2.1 billion in 2023 to USD 3.6 billion by 2033.
The global skin health foods market is growing at a CAGR of 6.4% during the forecast period 2024-2033.
The Asia Pacific region emerged as the largest market for the skin health foods.
The growing consumer awareness will influence the market's growth.
1. Introduction
1.1. Objectives of the Study
1.2. Market Definition
1.3. Research Scope
1.4. Currency
1.5. Key Target Audience
2. Research Methodology and Assumptions
3. Executive Summary
4. Premium Insights
4.1. Porter’s Five Forces Analysis
4.2. Value Chain Analysis
4.3. Top Investment Pockets
4.3.1. Market Attractiveness Analysis by Indication
4.3.2. Market Attractiveness Analysis by Source
4.3.3. Market Attractiveness Analysis by Distribution Channel
4.3.4. Market Attractiveness Analysis by Region
4.4. Industry Trends
5. Market Dynamics
5.1. Market Evaluation
5.2. Drivers
5.2.1. Growing Consumer Awareness
5.2.2. Aging Population
5.3. Restraints
5.3.1. Stringent regulations
5.4. Opportunities
5.4.1. Personalization and Customization
5.5. Challenges
5.5.1. Taste and Texture Considerations
6. Global Skin Health Foods Market Analysis and Forecast, By Indication
6.1. Segment Overview
6.2. Skin Conditions
6.3. Anti-aging
6.4. Anti-allergy
7. Global Skin Health Foods Market Analysis and Forecast, By Source
7.1. Segment Overview
7.2. Fatty Fish
7.3. Avocados
7.4. Walnuts
7.5. Sunflower Seeds
7.6. Sweet Potatoes
7.7. Red or Yellow Bell Peppers
7.8. Broccoli
7.9. Others
8. Global Skin Health Foods Market Analysis and Forecast, By Distribution Channel
8.1. Segment Overview
8.2. Online
8.3. Offline
9. Global Skin Health Foods Market Analysis and Forecast, By Regional Analysis
9.1. Segment Overview
9.2. North America
9.2.1. U.S.
9.2.2. Canada
9.2.3. Mexico
9.3. Europe
9.3.1. Germany
9.3.2. France
9.3.3. U.K.
9.3.4. Italy
9.3.5. Spain
9.4. Asia-Pacific
9.4.1. Japan
9.4.2. China
9.4.3. India
9.5. South America
9.5.1. Brazil
9.6. Middle East and Africa
9.6.1. UAE
9.6.2. South Africa
10. Global Skin Health Foods Market-Competitive Landscape
10.1. Overview
10.2. Market Share of Key Players in the Skin Health Foods Market
10.2.1. Global Company Market Share
10.2.2. North America Company Market Share
10.2.3. Europe Company Market Share
10.2.4. APAC Company Market Share
10.3. Competitive Situations and Trends
10.3.1. Product Launches and Developments
10.3.2. Partnerships, Collaborations, and Agreements
10.3.3. Mergers & Acquisitions
10.3.4. Expansions
11. Company Profiles
11.1. BASF SE
11.1.1. Business Overview
11.1.2. Company Snapshot
11.1.3. Company Market Share Analysis
11.1.4. Company Product Portfolio
11.1.5. Recent Developments
11.1.6. SWOT Analysis
11.2. ADM
11.2.1. Business Overview
11.2.2. Company Snapshot
11.2.3. Company Market Share Analysis
11.2.4. Company Product Portfolio
11.2.5. Recent Developments
11.2.6. SWOT Analysis
11.3. DuPont
11.3.1. Business Overview
11.3.2. Company Snapshot
11.3.3. Company Market Share Analysis
11.3.4. Company Product Portfolio
11.3.5. Recent Developments
11.3.6. SWOT Analysis
11.4. Cargill, Incorporated
11.4.1. Business Overview
11.4.2. Company Snapshot
11.4.3. Company Market Share Analysis
11.4.4. Company Product Portfolio
11.4.5. Recent Developments
11.4.6. SWOT Analysis
11.5. Arla Foods Amba
11.5.1. Business Overview
11.5.2. Company Snapshot
11.5.3. Company Market Share Analysis
11.5.4. Company Product Portfolio
11.5.5. Recent Developments
11.5.6. SWOT Analysis
11.6. Nestlé
11.6.1. Business Overview
11.6.2. Company Snapshot
11.6.3. Company Market Share Analysis
11.6.4. Company Product Portfolio
11.6.5. Recent Developments
11.6.6. SWOT Analysis
11.7. DSM
11.7.1. Business Overview
11.7.2. Company Snapshot
11.7.3. Company Market Share Analysis
11.7.4. Company Product Portfolio
11.7.5. Recent Developments
11.7.6. SWOT Analysis
11.8. Glanbia PLC
11.8.1. Business Overview
11.8.2. Company Snapshot
11.8.3. Company Market Share Analysis
11.8.4. Company Product Portfolio
11.8.5. Recent Developments
11.8.6. SWOT Analysis
11.9. Herbalife International of America, Inc.
11.9.1. Business Overview
11.9.2. Company Snapshot
11.9.3. Company Market Share Analysis
11.9.4. Company Product Portfolio
11.9.5. Recent Developments
11.9.6. SWOT Analysis
11.10. Amway Corp.
11.10.1. Business Overview
11.10.2. Company Snapshot
11.10.3. Company Market Share Analysis
11.10.4. Company Product Portfolio
11.10.5. Recent Developments
11.10.6. SWOT Analysis
List of Table
1. Global Skin Health Foods Market, By Indication, 2020-2033 (USD Billion)
2. Global Skin Conditions Skin Health Foods Market, By Region, 2020-2033 (USD Billion)
3. Global Anti-Aging Skin Health Foods Market, By Region, 2020-2033 (USD Billion)
4. Global Anti-Allergy Skin Health Foods Market, By Region, 2020-2033 (USD Billion)
5. Global Skin Health Foods Market, By Source, 2020-2033 (USD Billion)
6. Global Fatty Fish Skin Health Foods Market, By Region, 2020-2033 (USD Billion)
7. Global Avocados Skin Health Foods Market, By Region, 2020-2033 (USD Billion)
8. Global Walnuts Skin Health Foods Market, By Region, 2020-2033 (USD Billion)
9. Global Sunflower Seeds Skin Health Foods Market, By Region, 2020-2033 (USD Billion)
10. Global Sweet Potatoes Skin Health Foods Market, By Region, 2020-2033 (USD Billion)
11. Global Red or Yellow Bell Peppers Skin Health Foods Market, By Region, 2020-2033 (USD Billion)
12. Global Broccoli Skin Health Foods Market, By Region, 2020-2033 (USD Billion)
13. Global Others Skin Health Foods Market, By Region, 2020-2033 (USD Billion)
14. Global Skin Health Foods Market, By Distribution Channel, 2020-2033 (USD Billion)
15. Global Online Skin Health Foods Market, By Region, 2020-2033 (USD Billion)
16. Global Offline Skin Health Foods Market, By Region, 2020-2033 (USD Billion)
17. Global Skin Health Foods Market, By Region, 2020-2033 (USD Billion)
18. North America Skin Health Foods Market, By Indication, 2020-2033 (USD Billion)
19. North America Skin Health Foods Market, By Source, 2020-2033 (USD Billion)
20. North America Skin Health Foods Market, By Distribution Channel, 2020-2033 (USD Billion)
21. U.S. Skin Health Foods Market, By Indication, 2020-2033 (USD Billion)
22. U.S. Skin Health Foods Market, By Source, 2020-2033 (USD Billion)
23. U.S. Skin Health Foods Market, By Distribution Channel, 2020-2033 (USD Billion)
24. Canada Skin Health Foods Market, By Indication, 2020-2033 (USD Billion)
25. Canada Skin Health Foods Market, By Source, 2020-2033 (USD Billion)
26. Canada Skin Health Foods Market, By Distribution Channel, 2020-2033 (USD Billion)
27. Mexico Skin Health Foods Market, By Indication, 2020-2033 (USD Billion)
28. Mexico Skin Health Foods Market, By Source, 2020-2033 (USD Billion)
29. Mexico Skin Health Foods Market, By Distribution Channel, 2020-2033 (USD Billion)
30. Europe Skin Health Foods Market, By Indication, 2020-2033 (USD Billion)
31. Europe Skin Health Foods Market, By Source, 2020-2033 (USD Billion)
32. Europe Skin Health Foods Market, By Distribution Channel, 2020-2033 (USD Billion)
33. Germany Skin Health Foods Market, By Indication, 2020-2033 (USD Billion)
34. Germany Skin Health Foods Market, By Source, 2020-2033 (USD Billion)
35. Germany Skin Health Foods Market, By Distribution Channel, 2020-2033 (USD Billion)
36. France Skin Health Foods Market, By Indication, 2020-2033 (USD Billion)
37. France Skin Health Foods Market, By Source, 2020-2033 (USD Billion)
38. France Skin Health Foods Market, By Distribution Channel, 2020-2033 (USD Billion)
39. U.K. Skin Health Foods Market, By Indication, 2020-2033 (USD Billion)
40. U.K. Skin Health Foods Market, By Source, 2020-2033 (USD Billion)
41. U.K. Skin Health Foods Market, By Distribution Channel, 2020-2033 (USD Billion)
42. Italy Skin Health Foods Market, By Indication, 2020-2033 (USD Billion)
43. Italy Skin Health Foods Market, By Source, 2020-2033 (USD Billion)
44. Italy Skin Health Foods Market, By Distribution Channel, 2020-2033 (USD Billion)
45. Spain Skin Health Foods Market, By Indication, 2020-2033 (USD Billion)
46. Spain Skin Health Foods Market, By Source, 2020-2033 (USD Billion)
47. Spain Skin Health Foods Market, By Distribution Channel, 2020-2033 (USD Billion)
48. Asia Pacific Skin Health Foods Market, By Indication, 2020-2033 (USD Billion)
49. Asia Pacific Skin Health Foods Market, By Source, 2020-2033 (USD Billion)
50. Asia Pacific Skin Health Foods Market, By Distribution Channel, 2020-2033 (USD Billion)
51. Japan Skin Health Foods Market, By Indication, 2020-2033 (USD Billion)
52. Japan Skin Health Foods Market, By Source, 2020-2033 (USD Billion)
53. Japan Skin Health Foods Market, By Distribution Channel, 2020-2033 (USD Billion)
54. China Skin Health Foods Market, By Indication, 2020-2033 (USD Billion)
55. China Skin Health Foods Market, By Source, 2020-2033 (USD Billion)
56. China Skin Health Foods Market, By Distribution Channel, 2020-2033 (USD Billion)
57. India Skin Health Foods Market, By Indication, 2020-2033 (USD Billion)
58. India Skin Health Foods Market, By Source, 2020-2033 (USD Billion)
59. India Skin Health Foods Market, By Distribution Channel, 2020-2033 (USD Billion)
60. South America Skin Health Foods Market, By Indication, 2020-2033 (USD Billion)
61. South America Skin Health Foods Market, By Source, 2020-2033 (USD Billion)
62. South America Skin Health Foods Market, By Distribution Channel, 2020-2033 (USD Billion)
63. Brazil Skin Health Foods Market, By Indication, 2020-2033 (USD Billion)
64. Brazil Skin Health Foods Market, By Source, 2020-2033 (USD Billion)
65. Brazil Skin Health Foods Market, By Distribution Channel, 2020-2033 (USD Billion)
66. Middle East and Africa Skin Health Foods Market, By Indication, 2020-2033 (USD Billion)
67. Middle East and Africa Skin Health Foods Market, By Source, 2020-2033 (USD Billion)
68. Middle East and Africa Skin Health Foods Market, By Distribution Channel, 2020-2033 (USD Billion)
69. UAE Skin Health Foods Market, By Indication, 2020-2033 (USD Billion)
70. UAE Skin Health Foods Market, By Source, 2020-2033 (USD Billion)
71. UAE Skin Health Foods Market, By Distribution Channel, 2020-2033 (USD Billion)
72. South Africa Skin Health Foods Market, By Indication, 2020-2033 (USD Billion)
73. South Africa Skin Health Foods Market, By Source, 2020-2033 (USD Billion)
74. South Africa Skin Health Foods Market, By Distribution Channel, 2020-2033 (USD Billion)
List of Figures
1. Global Skin Health Foods Market Segmentation
2. Skin Health Foods Market: Research Methodology
3. Market Size Estimation Methodology: Bottom-Up Approach
4. Market Size Estimation Methodology: Top-Down Approach
5. Data Triangulation
6. Porter’s Five Forces Analysis
7. Value Chain Analysis
8. Global Skin Health Foods Market Attractiveness Analysis by Indication
9. Global Skin Health Foods Market Attractiveness Analysis by Source
10. Global Skin Health Foods Market Attractiveness Analysis by Distribution Channel
11. Global Skin Health Foods Market Attractiveness Analysis by Region
12. Global Skin Health Foods Market: Dynamics
13. Global Skin Health Foods Market Share by Indication (2023 & 2033)
14. Global Skin Health Foods Market Share by Source (2023 & 2033)
15. Global Skin Health Foods Market Share by Distribution Channel (2023 & 2033)
16. Global Skin Health Foods Market Share by Regions (2023 & 2033)
17. Global Skin Health Foods Market Share by Company (2023)
This study forecasts revenue at global, regional, and country levels from 2020 to 2033. The Brainy Insights has segmented the global skin health foods market based on below-mentioned segments:
Global Skin Health Foods Market by Indication:
Global Skin Health Foods Market by Source:
Global Skin Health Foods Market by Distribution Channel:
Global Skin Health Foods Market by Region:
Research has its special purpose to undertake marketing efficiently. In this competitive scenario, businesses need information across all industry verticals; the information about customer wants, market demand, competition, industry trends, distribution channels etc. This information needs to be updated regularly because businesses operate in a dynamic environment. Our organization, The Brainy Insights incorporates scientific and systematic research procedures in order to get proper market insights and industry analysis for overall business success. The analysis consists of studying the market from a miniscule level wherein we implement statistical tools which helps us in examining the data with accuracy and precision.
Our research reports feature both; quantitative and qualitative aspects for any market. Qualitative information for any market research process are fundamental because they reveal the customer needs and wants, usage and consumption for any product/service related to a specific industry. This in turn aids the marketers/investors in knowing certain perceptions of the customers. Qualitative research can enlighten about the different product concepts and designs along with unique service offering that in turn, helps define marketing problems and generate opportunities. On the other hand, quantitative research engages with the data collection process through interviews, e-mail interactions, surveys and pilot studies. Quantitative aspects for the market research are useful to validate the hypotheses generated during qualitative research method, explore empirical patterns in the data with the help of statistical tools, and finally make the market estimations.
The Brainy Insights offers comprehensive research and analysis, based on a wide assortment of factual insights gained through interviews with CXOs and global experts and secondary data from reliable sources. Our analysts and industry specialist assume vital roles in building up statistical tools and analysis models, which are used to analyse the data and arrive at accurate insights with exceedingly informative research discoveries. The data provided by our organization have proven precious to a diverse range of companies, facilitating them to address issues such as determining which products/services are the most appealing, whether or not customers use the product in the manner anticipated, the purchasing intentions of the market and many others.
Our research methodology encompasses an idyllic combination of primary and secondary initiatives. Key phases involved in this process are listed below:

The phase involves the gathering and collecting of market data and its related information with the help of different sources & research procedures.

The data procurement stage involves in data gathering and collecting through various data sources.
This stage involves in extensive research. These data sources includes:
Purchased Database: Purchased databases play a crucial role in estimating the market sizes irrespective of the domain. Our purchased database includes:
Primary Research: The Brainy Insights interacts with leading companies and experts of the concerned domain to develop the analyst team’s market understanding and expertise. It improves and substantiates every single data presented in the market reports. Primary research mainly involves in telephonic interviews, E-mail interactions and face-to-face interviews with the raw material providers, manufacturers/producers, distributors, & independent consultants. The interviews that we conduct provides valuable data on market size and industry growth trends prevailing in the market. Our organization also conducts surveys with the various industry experts in order to gain overall insights of the industry/market. For instance, in healthcare industry we conduct surveys with the pharmacists, doctors, surgeons and nurses in order to gain insights and key information of a medical product/device/equipment which the customers are going to usage. Surveys are conducted in the form of questionnaire designed by our own analyst team. Surveys plays an important role in primary research because surveys helps us to identify the key target audiences of the market. Additionally, surveys helps to identify the key target audience engaged with the market. Our survey team conducts the survey by targeting the key audience, thus gaining insights from them. Based on the perspectives of the customers, this information is utilized to formulate market strategies. Moreover, market surveys helps us to understand the current competitive situation of the industry. To be precise, our survey process typically involve with the 360 analysis of the market. This analytical process begins by identifying the prospective customers for a product or service related to the market/industry to obtain data on how a product/service could fit into customers’ lives.

Secondary Research: The secondary data sources includes information published by the on-profit organizations such as World bank, WHO, company fillings, investor presentations, annual reports, national government documents, statistical databases, blogs, articles, white papers and others. From the annual report, we analyse a company’s revenue to understand the key segment and market share of that organization in a particular region. We analyse the company websites and adopt the product mapping technique which is important for deriving the segment revenue. In the product mapping method, we select and categorize the products offered by the companies catering to domain specific market, deduce the product revenue for each of the companies so as to get overall estimation of the market size. We also source data and analyses trends based on information received from supply side and demand side intermediaries in the value chain. The supply side denotes the data gathered from supplier, distributor, wholesaler and the demand side illustrates the data gathered from the end customers for respective market domain.

The supply side for a domain specific market is analysed by:
The demand side for the market is estimated through:
In-house Library: Apart from these third-party sources, we have our in-house library of qualitative and quantitative information. Our in-house database includes market data for various industry and domains. These data are updated on regular basis as per the changing market scenario. Our library includes, historic databases, internal audit reports and archives.
Sometimes there are instances where there is no metadata or raw data available for any domain specific market. For those cases, we use our expertise to forecast and estimate the market size in order to generate comprehensive data sets. Our analyst team adopt a robust research technique in order to produce the estimates:
Data Synthesis: This stage involves the analysis & mapping of all the information obtained from the previous step. It also involves in scrutinizing the data for any discrepancy observed while data gathering related to the market. The data is collected with consideration to the heterogeneity of sources. Robust scientific techniques are in place for synthesizing disparate data sets and provide the essential contextual information that can orient market strategies. The Brainy Insights has extensive experience in data synthesis where the data passes through various stages:


Market Deduction & Formulation: The final stage comprises of assigning data points at appropriate market spaces so as to deduce feasible conclusions. Analyst perspective & subject matter expert based holistic form of market sizing coupled with industry analysis also plays a crucial role in this stage.
This stage involves in finalization of the market size and numbers that we have collected from data integration step. With data interpolation, it is made sure that there is no gap in the market data. Successful trend analysis is done by our analysts using extrapolation techniques, which provide the best possible forecasts for the market.
Data Validation & Market Feedback: Validation is the most important step in the process. Validation & re-validation via an intricately designed process helps us finalize data-points to be used for final calculations.

The Brainy Insights interacts with leading companies and experts of the concerned domain to develop the analyst team’s market understanding and expertise. It improves and substantiates every single data presented in the market reports. The data validation interview and discussion panels are typically composed of the most experienced industry members. The participants include, however, are not limited to:
Moreover, we always validate our data and findings through primary respondents from all the major regions we are working on.


Free Customization
Fortune 500 Clients
Free Yearly Update On Purchase Of Multi/Corporate License
Companies Served Till Date