- +1-315-215-1633
- sales@thebrainyinsights.com

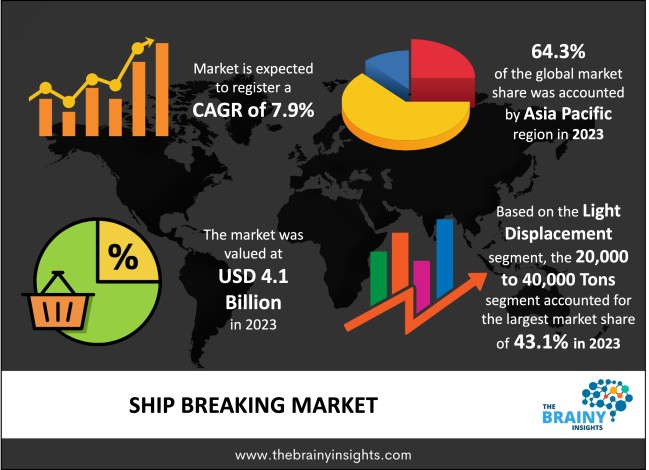
The Ship Breaking Market was valued at USD 4.1 billion in 2023 and grew at a CAGR of 7.9% from 2024 to 2033. Shipbreaking is the business of breaking up old ships to recover some materials: steel, aluminum, and other metals in order to make use of recycled steel. South Asia is the most essential region in shipbreaking, especially in Bangladesh, India, and Pakistan, where labor cost is lower. Major companies in the industry are GMS, Aliaga Ship Recycling, and Best Oasis. Still, the industry has "economic benefits" but also the hassle of "environmental impact and worker safety.". These issues require regulations such as the Hong Kong International Convention. Sustainable building practices shall allow for future growth to be focused on green dismantling techniques.
Shipbreaking breaks up retired ships in order to harvest valuable metals for recycling and manufacturing in low labor-cost regions that support large-scale ship-breaking and where an infrastructure-friendly site facilitates local economy and supply in the world for reclaimed steel. Some key players here include GMS and Best Oasis. Still, some concerns include environmental and workforce safety, and more responsibility and safety measures from organizations such as the Hong Kong International Convention are enforced over ship recycling. Responsible dismantling process makes the industry green as innovations push it towards eliminating or minimizing risks of ecological and health damage in shipbreaking.
Get an overview of this study by requesting a free sample
Several factors drive shipbreaking: an aging global fleet results in more ships retiring at the end of the cycle. Stricter environments such as the IMO 2020 force older vessels with greater pollution potential away from operational use and lead to higher demand for vessel scrapping. The rising economic demands of recyclable elements like steel also contribute to requirements for scrapping. Economic profitability also drives the ship demolition industry. Scrap metal selling prices make up a fundamental portion of the business activity. Technological advancement in the dismantling techniques has improved the efficiency and safety with better environmental compliance, hence supporting growth in the market.
Environmental factors-affecting issues include hazard waste disposal and pollution-call for expensive compliance. Such a market is further affected by safety risks in workplaces with hazardous conditions. Insufficient adequate infrastructure in some areas deters carrying out dismantling operations economically. Political instability in one of the shipbreaking countries contributes to uncertainty and interference with shipments. Fluctuation of scrap metal prices, also affecting markets, affects profitability. The global shift toward greener shipping alternatives might reduce demand for traditional shipbreaking activities.
Since the demand of recycled commodities, steel and copper is highly increasing which is demanded for new innovative industries this provides a possibility of breaking the ships. A scope in demolition with technological improvements will surface when it renders efficiency, safety, and environmental soundness. Lastly, the tradition and legislation regarding green practice will enable concerned parties with an environmentally benign shipbreaking process. With aging fleets and a world-wide push towards cleaner shipping, demand for ship disposal is up. Growth opportunities also lie in emerging markets, as increasing ship breaking operations tap into new supply chains and demand.
Asia Pacific led the market in 2023 with the largest market share of 64.3%. Bourbon's unique flavor profile, cultural significance, and heritage have contributed to its broad popularity among consumers in North America. The market for premium bourbon products has been further spurred by the increased interest in craft spirits and premiumization. Additionally, a wide variety of goods are available in the North American bourbon industry to accommodate a range of consumer tastes and preferences. This covers classic bourbon varieties, releases from artisan distilleries, limited editions, single-barrel selections, and flavored bourbons. Ship breaking is the world leader of Asia Pacific. India, Bangladesh, China, and Pakistan are the leaders of this market. India's Alang and Bangladesh's Chittagong are key focus points for dismantling centers based on low labor cost and high demand for recyclable materials such as steel. The market is augmented by the aging global fleets and the need for disposal. However, the region faces environmental problems, safety hazards to its employees, and stricter regulatory compliance. And with this, there lies an opportunity in embracing the green ship recycling practice and further increasing the activities to absorb the international market for eco-friendly dismantling and recycling services.
Asia Pacific Region Ship Breaking Market Share in 2023 - 64.3%
www.thebrainyinsights.com
Check the geographical analysis of this market by requesting a free sample
The 20,000 to 40,000 Tons segment dominated the global market in 2023 with a market share of 43.1%. The mid-size vessels include bulk carriers, container ships, general cargo ships, and those amounting to 20,000 to 40,000 tons. The reasons behind this retirement include the vessels' old age, expensive maintenance, or pressures from regulation. The high demand materials in this sector are mostly steel and copper. India and Bangladesh are the leading countries which dismantle these ships. Aged fleet, increasing demand for scrap material, and industrial pressure to make the recycling of ships more environmentally friendly are some of the reasons for the growth of the market.
The Alongside segment dominated the global market in 2023 with a market share of 45.3%. The "alongside" method in shipbreaking refers to a technique where ships are dismantled while docked at the shore or a pier, rather than being beached. This method is typically used for medium-sized vessels in the 20,000 to 40,000-ton segment. The ship is brought alongside a dock or quay, and dismantling begins with sections of the vessel being cut and removed. This method offers improved safety and environmental controls, as the ship remains afloat, reducing risks associated with pollution and worker injuries. It's increasingly favored due to its cleaner, more controlled environment compared to traditional beaching practices.
| Attribute | Description |
|---|---|
| Market Size | Revenue (USD Billion) |
| Market size value in 2023 | USD 4.1 Billion |
| Market size value in 2033 | USD 8.7 Billion |
| CAGR (2024 to 2033) | 7.9% |
| Historical data | 2020-2022 |
| Base Year | 2023 |
| Forecast | 2024-2033 |
| Region | The regions analyzed for the market are Asia Pacific, Europe, South America, North America, and Middle East & Africa. Furthermore, the regions are further analyzed at the country level. |
| Segments | Light Displacement Tonnage, Method |
As per The Brainy Insights, the size of the ship breaking market was valued at USD 4.1 billion in 2023 to USD 8.7 billion by 2033.
The global ship breaking market is growing at a CAGR of 7.9% during the forecast period 2024-2033.
The Asia Pacific region emerged as the largest market for the ship breaking market.
Increasing decommissioning of aging ships will influence the market's growth.
1. Introduction
1.1. Objectives of the Study
1.2. Market Definition
1.3. Research Scope
1.4. Currency
1.5. Key Target Audience
2. Research Methodology and Assumptions
3. Executive Summary
4. Premium Insights
4.1. Porter’s Five Forces Analysis
4.2. Value Chain Analysis
4.3. Top Investment Pockets
4.3.1. Market Attractiveness Analysis by Light Displacement Tonnage
4.3.2. Market Attractiveness Analysis by Method
4.3.3. Market Attractiveness Analysis by Region
4.4. Industry Trends
5. Market Dynamics
5.1. Market Evaluation
5.2. Drivers
5.2.1. Increasing Decommissioning of Aging Ships
5.2.2. Growing Need for Steel Recycling
5.3. Restraints
5.3.1. Environmental and Health Concerns
5.4. Opportunities
5.4.1. Shift Towards Eco-Friendly Practices
5.5. Challenges
5.5.1. Economic Uncertainty
6. Global Ship Breaking Market Analysis and Forecast, By Light Displacement Tonnage
6.1. Segment Overview
6.2. Below 20,000 Tons
6.3. 20,000 to 40,000 Tons
6.4. Above 40,000 Tons
7. Global Ship Breaking Market Analysis and Forecast, By Method
7.1. Segment Overview
7.2. Alongside
7.3. Beaching
7.4. Dry Dock
7.5. Other
8. Global Ship Breaking Market Analysis and Forecast, By Regional Analysis
8.1. Segment Overview
8.2. North America
8.2.1. U.S.
8.2.2. Canada
8.2.3. Mexico
8.3. Europe
8.3.1. Germany
8.3.2. France
8.3.3. U.K.
8.3.4. Italy
8.3.5. Spain
8.4. Asia-Pacific
8.4.1. Japan
8.4.2. China
8.4.3. India
8.5. South America
8.5.1. Brazil
8.6. Middle East and Africa
8.6.1. UAE
8.6.2. South Africa
9. Global Ship Breaking Market-Competitive Landscape
9.1. Overview
9.2. Market Share of Key Players in the Ship Breaking Market
9.2.1. Global Company Market Share
9.2.2. North America Company Market Share
9.2.3. Europe Company Market Share
9.2.4. APAC Company Market Share
9.3. Competitive Situations and Trends
9.3.1. Product Launches and Developments
9.3.2. Partnerships, Collaborations, and Agreements
9.3.3. Mergers & Acquisitions
9.3.4. Expansions
10. Company Profiles
10.1. GMS (Global Marketing Systems)
10.1.1. Business Overview
10.1.2. Company Snapshot
10.1.3. Company Market Share Analysis
10.1.4. Company Product Portfolio
10.1.5. Recent Developments
10.1.6. SWOT Analysis
10.2. Priya Blue Industries Pvt. Ltd.
10.2.1. Business Overview
10.2.2. Company Snapshot
10.2.3. Company Market Share Analysis
10.2.4. Company Product Portfolio
10.2.5. Recent Developments
10.2.6. SWOT Analysis
10.3. Shree Ram Group
10.3.1. Business Overview
10.3.2. Company Snapshot
10.3.3. Company Market Share Analysis
10.3.4. Company Product Portfolio
10.3.5. Recent Developments
10.3.6. SWOT Analysis
10.4. India Shipbreaking Industry
10.4.1. Business Overview
10.4.2. Company Snapshot
10.4.3. Company Market Share Analysis
10.4.4. Company Product Portfolio
10.4.5. Recent Developments
10.4.6. SWOT Analysis
10.5. Friends Ship Breaking Yard
10.5.1. Business Overview
10.5.2. Company Snapshot
10.5.3. Company Market Share Analysis
10.5.4. Company Product Portfolio
10.5.5. Recent Developments
10.5.6. SWOT Analysis
10.6. Chittagong Ship Breaking and Recycling Yard
10.6.1. Business Overview
10.6.2. Company Snapshot
10.6.3. Company Market Share Analysis
10.6.4. Company Product Portfolio
10.6.5. Recent Developments
10.6.6. SWOT Analysis
10.7. Layan Ship Recycling
10.7.1. Business Overview
10.7.2. Company Snapshot
10.7.3. Company Market Share Analysis
10.7.4. Company Product Portfolio
10.7.5. Recent Developments
10.7.6. SWOT Analysis
10.8. Amreli Steels Limited
10.8.1. Business Overview
10.8.2. Company Snapshot
10.8.3. Company Market Share Analysis
10.8.4. Company Product Portfolio
10.8.5. Recent Developments
10.8.6. SWOT Analysis
10.9. Malaya Ship Breaking Corporation
10.9.1. Business Overview
10.9.2. Company Snapshot
10.9.3. Company Market Share Analysis
10.9.4. Company Product Portfolio
10.9.5. Recent Developments
10.9.6. SWOT Analysis
10.10. Shandong Ship Recycling Co. Ltd.
10.10.1. Business Overview
10.10.2. Company Snapshot
10.10.3. Company Market Share Analysis
10.10.4. Company Product Portfolio
10.10.5. Recent Developments
10.10.6. SWOT Analysis
List of Table
1. Global Ship Breaking Market, By Light Displacement Tonnage, 2020-2033 (USD Billion)
2. Global Below 20,000 Tons, Ship Breaking Market, By Region, 2020-2033 (USD Billion)
3. Global 20,000 to 40,000 Tons, Ship Breaking Market, By Region, 2020-2033 (USD Billion)
4. Global Above 40,000 Tons, Ship Breaking Market, By Region, 2020-2033 (USD Billion)
5. Global Ship Breaking Market, By Method, 2020-2033 (USD Billion)
6. Global Alongside, Ship Breaking Market, By Region, 2020-2033 (USD Billion)
7. Global Beaching, Ship Breaking Market, By Region, 2020-2033 (USD Billion)
8. Global Dry Dock, Ship Breaking Market, By Region, 2020-2033 (USD Billion)
9. Global Other, Ship Breaking Market, By Region, 2020-2033 (USD Billion)
10. Global Ship Breaking Market, By Region, 2020-2033 (USD Billion)
11. North America Ship Breaking Market, By Light Displacement Tonnage, 2020-2033 (USD Billion)
12. North America Ship Breaking Market, By Method, 2020-2033 (USD Billion)
13. U.S. Ship Breaking Market, By Light Displacement Tonnage, 2020-2033 (USD Billion)
14. U.S. Ship Breaking Market, By Method, 2020-2033 (USD Billion)
15. Canada Ship Breaking Market, By Light Displacement Tonnage, 2020-2033 (USD Billion)
16. Canada Ship Breaking Market, By Method, 2020-2033 (USD Billion)
17. Mexico Ship Breaking Market, By Light Displacement Tonnage, 2020-2033 (USD Billion)
18. Mexico Ship Breaking Market, By Method, 2020-2033 (USD Billion)
19. Europe Ship Breaking Market, By Light Displacement Tonnage, 2020-2033 (USD Billion)
20. Europe Ship Breaking Market, By Method, 2020-2033 (USD Billion)
21. Germany Ship Breaking Market, By Light Displacement Tonnage, 2020-2033 (USD Billion)
22. Germany Ship Breaking Market, By Method, 2020-2033 (USD Billion)
23. France Ship Breaking Market, By Light Displacement Tonnage, 2020-2033 (USD Billion)
24. France Ship Breaking Market, By Method, 2020-2033 (USD Billion)
25. U.K. Ship Breaking Market, By Light Displacement Tonnage, 2020-2033 (USD Billion)
26. U.K. Ship Breaking Market, By Method, 2020-2033 (USD Billion)
27. Italy Ship Breaking Market, By Light Displacement Tonnage, 2020-2033 (USD Billion)
28. Italy Ship Breaking Market, By Method, 2020-2033 (USD Billion)
29. Spain Ship Breaking Market, By Light Displacement Tonnage, 2020-2033 (USD Billion)
30. Spain Ship Breaking Market, By Method, 2020-2033 (USD Billion)
31. Asia Pacific Ship Breaking Market, By Light Displacement Tonnage, 2020-2033 (USD Billion)
32. Asia Pacific Ship Breaking Market, By Method, 2020-2033 (USD Billion)
33. Japan Ship Breaking Market, By Light Displacement Tonnage, 2020-2033 (USD Billion)
34. Japan Ship Breaking Market, By Method, 2020-2033 (USD Billion)
35. China Ship Breaking Market, By Light Displacement Tonnage, 2020-2033 (USD Billion)
36. China Ship Breaking Market, By Method, 2020-2033 (USD Billion)
37. India Ship Breaking Market, By Light Displacement Tonnage, 2020-2033 (USD Billion)
38. India Ship Breaking Market, By Method, 2020-2033 (USD Billion)
39. South America Ship Breaking Market, By Light Displacement Tonnage, 2020-2033 (USD Billion)
40. South America Ship Breaking Market, By Method, 2020-2033 (USD Billion)
41. Brazil Ship Breaking Market, By Light Displacement Tonnage, 2020-2033 (USD Billion)
42. Brazil Ship Breaking Market, By Method, 2020-2033 (USD Billion)
43. Middle East and Africa Ship Breaking Market, By Light Displacement Tonnage, 2020-2033 (USD Billion)
44. Middle East and Africa Ship Breaking Market, By Method, 2020-2033 (USD Billion)
45. UAE Ship Breaking Market, By Light Displacement Tonnage, 2020-2033 (USD Billion)
46. UAE Ship Breaking Market, By Method, 2020-2033 (USD Billion)
47. South Africa Ship Breaking Market, By Light Displacement Tonnage, 2020-2033 (USD Billion)
48. South Africa Ship Breaking Market, By Method, 2020-2033 (USD Billion)
List of Figures
1. Global Ship Breaking Market Segmentation
2. Ship Breaking Market: Research Methodology
3. Market Size Estimation Methodology: Bottom-Up Approach
4. Market Size Estimation Methodology: Top-Down Approach
5. Data Triangulation
6. Porter’s Five Forces Analysis
7. Value Chain Analysis
8. Global Ship Breaking Market Attractiveness Analysis By Light Displacement Tonnage
9. Global Ship Breaking Market Attractiveness Analysis by Method
10. Global Ship Breaking Market Attractiveness Analysis by Region
11. Global Ship Breaking Market: Dynamics
12. Global Ship Breaking Market Share By Light Displacement Tonnage (2023 & 2033)
13. Global Ship Breaking Market Share by Method (2023 & 2033)
14. Global Ship Breaking Market Share by Regions (2023 & 2033)
15. Global Ship Breaking Market Share by Company (2023)
This study forecasts revenue at global, regional, and country levels from 2020 to 2033. The Brainy Insights has segmented the global ship breaking market based on below-mentioned segments:
Global Ship Breaking Market by Light Displacement Tonnage:
Global Ship Breaking Market by Method:
Global Ship Breaking Market by Region:
Research has its special purpose to undertake marketing efficiently. In this competitive scenario, businesses need information across all industry verticals; the information about customer wants, market demand, competition, industry trends, distribution channels etc. This information needs to be updated regularly because businesses operate in a dynamic environment. Our organization, The Brainy Insights incorporates scientific and systematic research procedures in order to get proper market insights and industry analysis for overall business success. The analysis consists of studying the market from a miniscule level wherein we implement statistical tools which helps us in examining the data with accuracy and precision.
Our research reports feature both; quantitative and qualitative aspects for any market. Qualitative information for any market research process are fundamental because they reveal the customer needs and wants, usage and consumption for any product/service related to a specific industry. This in turn aids the marketers/investors in knowing certain perceptions of the customers. Qualitative research can enlighten about the different product concepts and designs along with unique service offering that in turn, helps define marketing problems and generate opportunities. On the other hand, quantitative research engages with the data collection process through interviews, e-mail interactions, surveys and pilot studies. Quantitative aspects for the market research are useful to validate the hypotheses generated during qualitative research method, explore empirical patterns in the data with the help of statistical tools, and finally make the market estimations.
The Brainy Insights offers comprehensive research and analysis, based on a wide assortment of factual insights gained through interviews with CXOs and global experts and secondary data from reliable sources. Our analysts and industry specialist assume vital roles in building up statistical tools and analysis models, which are used to analyse the data and arrive at accurate insights with exceedingly informative research discoveries. The data provided by our organization have proven precious to a diverse range of companies, facilitating them to address issues such as determining which products/services are the most appealing, whether or not customers use the product in the manner anticipated, the purchasing intentions of the market and many others.
Our research methodology encompasses an idyllic combination of primary and secondary initiatives. Key phases involved in this process are listed below:

The phase involves the gathering and collecting of market data and its related information with the help of different sources & research procedures.

The data procurement stage involves in data gathering and collecting through various data sources.
This stage involves in extensive research. These data sources includes:
Purchased Database: Purchased databases play a crucial role in estimating the market sizes irrespective of the domain. Our purchased database includes:
Primary Research: The Brainy Insights interacts with leading companies and experts of the concerned domain to develop the analyst team’s market understanding and expertise. It improves and substantiates every single data presented in the market reports. Primary research mainly involves in telephonic interviews, E-mail interactions and face-to-face interviews with the raw material providers, manufacturers/producers, distributors, & independent consultants. The interviews that we conduct provides valuable data on market size and industry growth trends prevailing in the market. Our organization also conducts surveys with the various industry experts in order to gain overall insights of the industry/market. For instance, in healthcare industry we conduct surveys with the pharmacists, doctors, surgeons and nurses in order to gain insights and key information of a medical product/device/equipment which the customers are going to usage. Surveys are conducted in the form of questionnaire designed by our own analyst team. Surveys plays an important role in primary research because surveys helps us to identify the key target audiences of the market. Additionally, surveys helps to identify the key target audience engaged with the market. Our survey team conducts the survey by targeting the key audience, thus gaining insights from them. Based on the perspectives of the customers, this information is utilized to formulate market strategies. Moreover, market surveys helps us to understand the current competitive situation of the industry. To be precise, our survey process typically involve with the 360 analysis of the market. This analytical process begins by identifying the prospective customers for a product or service related to the market/industry to obtain data on how a product/service could fit into customers’ lives.

Secondary Research: The secondary data sources includes information published by the on-profit organizations such as World bank, WHO, company fillings, investor presentations, annual reports, national government documents, statistical databases, blogs, articles, white papers and others. From the annual report, we analyse a company’s revenue to understand the key segment and market share of that organization in a particular region. We analyse the company websites and adopt the product mapping technique which is important for deriving the segment revenue. In the product mapping method, we select and categorize the products offered by the companies catering to domain specific market, deduce the product revenue for each of the companies so as to get overall estimation of the market size. We also source data and analyses trends based on information received from supply side and demand side intermediaries in the value chain. The supply side denotes the data gathered from supplier, distributor, wholesaler and the demand side illustrates the data gathered from the end customers for respective market domain.

The supply side for a domain specific market is analysed by:
The demand side for the market is estimated through:
In-house Library: Apart from these third-party sources, we have our in-house library of qualitative and quantitative information. Our in-house database includes market data for various industry and domains. These data are updated on regular basis as per the changing market scenario. Our library includes, historic databases, internal audit reports and archives.
Sometimes there are instances where there is no metadata or raw data available for any domain specific market. For those cases, we use our expertise to forecast and estimate the market size in order to generate comprehensive data sets. Our analyst team adopt a robust research technique in order to produce the estimates:
Data Synthesis: This stage involves the analysis & mapping of all the information obtained from the previous step. It also involves in scrutinizing the data for any discrepancy observed while data gathering related to the market. The data is collected with consideration to the heterogeneity of sources. Robust scientific techniques are in place for synthesizing disparate data sets and provide the essential contextual information that can orient market strategies. The Brainy Insights has extensive experience in data synthesis where the data passes through various stages:


Market Deduction & Formulation: The final stage comprises of assigning data points at appropriate market spaces so as to deduce feasible conclusions. Analyst perspective & subject matter expert based holistic form of market sizing coupled with industry analysis also plays a crucial role in this stage.
This stage involves in finalization of the market size and numbers that we have collected from data integration step. With data interpolation, it is made sure that there is no gap in the market data. Successful trend analysis is done by our analysts using extrapolation techniques, which provide the best possible forecasts for the market.
Data Validation & Market Feedback: Validation is the most important step in the process. Validation & re-validation via an intricately designed process helps us finalize data-points to be used for final calculations.

The Brainy Insights interacts with leading companies and experts of the concerned domain to develop the analyst team’s market understanding and expertise. It improves and substantiates every single data presented in the market reports. The data validation interview and discussion panels are typically composed of the most experienced industry members. The participants include, however, are not limited to:
Moreover, we always validate our data and findings through primary respondents from all the major regions we are working on.


Free Customization
Fortune 500 Clients
Free Yearly Update On Purchase Of Multi/Corporate License
Companies Served Till Date