- +1-315-215-1633
- sales@thebrainyinsights.com

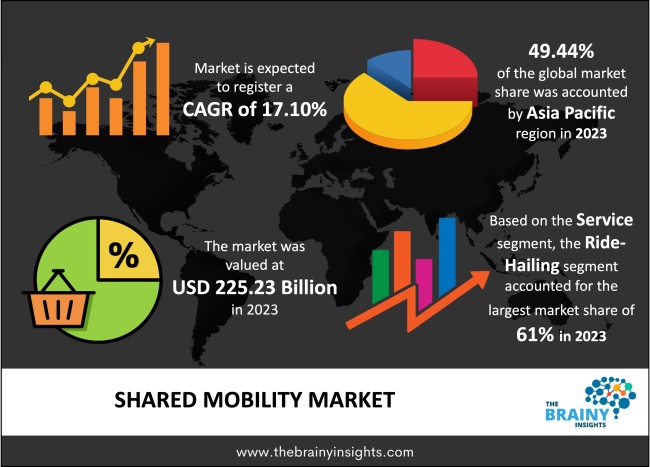
The global shared mobility market was valued at USD 225.23 billion in 2023, increasing at a CAGR of 17.10% from 2024 to 2033 and is anticipated to reach USD 1,091.93 billion by 2033. Asia Pacific is expected to grow the fastest during the forecast period. The shared mobility industry was negatively affected by the COVID-19 epidemic, and thus, there was a significant drop in ridership due to safety concerns and nationwide lockdowns. Based on the survey in China, consumers preferred using a personal vehicle as there was a lack of trust in public transportation and other safety concerns. People were inclined toward online and contactless purchases during the pandemic, which also contributed to the decline in the shared mobility market during the pandemic. Post-COVID-19, the key players focus on attracting customers using flexible subscription plans. For instance, Zoomcar has launched many plans, like subscription termination without penalties and deferment of payments, among others. Shared mobility offers a significant cost-cutting opportunity compared to conventional modes of transportation.
Shared mobility is a means of transport in which the operator owns the vehicle but rents it to the public for a limited period of time. Users could share the vehicle concurrently or one after another. The development of mobile apps, fast internet and other connectivity services allow quick and easy access to such forms of transportation. Services like mobility-as-a-service apps are integrating several forms of transport in a single on-demand transport service platform. Based on the article, from 2019, up to 2018, around USD 100 Billion got invested in shared-mobility organizations. Based on the types of investors, it was found that automotive players did not invest in the shared-mobility companies; instead, it was venture capital and private equity players who invested around 72 per cent of the total amount of the disclosed investment since 2010. Recent trends are also suggesting that car sharing has become the least used means on average by consumers, which is getting reflected due to lower trip numbers. Also, E-hailing is the most preferred way for shared mobility by consumers in China, Brazil and the US. For instance, in China, around 90% of the consumers agreed to use e-hailing services a minimum of once a week. Based on one of the articles, till October 2016, car sharing operated in 46 countries and six continents, with around 2,095 cities and approximately 15 million members sharing more than 157,000 vehicles. Similarly, till May 2018, there were around 1,600 information technology-based public bike-sharing systems globally, with more than 18.17 million bicycles. Between the years 2010 to 2018, around 207 million shared micro-mobility trips were completed in the US. Around 36.5 million trips were completed by station-based bike sharing, 9 million travels were on dockless bike sharing, and around 38.5 million journeys were on shared e-scooters in 2018. In China, till May 2018, around 6.1 million bicycles were shared by more than 640 bike-sharing programs. These factors are driving the growth of the shared mobility market.
Get an overview of this study by requesting a free sample
For example, in February 2023, BinBin, the largest micro and shared mobility provider in Turkey, announced the acquisition of Netherland-based Go Sharing, which has an e-scooter hire fleet. This acquisition helps the organization in expanding its market share in Western Europe.
For example, in July 2022, Free2move, which is a global mobility player for B2B and B2C customers, acquired Share Now company, the market leader and founder of free-floating car sharing in Europe. This acquisition aligned with the organization's strategic growth plan as a global mobility leader and expanded the mobility hub's conception to 14 new cities.
The surge in mobility trends: There are around 1.4 billion vehicles that are in operation globally. In the US, around 91% of households have access to a minimum of one vehicle. But the high car prices and emerging mobility trends are significantly declining car ownership. It is creating new opportunities for automakers and other players in the mobility sector. For instance, individual Demand-responsive transport (DRT), which is also known as e-hailing, has become very popular, and it accounts for around 90% of the total consumer expenditure on shared mobility. Moreover, private equity and venture capital organizations are investing significant money in new technologies and mobility innovation, which is surging several new mobility trends like autonomous driving, ride-sharing and peer-to-peer car sharing, among others. All these factors are eventually driving the shared mobility market.
Environment concern and government initiatives: Many governments worldwide have started initiatives to encourage congestion reduction solutions. Moreover, enhanced accessibility, reduction in driving, and declining personal car ownership is changing the lifestyle of commuters. Also, based on one of the surveys, around 60% of the people agreed to share their shared mobility ride with a stranger if that adds below 15% of their travel time but decreases the cost. Also, shared mobility projects eventually benefit the environment, society and transportation system; the Micro-mobility trend is also growing. In the US, around 84 million trips happened on shared micro-mobility in 2018. Moreover, it was found that the number of e-hailing trips tripled in 4 years, and the number of micro-mobility journeys doubled in one year. All these factors are driving the shared mobility market.
High prices for the service post-pandemic: It has been observed that the average price for the services of Uber and Lyft has increased, and it reached a record high in April 2022, which was 35% more than the pre-pandemic level. Hence both organizations witnessed 35% fewer trips and around 20% fewer users. The organization’s prices increased due to a significant increase in the price of gas. Also, there is a shortage of drivers as profits have become less. Passenger numbers are decreasing due to a surge in the fare. Investors are also putting pressure to decrease the heavy losses. All such factors act as restraints for the market.
Emerging economies: The demand for shared mobility is growing due to the growing need for on-demand transport. It has been observed that US & China are the leading countries in the global shared mobility market, as both accounted for around 56% of the market share in 2021. Also, it has been observed that ride-hailing is the most popular shared mobility service in these countries, with around 88% in China and around 77% in the US. The market will grow significantly in the future for emerging economies, especially in Southeast economies like Indonesia and Thailand, due to a surge in disposable incomes and an increase in the use of smartphones along with poor public transport provisions. Moreover, shared micro-mobility bookings will grow as consumers shift away from private passenger car travel. Also, this would further get influenced due the improvement in infrastructure and rapid urbanization. All these factors would drive the shared mobility market in the forecast period.
Use of Personal Vehicles: The use of personal vehicles can be a challenge. Based on one of the surveys, post-pandemic, consumers' intention to use personal vehicles has increased by 41%, especially in the major cities. Also, around 23% of the consumers planning to buy a new car would prefer a used car; this would gradually increase the use of personal vehicles. These factors are acting as a challenge for the market.
The regions analyzed for the market include Europe, South America, Asia Pacific, North America, the Middle East, and Africa. Asia Pacific emerged as the largest market for the global shared mobility market, with a 49.44% share of the market revenue in 2023. China is the leading country in the shared mobility market. Based on one of the surveys, around 33% of the Chinese prefer shared mobility as a mode of commuting, preferring private vehicles in second place. Also, they prefer to switch to robotaxi and shuttles in the future. Didi Chuxing of China, along with US’ Uber, are the leading shared mobility companies that focus on ride-hailing and account for around 40% of the total shared mobility bookings. China and India seem to be the most promising market due to their large population. Further, countries like India and Taiwan have underdeveloped transportation infrastructure along with high air pollution. Moreover, in India, there are many additional problems with owning vehicles, like traffic etc. and finding parking, especially in metropolitan cities like Mumbai and Bangalore. Residents prefer more comfort and convenience while saving the cost. These factors are driving the market in the region. Europe has emerged as the second largest market for the global shared mobility market. This market share is attributed to the factors such as growing consumer willingness to use shared vehicles; also, there is a regulatory push to drive people from private car ownership to other mobility options. There is also the advent of shared autonomous mobility in the region. Based on one of the studies, by 2035, the autonomous vehicle would cover around half of the shared mobility market in Europe, and there would be an estimation of around 200,000 to 1 million Autonomous driving cars used for ride-sharing services. These factors are eventually driving the shared mobility market in Europe.
Asia Pacific Region Shared Mobility Market Share in 2023 - 49.44%
www.thebrainyinsights.com
Check the geographical analysis of this market by requesting a free sample
The service segment is divided into ride-hailing, bike sharing, ride-sharing, car sharing and others. The ride-hailing segment dominated, with a market share of around 61% in 2023. This share is attributed to ride-hailing being the most accepted mode of shared mobility. Leading countries such as China have a market share of around 88%, and the US, with more than 75% of the market. This decreases the dependence on many transport apps and privately owned vehicles by combining several services like rental cars, taxis and public transport on a single platform that can be accessed using the smartphone app.
The vehicle segment is divided into shared rides and shared vehicles. The shared vehicles segment dominated, with a market share of around 70.05% in 2023. Shared vehicles consist of conventional mobility services. This is present in all countries and generally needs hubs or infrastructure. These are also integrated into governmental institutions. This service is more efficient as it transports a large population per trip and thus will help reduce the environmental impact in the future.
The sales channel segment is divided into online and offline. In 2023, the online segment dominated the market with the largest market share of 61.11%. This share is attributed to the growing use of smartphone users and fast internet facilities. The article from 2019 states that the e-hailing market accounted for more than USD 95 billion in investments. Around half of these investments were focused on the three leading global players. Also, robotaxis and shuttles could be game changers in e-hailing services because of lower operating costs than driver-based services. Also, investors are waiting for the leading players to commercialize autonomous driving technology for more profitability. These factors are eventually driving the online share.
| Attribute | Description |
|---|---|
| Market Size | Revenue (USD Billion) |
| Market size value in 2023 | USD 225.23 Billion |
| Market size value in 2033 | USD 1,091.93 Billion |
| CAGR (2024 to 2033) | 17.10% |
| Historical data | 2020-2022 |
| Base Year | 2023 |
| Forecast | 2024-2033 |
| Region | The key regions are South America, North America, Europe, Asia Pacific, and Middle East & Africa. |
| Segments | Key Segments are service, vehicle, sales channel and regions |
Asia Pacific region emerged as the largest market for the shared mobility.
The market's growth will be influenced by the surge in the mobility trends, environment concern and government initiatives.
High prices for services post-pandemic could hamper the market growth.
Emerging economies will provide huge opportunities to the market.
Key players are Uber, Car2Go, Lyft, Flinkster, DiDi Chuxing, EVCARD, Zipcar, Grab, Deutsche Bahn Connect GmbH, GreenGo and Drive Now (BMW) among others.
1. Introduction
1.1. Objectives of the Study
1.2. Market Definition
1.3. Research Scope
1.4. Currency
1.5. Key Target Audience
2. Research Methodology and Assumptions
3. Executive Summary
4. Premium Insights
4.1. Porter’s Five Forces Analysis
4.2. Value Chain Analysis
4.3. Top Investment Pockets
4.3.1. Market Attractiveness Analysis By Service
4.3.2. Market Attractiveness Analysis By Vehicle
4.3.3. Market Attractiveness Analysis By Sales Channel
4.3.4. Market Attractiveness Analysis By Region
4.4. Industry Trends
5. Market Dynamics
5.1. Market Evaluation
5.2. Drivers
5.2.1. The surge in the mobility trends
5.2.2. Environment concern and government initiatives
5.3. Restraints
5.3.1. High prices for services post pandemic
5.4. Opportunities
5.4.1. Emerging economies
5.5. Challenges
5.5.1. Use of personal vehicles
6. Global Shared Mobility Market Analysis and Forecast, By Service
6.1. Segment Overview
6.2. Ride Hailing
6.3. Bike Sharing
6.4. Ride Sharing
6.5. Car Sharing
6.6. Others
7. Global Shared Mobility Market Analysis and Forecast, By Vehicle
7.1. Segment Overview
7.2. Shared Rides
7.3. Shared Vehicles
8. Global Shared Mobility Market Analysis and Forecast, By Sales Channel
8.1. Segment Overview
8.2. Online
8.3. Offline
9. Global Shared Mobility Market Analysis and Forecast, By Regional Analysis
9.1. Segment Overview
9.2. North America
9.2.1. U.S.
9.2.2. Canada
9.2.3. Mexico
9.3. Europe
9.3.1. Germany
9.3.2. France
9.3.3. U.K.
9.3.4. Italy
9.3.5. Spain
9.4. Asia-Pacific
9.4.1. Japan
9.4.2. China
9.4.3. India
9.5. South America
9.5.1. Brazil
9.6. Middle East and Africa
9.6.1. UAE
9.6.2. South Africa
10. Global Shared Mobility Market-Competitive Landscape
10.1. Overview
10.2. Market Share of Key Players in Global Shared Mobility Market
10.2.1. Global Company Market Share
10.2.2. North America Company Market Share
10.2.3. Europe Company Market Share
10.2.4. APAC Company Market Share
10.3. Competitive Situations and Trends
10.3.1. Product Launches and Developments
10.3.2. Partnerships, Collaborations, and Agreements
10.3.3. Mergers & Acquisitions
10.3.4. Expansions
11. Company Profiles
11.1. Uber
11.1.1. Business Overview
11.1.2. Company Snapshot
11.1.3. Company Market Share Analysis
11.1.4. Company Product Portfolio
11.1.5. Recent Developments
11.1.6. SWOT Analysis
11.2. Car2Go
11.2.1. Business Overview
11.2.2. Company Snapshot
11.2.3. Company Market Share Analysis
11.2.4. Company Product Portfolio
11.2.5. Recent Developments
11.2.6. SWOT Analysis
11.3. Lyft
11.3.1. Business Overview
11.3.2. Company Snapshot
11.3.3. Company Market Share Analysis
11.3.4. Company Product Portfolio
11.3.5. Recent Developments
11.3.6. SWOT Analysis
11.4. Flinkster
11.4.1. Business Overview
11.4.2. Company Snapshot
11.4.3. Company Market Share Analysis
11.4.4. Company Product Portfolio
11.4.5. Recent Developments
11.4.6. SWOT Analysis
11.5. DiDi Chuxing
11.5.1. Business Overview
11.5.2. Company Snapshot
11.5.3. Company Market Share Analysis
11.5.4. Company Product Portfolio
11.5.5. Recent Developments
11.5.6. SWOT Analysis
11.6. EVCARD
11.6.1. Business Overview
11.6.2. Company Snapshot
11.6.3. Company Market Share Analysis
11.6.4. Company Product Portfolio
11.6.5. Recent Developments
11.6.6. SWOT Analysis
11.7. Zipcar
11.7.1. Business Overview
11.7.2. Company Snapshot
11.7.3. Company Market Share Analysis
11.7.4. Company Product Portfolio
11.7.5. Recent Developments
11.7.6. SWOT Analysis
11.8. Grab
11.8.1. Business Overview
11.8.2. Company Snapshot
11.8.3. Company Market Share Analysis
11.8.4. Company Product Portfolio
11.8.5. Recent Developments
11.8.6. SWOT Analysis
11.9. Deutsche Bahn Connect GmbH
11.9.1. Business Overview
11.9.2. Company Snapshot
11.9.3. Company Market Share Analysis
11.9.4. Company Product Portfolio
11.9.5. Recent Developments
11.9.6. SWOT Analysis
11.10. GreenGo
11.10.1. Business Overview
11.10.2. Company Snapshot
11.10.3. Company Market Share Analysis
11.10.4. Company Product Portfolio
11.10.5. Recent Developments
11.10.6. SWOT Analysis
11.11. Drive Now (BMW)
11.11.1. Business Overview
11.11.2. Company Snapshot
11.11.3. Company Market Share Analysis
11.11.4. Company Product Portfolio
11.11.5. Recent Developments
11.11.6. SWOT Analysis
List of Table
1. Global Shared Mobility Market, By Service, 2020-2033 (USD Billion)
2. Global Ride Hailing, Shared Mobility Market, By Region, 2020-2033 (USD Billion)
3. Global Bike Sharing, Shared Mobility Market, By Region, 2020-2033 (USD Billion)
4. Global Ride Sharing, Shared Mobility Market, By Region, 2020-2033 (USD Billion)
5. Global Car Sharing, Shared Mobility Market, By Region, 2020-2033 (USD Billion)
6. Global Others, Shared Mobility Market, By Region, 2020-2033 (USD Billion)
7. Global Shared Mobility Market, By Vehicle, 2020-2033 (USD Billion)
8. Global Shared Rides, Shared Mobility Market, By Region, 2020-2033 (USD Billion)
9. Global Shared Vehicles, Shared Mobility Market, By Region, 2020-2033 (USD Billion)
10. Global Shared Mobility Market, By Sales Channel, 2020-2033 (USD Billion)
11. Global Online, Shared Mobility Market, By Region, 2020-2033 (USD Billion)
12. Global Offline, Shared Mobility Market, By Region, 2020-2033 (USD Billion)
13. North America Shared Mobility Market, By Service, 2020-2033 (USD Billion)
14. North America Shared Mobility Market, By Vehicle, 2020-2033 (USD Billion)
15. North America Shared Mobility Market, By Sales Channel, 2020-2033 (USD Billion)
16. U.S. Shared Mobility Market, By Service, 2020-2033 (USD Billion)
17. U.S. Shared Mobility Market, By Vehicle, 2020-2033 (USD Billion)
18. U.S. Shared Mobility Market, By Sales Channel, 2020-2033 (USD Billion)
19. Canada Shared Mobility Market, By Service, 2020-2033 (USD Billion)
20. Canada Shared Mobility Market, By Vehicle, 2020-2033 (USD Billion)
21. Canada Shared Mobility Market, By Sales Channel, 2020-2033 (USD Billion)
22. Mexico Shared Mobility Market, By Service, 2020-2033 (USD Billion)
23. Mexico Shared Mobility Market, By Vehicle, 2020-2033 (USD Billion)
24. Mexico Shared Mobility Market, By Sales Channel, 2020-2033 (USD Billion)
25. Europe Shared Mobility Market, By Service, 2020-2033 (USD Billion)
26. Europe Shared Mobility Market, By Vehicle, 2020-2033 (USD Billion)
27. Europe Shared Mobility Market, By Sales Channel, 2020-2033 (USD Billion)
28. Germany Shared Mobility Market, By Service, 2020-2033 (USD Billion)
29. Germany Shared Mobility Market, By Vehicle, 2020-2033 (USD Billion)
30. Germany Shared Mobility Market, By Sales Channel, 2020-2033 (USD Billion)
31. France Shared Mobility Market, By Service, 2020-2033 (USD Billion)
32. France Shared Mobility Market, By Vehicle, 2020-2033 (USD Billion)
33. France Shared Mobility Market, By Sales Channel, 2020-2033 (USD Billion)
34. U.K. Shared Mobility Market, By Service, 2020-2033 (USD Billion)
35. U.K. Shared Mobility Market, By Vehicle, 2020-2033 (USD Billion)
36. U.K. Shared Mobility Market, By Sales Channel, 2020-2033 (USD Billion)
37. Italy Shared Mobility Market, By Service, 2020-2033 (USD Billion)
38. Italy Shared Mobility Market, By Vehicle, 2020-2033 (USD Billion)
39. Italy Shared Mobility Market, By Sales Channel, 2020-2033 (USD Billion)
40. Spain Shared Mobility Market, By Service, 2020-2033 (USD Billion)
41. Spain Shared Mobility Market, By Vehicle, 2020-2033 (USD Billion)
42. Spain Shared Mobility Market, By Sales Channel, 2020-2033 (USD Billion)
43. Asia Pacific Shared Mobility Market, By Service, 2020-2033 (USD Billion)
44. Asia Pacific Shared Mobility Market, By Vehicle, 2020-2033 (USD Billion)
45. Asia Pacific Shared Mobility Market, By Sales Channel, 2020-2033 (USD Billion)
46. Japan Shared Mobility Market, By Service, 2020-2033 (USD Billion)
47. Japan Shared Mobility Market, By Vehicle, 2020-2033 (USD Billion)
48. Japan Shared Mobility Market, By Sales Channel, 2020-2033 (USD Billion)
49. China Shared Mobility Market, By Service, 2020-2033 (USD Billion)
50. China Shared Mobility Market, By Vehicle, 2020-2033 (USD Billion)
51. China Shared Mobility Market, By Sales Channel, 2020-2033 (USD Billion)
52. India Shared Mobility Market, By Service, 2020-2033 (USD Billion)
53. India Shared Mobility Market, By Vehicle, 2020-2033 (USD Billion)
54. India Shared Mobility Market, By Sales Channel, 2020-2033 (USD Billion)
55. South America Shared Mobility Market, By Service, 2020-2033 (USD Billion)
56. South America Shared Mobility Market, By Vehicle, 2020-2033 (USD Billion)
57. South America Shared Mobility Market, By Sales Channel, 2020-2033 (USD Billion)
58. Brazil Shared Mobility Market, By Service, 2020-2033 (USD Billion)
59. Brazil Shared Mobility Market, By Sales Channel, 2020-2033 (USD Billion)
60. Brazil Shared Mobility Market, By Vehicle, 2020-2033 (USD Billion)
61. Middle East and Africa Shared Mobility Market, By Service, 2020-2033 (USD Billion)
62. Middle East and Africa Shared Mobility Market, By Vehicle, 2020-2033 (USD Billion)
63. Middle East and Africa Shared Mobility Market, By Sales Channel, 2020-2033 (USD Billion)
64. UAE Shared Mobility Market, By Service, 2020-2033 (USD Billion)
65. UAE Shared Mobility Market, By Vehicle, 2020-2033 (USD Billion)
66. UAE Shared Mobility Market, By Sales Channel, 2020-2033 (USD Billion)
67. South Africa Shared Mobility Market, By Service, 2020-2033 (USD Billion)
68. South Africa Shared Mobility Market, By Vehicle, 2020-2033 (USD Billion)
69. South Africa Shared Mobility Market, By Sales Channel, 2020-2033 (USD Billion)
List of Figures
1. Global Shared Mobility Market Segmentation
2. Global Shared Mobility Market: Research Methodology
3. Market Size Estimation Methodology: Bottom-Up Approach
4. Market Size Estimation Methodology: Top-Down Approach
5. Data Triangulation
6. Porter’s Five Forces Analysis
7. Value Chain Analysis
8. Global Shared Mobility Market Attractiveness Analysis By Service
9. Global Shared Mobility Market Attractiveness Analysis By Vehicle
10. Global Shared Mobility Market Attractiveness Analysis By Sales Channel
11. Global Shared Mobility Market Attractiveness Analysis By Region
12. Global Shared Mobility Market: Dynamics
13. Global Shared Mobility Market Share By Service (2023 & 2033)
14. Global Shared Mobility Market Share By Vehicle (2023 & 2033)
15. Global Shared Mobility Market Share By Sales Channel (2023 & 2033)
16. Global Shared Mobility Market Share By Regions (2023 & 2033)
17. Global Shared Mobility Market Share By Company (2023)
This study forecasts revenue at global, regional, and country levels from 2020 to 2033. The Brainy Insights has segmented the global shared mobility market based on below mentioned segments:
Global Shared Mobility Market by Service:
Global Shared Mobility Market by Vehicle:
Global Shared Mobility Market by Sales Channel:
Global Shared Mobility by Region:
Research has its special purpose to undertake marketing efficiently. In this competitive scenario, businesses need information across all industry verticals; the information about customer wants, market demand, competition, industry trends, distribution channels etc. This information needs to be updated regularly because businesses operate in a dynamic environment. Our organization, The Brainy Insights incorporates scientific and systematic research procedures in order to get proper market insights and industry analysis for overall business success. The analysis consists of studying the market from a miniscule level wherein we implement statistical tools which helps us in examining the data with accuracy and precision.
Our research reports feature both; quantitative and qualitative aspects for any market. Qualitative information for any market research process are fundamental because they reveal the customer needs and wants, usage and consumption for any product/service related to a specific industry. This in turn aids the marketers/investors in knowing certain perceptions of the customers. Qualitative research can enlighten about the different product concepts and designs along with unique service offering that in turn, helps define marketing problems and generate opportunities. On the other hand, quantitative research engages with the data collection process through interviews, e-mail interactions, surveys and pilot studies. Quantitative aspects for the market research are useful to validate the hypotheses generated during qualitative research method, explore empirical patterns in the data with the help of statistical tools, and finally make the market estimations.
The Brainy Insights offers comprehensive research and analysis, based on a wide assortment of factual insights gained through interviews with CXOs and global experts and secondary data from reliable sources. Our analysts and industry specialist assume vital roles in building up statistical tools and analysis models, which are used to analyse the data and arrive at accurate insights with exceedingly informative research discoveries. The data provided by our organization have proven precious to a diverse range of companies, facilitating them to address issues such as determining which products/services are the most appealing, whether or not customers use the product in the manner anticipated, the purchasing intentions of the market and many others.
Our research methodology encompasses an idyllic combination of primary and secondary initiatives. Key phases involved in this process are listed below:

The phase involves the gathering and collecting of market data and its related information with the help of different sources & research procedures.

The data procurement stage involves in data gathering and collecting through various data sources.
This stage involves in extensive research. These data sources includes:
Purchased Database: Purchased databases play a crucial role in estimating the market sizes irrespective of the domain. Our purchased database includes:
Primary Research: The Brainy Insights interacts with leading companies and experts of the concerned domain to develop the analyst team’s market understanding and expertise. It improves and substantiates every single data presented in the market reports. Primary research mainly involves in telephonic interviews, E-mail interactions and face-to-face interviews with the raw material providers, manufacturers/producers, distributors, & independent consultants. The interviews that we conduct provides valuable data on market size and industry growth trends prevailing in the market. Our organization also conducts surveys with the various industry experts in order to gain overall insights of the industry/market. For instance, in healthcare industry we conduct surveys with the pharmacists, doctors, surgeons and nurses in order to gain insights and key information of a medical product/device/equipment which the customers are going to usage. Surveys are conducted in the form of questionnaire designed by our own analyst team. Surveys plays an important role in primary research because surveys helps us to identify the key target audiences of the market. Additionally, surveys helps to identify the key target audience engaged with the market. Our survey team conducts the survey by targeting the key audience, thus gaining insights from them. Based on the perspectives of the customers, this information is utilized to formulate market strategies. Moreover, market surveys helps us to understand the current competitive situation of the industry. To be precise, our survey process typically involve with the 360 analysis of the market. This analytical process begins by identifying the prospective customers for a product or service related to the market/industry to obtain data on how a product/service could fit into customers’ lives.

Secondary Research: The secondary data sources includes information published by the on-profit organizations such as World bank, WHO, company fillings, investor presentations, annual reports, national government documents, statistical databases, blogs, articles, white papers and others. From the annual report, we analyse a company’s revenue to understand the key segment and market share of that organization in a particular region. We analyse the company websites and adopt the product mapping technique which is important for deriving the segment revenue. In the product mapping method, we select and categorize the products offered by the companies catering to domain specific market, deduce the product revenue for each of the companies so as to get overall estimation of the market size. We also source data and analyses trends based on information received from supply side and demand side intermediaries in the value chain. The supply side denotes the data gathered from supplier, distributor, wholesaler and the demand side illustrates the data gathered from the end customers for respective market domain.

The supply side for a domain specific market is analysed by:
The demand side for the market is estimated through:
In-house Library: Apart from these third-party sources, we have our in-house library of qualitative and quantitative information. Our in-house database includes market data for various industry and domains. These data are updated on regular basis as per the changing market scenario. Our library includes, historic databases, internal audit reports and archives.
Sometimes there are instances where there is no metadata or raw data available for any domain specific market. For those cases, we use our expertise to forecast and estimate the market size in order to generate comprehensive data sets. Our analyst team adopt a robust research technique in order to produce the estimates:
Data Synthesis: This stage involves the analysis & mapping of all the information obtained from the previous step. It also involves in scrutinizing the data for any discrepancy observed while data gathering related to the market. The data is collected with consideration to the heterogeneity of sources. Robust scientific techniques are in place for synthesizing disparate data sets and provide the essential contextual information that can orient market strategies. The Brainy Insights has extensive experience in data synthesis where the data passes through various stages:


Market Deduction & Formulation: The final stage comprises of assigning data points at appropriate market spaces so as to deduce feasible conclusions. Analyst perspective & subject matter expert based holistic form of market sizing coupled with industry analysis also plays a crucial role in this stage.
This stage involves in finalization of the market size and numbers that we have collected from data integration step. With data interpolation, it is made sure that there is no gap in the market data. Successful trend analysis is done by our analysts using extrapolation techniques, which provide the best possible forecasts for the market.
Data Validation & Market Feedback: Validation is the most important step in the process. Validation & re-validation via an intricately designed process helps us finalize data-points to be used for final calculations.

The Brainy Insights interacts with leading companies and experts of the concerned domain to develop the analyst team’s market understanding and expertise. It improves and substantiates every single data presented in the market reports. The data validation interview and discussion panels are typically composed of the most experienced industry members. The participants include, however, are not limited to:
Moreover, we always validate our data and findings through primary respondents from all the major regions we are working on.


Free Customization
Fortune 500 Clients
Free Yearly Update On Purchase Of Multi/Corporate License
Companies Served Till Date