- +1-315-215-1633
- sales@thebrainyinsights.com

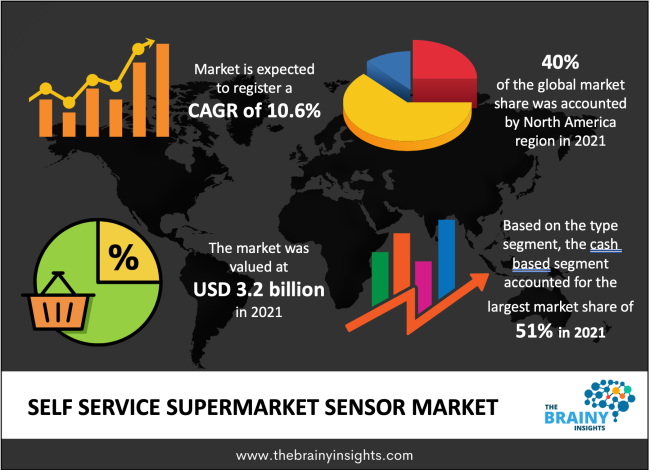
The Self-Service Supermarket Sensor market was estimated at around 3.2 billion in 2021, growing at a CAGR of nearly 10.6% during 2022-2030. The market is projected to reach approximately USD 9.8 billion by 2030.
Self-checkout systems are automated systems used in the retail, supermarket, and hospitality sectors to assist customers with self-ordering and checkout without the assistance of any staff members. The previous self-checkout systems required a substantial amount of storage space and consisted of discrete, off-the-shelf components. The modern self-checkout systems, on the other hand, are redesigned and produced to meet market demand to fit the store layout and enhance functionality, cost, form factors, and dependability. Cashless systems are now being offered by kiosk suppliers because to the increased popularity of safe and self-payment technology, which is anticipated to drive market expansion over the coming years.
Automation is quickly replacing traditional forces of transformation in many global sectors. Self-checkout systems are projected to become more prevalent in warehouses and store operations due to the rising adoption of automation across sectors and businesses including retail and hospitality. Self-ordering, self-scan and pay, and other features that reduce long lines are factors in their rising market popularity. The adoption of robotic and automation goods has also significantly increased in the retail sector over the past several years because of the shrinking workforce.
Get an overview of this study by requesting a free sample
The COVID-19 pandemic has had a major impact on the global economy. Governments around the world have been forced to take many precautionary measures due to the spread of COVID-19. Many merchants are adopting business models from zero-touch procedures to remote working at a higher rate. These actions paved the way for commercial expansion, but they also brought obstacles. In addition, due to the shortage of workers in retail stores, customers tend to self-service purchases, choosing the items they need without the help of sales associates who can explain each item in detail. became. However, sourcing raw materials and parts across countries has been a struggle among vendors due to business shutdowns. Component supplies were limited as most vendors were based in China and other Asia-Pacific countries.
Customer service enhancement to accelerate the market’s growth
There have been initiatives to better the consumer experience. The companies are empowered by the usage of the self-service products. They are getting excellent outcomes in terms of client satisfaction and loyalty by doing this. A significant motivator is the greater accessibility of tools connected to service touchpoints.
The market is still expanding at a steady rate thanks to technological advancements and rising IoT penetration in the retail sector. To alleviate in-store problems with inventory mapping, product information identification, payment, and customer experience, store owners are spending more and more in technology. For example, motion sensors and lasers assist merchants in identifying products that have been shoplifted or that have not been scanned at self-checkout counters. Self-checkout systems would also make it easier for customers to understand the various product features and promotional offers made available in the store and check out fast without assistance from staff. To increase customer involvement and improve their shopping experiences, self-checkout systems also act as an extra touchpoint for business owners.
The market is likely to grow steadily because of the advantages listed above, although lack of awareness and an increase in skimming, fraud, and shoplifting are expected to hinder market expansion. Another element that could influence the industry's growth is the older population's reluctance to use self-checkout services. Seniors with mobility problems and illnesses like dementia, as well as those with hearing, vision, and memory loss, need extra exceptional care. Additionally, poor technology know-how in underdeveloped nations sometimes leads to the avoidance of self-checkout systems throughout retail establishments.
In 2021, the systems category had the highest revenue share more than 61%. The significant proportion is attributable to the increasing use of cutting-edge technology in self-checkout systems, including artificial intelligence, voice interface, and computer vision. Retailers strongly favour modern hardware systems over outdated checkout procedures. The most recent hybrid self-checkout systems include cutting-edge security-based features, large coin dispenser capacities, and user-friendly consumer interfaces, as well as multi-item scanning and cashless transactions. Additionally, the increased consumer preference for both cash and cashless transactions is forcing shops to set up brand-new, high-tech systems.
With a revenue share of more than 50% in 2021, cash-based systems became the largest sector. The market is being driven by small, medium, and big retailers' expanding options for paper-based transactions. Customers who only have a few goods in their luggage prefer to pay at self-service kiosks in retail establishments. Additionally, many customers choose using cash or a credit card to pay. The higher level of consumer flexibility provided by cash-based systems for both cash and cashless transactions contributes to the segment's expansion. The U.S. government's promotion of cash-based transactions in retail establishments is another factor that is impacting the market's expansion.
Over the course of the projected period, Asia Pacific is anticipated to become the region with the quickest rate of growth. The expansion of the regional market is anticipated to be aided by the expansion of the retail and hospitality sectors as well as the expanding automation and digitalization trend. To give customers a seamless shopping experience, retail shops in the area are growing through hyperlocal services and progressively embracing omnichannel techniques. Other factors that led to the expansion of the regional market were an increase in household costs, a decline in household size, rapid urbanization, rising disposable income, and the adoption of new technologies. For instance, Worldline, a French multinational provider of payment and transactional services, and Toshiba Corporation, a Japanese corporation, collaborated in June 2021 to assist the former in commercializing their Pro-X Hybrid Kiosk.
The global Self Service Supermarket Sensor market is segmented as follows:
By Component
By Type
By Region/Geography
| Attribute | Description |
|---|---|
| Base Year | 2021 |
| Forecast period | 2022-2030 |
| Report Coverage | Revenue estimation and forecast, company profile, competitive landscape, growth factors, and recent trends |
| Regional scope | North America, Europe, Asia Pacific, Middle East & Africa, and Latin America |
| Market Size(unit) | USD Billion |
| CAGR (2022 to 2030) | 10.6% |
| Segments Covered |
By Component |
1. Introduction
1.1. Objectives of the Study
1.2. Market Definition
1.3. Research Scope
2. Research Methodology and Assumptions
3. Executive Summary
4. Premium Insights
4.1. Porter’s Five Forces Analysis
4.2. Value Chain Analysis
4.3. Top Investment Pockets
4.3.1. Market Attractiveness Analysis By Component
4.3.2. Market Attractiveness Analysis By Type
4.4. Industry Trends
5. Market Dynamics
5.1. Market Evaluation
5.2. Drivers
5.2.1. Customer service enhancement to accelerate the market’s growth
5.3. Restrains
5.3.1. Availability of substitute/lack of knowledge would hamper the market
5.4. Opportunities
5.4.1. Growing market
6. Global Self Service Supermarket Sensor Market Analysis and Forecast, By Component
6.1. Segment Overview
6.2. Systems
6.3. Services
7. Global Self Service Supermarket Sensor Market Analysis and Forecast, By Type
7.1. Segment Overview
7.2. Cash-Based Systems
7.3. Cashless-Based Systems
8. Global Self Service Supermarket Sensor Market Analysis and Forecast, By Regional Analysis
8.1. Segment Overview
8.2. North America
8.2.1. U.S.
8.2.2. Canada
8.2.3. Mexico
8.3. Europe
8.3.1. Germany
8.3.2. France
8.3.3. U.K.
8.3.4. Italy
8.3.5. Spain
8.3.6. Rest of Europe
8.4. Asia-Pacific
8.4.1. Japan
8.4.2. China
8.4.3. India
8.4.4. Australia
8.4.5. South Korea
8.4.6. Rest of Asia-Pacific
8.5. South America
8.5.1. Brazil
8.5.2. Argentina
8.5.3. Rest of South America
8.6. Middle East and Africa
8.6.1. UAE
8.6.2. South Africa
8.6.3. Egypt
8.6.4. Kuwait
8.6.5. Saudi Arabia
8.6.6. Rest of Middle East & Africa
9. Global Self Service Supermarket Sensor Market-Competitive Landscape
9.1. Overview
9.2. Market Share of Key Players in the Self Service Supermarket Sensor market
9.2.1. Global Company Market Share
9.2.2. North America Company Market Share
9.2.3. Europe Company Market Share
9.2.4. APAC Company Market Share
9.3. Competitive Situations and Trends
9.3.1. Component Launches and Developments
9.3.2. Partnerships, Collaborations, and Agreements
9.3.3. Mergers & Acquisitions
9.3.4. Expansions
10. Company Profiles
10.1. Diebold Nixdorf, Incorporated
10.1.1. Business Overview
10.1.2. Company Snapshot
10.1.3. Company Market Share Analysis
10.1.4. Company Type Portfolio
10.1.5. Recent Developments
10.1.6. SWOT Analysis
10.2. ECR Software Corporation
10.2.1. Business Overview
10.2.2. Company Snapshot
10.2.3. Company Market Share Analysis
10.2.4. Company Type Portfolio
10.2.5. Recent Developments
10.2.6. SWOT Analysis
10.3. FUJITSU
10.3.1. Business Overview
10.3.2. Company Snapshot
10.3.3. Company Market Share Analysis
10.3.4. Company Type Portfolio
10.3.5. Recent Developments
10.3.6. SWOT Analysis
10.4. Gilbarco Inc.
10.4.1. Business Overview
10.4.2. Company Snapshot
10.4.3. Company Market Share Analysis
10.4.4. Company Type Portfolio
10.4.5. Recent Developments
10.4.6. SWOT Analysis
10.5. ITAB Group
10.5.1. Business Overview
10.5.2. Company Snapshot
10.5.3. Company Market Share Analysis
10.5.4. Company Type Portfolio
10.5.5. Recent Developments
10.5.6. SWOT Analysis
10.6. NCR Corporation
10.6.1. Business Overview
10.6.2. Company Snapshot
10.6.3. Company Market Share Analysis
10.6.4. Company Type Portfolio
10.6.5. Recent Developments
10.6.6. SWOT Analysis
10.7. Pan-Oston
10.7.1. Business Overview
10.7.2. Company Snapshot
10.7.3. Company Market Share Analysis
10.7.4. Company Type Portfolio
10.7.5. Recent Developments
10.7.6. SWOT Analysis
10.8. PCMS Groups Ltd.
10.8.1. Business Overview
10.8.2. Company Snapshot
10.8.3. Company Market Share Analysis
10.8.4. Company Type Portfolio
10.8.5. Recent Developments
10.8.6. SWOT Analysis
10.9. Strong Point
10.9.1. Business Overview
10.9.2. Company Snapshot
10.9.3. Company Market Share Analysis
10.9.4. Company Type Portfolio
10.9.5. Recent Developments
10.9.6. SWOT Analysis
10.10. Toshiba Global Commerce Solutions
10.10.1. Business Overview
10.10.2. Company Snapshot
10.10.3. Company Market Share Analysis
10.10.4. Company Type Portfolio
10.10.5. Recent Developments
10.10.6. SWOT Analysis
List of Table
1. Global Self Service Supermarket Sensor Market, By Component, 2022-2030(USD Billion)
2. Global Systems Self Service Supermarket Sensor Market, By Region, 2022-2030(USD Billion)
3. Global Services Self Service Supermarket Sensor Market, By Region, 2022-2030(USD Billion)
4. Global Self Service Supermarket Sensor Market, By Type, 2022-2030(USD Billion)
5. Global Cash-Based Systems Self Service Supermarket Sensor Market, By Region, 2022-2030(USD Billion)
6. Global Cashless-Based Systems Self Service Supermarket Sensor Market, By Region, 2022-2030(USD Billion)
7. Global Self Service Supermarket Sensor Market, By Region, 2022-2030(USD Billion)
8. Global Self Service Supermarket Sensor Market, By North America, 2022-2030(USD Billion)
9. North America Self Service Supermarket Sensor Market, By Component, 2022-2030(USD Billion)
10. North America Self Service Supermarket Sensor Market, By Type, 2022-2030(USD Billion)
11. U.S. Self Service Supermarket Sensor Market, By Component, 2022-2030(USD Billion)
12. U.S. Self Service Supermarket Sensor Market, By Type, 2022-2030(USD Billion)
13. Canada Self Service Supermarket Sensor Market, By Component, 2022-2030(USD Billion)
14. Canada Self Service Supermarket Sensor Market, By Type, 2022-2030(USD Billion)
15. Mexico Self Service Supermarket Sensor Market, By Component, 2022-2030(USD Billion)
16. Mexico Self Service Supermarket Sensor Market, By Type, 2022-2030(USD Billion)
17. Europe Self Service Supermarket Sensor Market, By Component, 2022-2030(USD Billion)
18. Europe Self Service Supermarket Sensor Market, By Type, 2022-2030(USD Billion)
19. Germany Self Service Supermarket Sensor Market, By Component, 2022-2030(USD Billion)
20. Germany Self Service Supermarket Sensor Market, By Type, 2022-2030(USD Billion)
21. France Self Service Supermarket Sensor Market, By Component, 2022-2030(USD Billion)
22. France Self Service Supermarket Sensor Market, By Type, 2022-2030(USD Billion)
23. U.K. Self Service Supermarket Sensor Market, By Component, 2022-2030(USD Billion)
24. U.K. Self Service Supermarket Sensor Market, By Type, 2022-2030(USD Billion)
25. Italy Self Service Supermarket Sensor Market, By Component, 2022-2030(USD Billion)
26. Italy Self Service Supermarket Sensor Market, By Type, 2022-2030(USD Billion)
27. Spain Self Service Supermarket Sensor Market, By Component, 2022-2030(USD Billion)
28. Spain Self Service Supermarket Sensor Market, By Type, 2022-2030(USD Billion)
29. Rest of Europe Self Service Supermarket Sensor Market, By Component, 2022-2030(USD Billion)
30. Rest of Europe Self Service Supermarket Sensor Market, By Type, 2022-2030(USD Billion)
31. Asia Pacific Self Service Supermarket Sensor Market, By Component, 2022-2030(USD Billion)
32. Asia Pacific Self Service Supermarket Sensor Market, By Type, 2022-2030(USD Billion)
33. Japan Self Service Supermarket Sensor Market, By Component, 2022-2030(USD Billion)
34. Japan Self Service Supermarket Sensor Market, By Type, 2022-2030(USD Billion)
35. China Self Service Supermarket Sensor Market, By Component, 2022-2030(USD Billion)
36. China Self Service Supermarket Sensor Market, By Type, 2022-2030(USD Billion)
37. India Self Service Supermarket Sensor Market, By Component, 2022-2030(USD Billion)
38. India Self Service Supermarket Sensor Market, By Type, 2022-2030(USD Billion)
39. Australia Self Service Supermarket Sensor Market, By Component, 2022-2030(USD Billion)
40. Australia Self Service Supermarket Sensor Market, By Type, 2022-2030(USD Billion)
41. South Korea Self Service Supermarket Sensor Market, By Component, 2022-2030(USD Billion)
42. South Korea Self Service Supermarket Sensor Market, By Type, 2022-2030(USD Billion)
43. Rest of Asia-Pacific Self Service Supermarket Sensor Market, By Component, 2022-2030(USD Billion)
44. Rest of Asia-Pacific Self Service Supermarket Sensor Market, By Type, 2022-2030(USD Billion)
45. South America Self Service Supermarket Sensor Market, By Component, 2022-2030(USD Billion)
46. South America Self Service Supermarket Sensor Market, By Type, 2022-2030(USD Billion)
47. Brazil Self Service Supermarket Sensor Market, By Component, 2022-2030(USD Billion)
48. Brazil Self Service Supermarket Sensor Market, By Type, 2022-2030(USD Billion)
49. Argentina Self Service Supermarket Sensor Market, By Component, 2022-2030(USD Billion)
50. Argentina Self Service Supermarket Sensor Market, By Type, 2022-2030(USD Billion)
51. Rest of Latin America Self Service Supermarket Sensor Market, By Component, 2022-2030(USD Billion)
52. Rest of Latin America Self Service Supermarket Sensor Market, By Type, 2022-2030(USD Billion)
53. Middle East and Africa Self Service Supermarket Sensor Market, By Component, 2022-2030(USD Billion)
54. Middle East and Africa Self Service Supermarket Sensor Market, By Type, 2022-2030(USD Billion)
55. UAE Self Service Supermarket Sensor Market, By Component, 2022-2030(USD Billion)
56. UAE Self Service Supermarket Sensor Market, By Type, 2022-2030(USD Billion)
57. South Africa Self Service Supermarket Sensor Market, By Component, 2022-2030(USD Billion)
58. South Africa Self Service Supermarket Sensor Market, By Type, 2022-2030(USD Billion)
59. Egypt Self Service Supermarket Sensor Market, By Component, 2022-2030(USD Billion)
60. Egypt Self Service Supermarket Sensor Market, By Type, 2022-2030(USD Billion)
61. Kuwait Self Service Supermarket Sensor Market, By Component, 2022-2030(USD Billion)
62. Kuwait Self Service Supermarket Sensor Market, By Type, 2022-2030(USD Billion)
63. Saudi Arabia Self Service Supermarket Sensor Market, By Component, 2022-2030(USD Billion)
64. Saudi Arabia Self Service Supermarket Sensor Market, By Type, 2022-2030(USD Billion)
65. Rest of Middle East Self Service Supermarket Sensor Market, By Component, 2022-2030(USD Billion)
66. Rest of Middle East Self Service Supermarket Sensor Market, By Type, 2022-2030(USD Billion)
List of Figures
1. Global Self Service Supermarket Sensor Market Segmentation
2. Self Service Supermarket Sensor Market: Research Methodology
3. Market Size Estimation Methodology: Bottom-Up Approach
4. Market Size Estimation Methodology: Top-Down Approach
5. Data Triangulation
6. Porter’s Five Forces Analysis
7. Value Chain Analysis
8. Global Self Service Supermarket Sensor Market Attractiveness Analysis By Component
9. Global Self Service Supermarket Sensor Market Attractiveness Analysis By Type
10. Global Self Service Supermarket Sensor Market Attractiveness Analysis By Region
11. Global Self Service Supermarket Sensor Market: Dynamics
12. Global Self Service Supermarket Sensor Market Share By Component(2022 & 2030)
13. Global Self Service Supermarket Sensor Market Share By Type(2022 & 2030)
14. Global Self Service Supermarket Sensor Market Share by Regions (2022 & 2030)
15. Global Self Service Supermarket Sensor Market Share by Company (2021)
By Component
By Type
By Region/Geography
Research has its special purpose to undertake marketing efficiently. In this competitive scenario, businesses need information across all industry verticals; the information about customer wants, market demand, competition, industry trends, distribution channels etc. This information needs to be updated regularly because businesses operate in a dynamic environment. Our organization, The Brainy Insights incorporates scientific and systematic research procedures in order to get proper market insights and industry analysis for overall business success. The analysis consists of studying the market from a miniscule level wherein we implement statistical tools which helps us in examining the data with accuracy and precision.
Our research reports feature both; quantitative and qualitative aspects for any market. Qualitative information for any market research process are fundamental because they reveal the customer needs and wants, usage and consumption for any product/service related to a specific industry. This in turn aids the marketers/investors in knowing certain perceptions of the customers. Qualitative research can enlighten about the different product concepts and designs along with unique service offering that in turn, helps define marketing problems and generate opportunities. On the other hand, quantitative research engages with the data collection process through interviews, e-mail interactions, surveys and pilot studies. Quantitative aspects for the market research are useful to validate the hypotheses generated during qualitative research method, explore empirical patterns in the data with the help of statistical tools, and finally make the market estimations.
The Brainy Insights offers comprehensive research and analysis, based on a wide assortment of factual insights gained through interviews with CXOs and global experts and secondary data from reliable sources. Our analysts and industry specialist assume vital roles in building up statistical tools and analysis models, which are used to analyse the data and arrive at accurate insights with exceedingly informative research discoveries. The data provided by our organization have proven precious to a diverse range of companies, facilitating them to address issues such as determining which products/services are the most appealing, whether or not customers use the product in the manner anticipated, the purchasing intentions of the market and many others.
Our research methodology encompasses an idyllic combination of primary and secondary initiatives. Key phases involved in this process are listed below:

The phase involves the gathering and collecting of market data and its related information with the help of different sources & research procedures.

The data procurement stage involves in data gathering and collecting through various data sources.
This stage involves in extensive research. These data sources includes:
Purchased Database: Purchased databases play a crucial role in estimating the market sizes irrespective of the domain. Our purchased database includes:
Primary Research: The Brainy Insights interacts with leading companies and experts of the concerned domain to develop the analyst team’s market understanding and expertise. It improves and substantiates every single data presented in the market reports. Primary research mainly involves in telephonic interviews, E-mail interactions and face-to-face interviews with the raw material providers, manufacturers/producers, distributors, & independent consultants. The interviews that we conduct provides valuable data on market size and industry growth trends prevailing in the market. Our organization also conducts surveys with the various industry experts in order to gain overall insights of the industry/market. For instance, in healthcare industry we conduct surveys with the pharmacists, doctors, surgeons and nurses in order to gain insights and key information of a medical product/device/equipment which the customers are going to usage. Surveys are conducted in the form of questionnaire designed by our own analyst team. Surveys plays an important role in primary research because surveys helps us to identify the key target audiences of the market. Additionally, surveys helps to identify the key target audience engaged with the market. Our survey team conducts the survey by targeting the key audience, thus gaining insights from them. Based on the perspectives of the customers, this information is utilized to formulate market strategies. Moreover, market surveys helps us to understand the current competitive situation of the industry. To be precise, our survey process typically involve with the 360 analysis of the market. This analytical process begins by identifying the prospective customers for a product or service related to the market/industry to obtain data on how a product/service could fit into customers’ lives.

Secondary Research: The secondary data sources includes information published by the on-profit organizations such as World bank, WHO, company fillings, investor presentations, annual reports, national government documents, statistical databases, blogs, articles, white papers and others. From the annual report, we analyse a company’s revenue to understand the key segment and market share of that organization in a particular region. We analyse the company websites and adopt the product mapping technique which is important for deriving the segment revenue. In the product mapping method, we select and categorize the products offered by the companies catering to domain specific market, deduce the product revenue for each of the companies so as to get overall estimation of the market size. We also source data and analyses trends based on information received from supply side and demand side intermediaries in the value chain. The supply side denotes the data gathered from supplier, distributor, wholesaler and the demand side illustrates the data gathered from the end customers for respective market domain.

The supply side for a domain specific market is analysed by:
The demand side for the market is estimated through:
In-house Library: Apart from these third-party sources, we have our in-house library of qualitative and quantitative information. Our in-house database includes market data for various industry and domains. These data are updated on regular basis as per the changing market scenario. Our library includes, historic databases, internal audit reports and archives.
Sometimes there are instances where there is no metadata or raw data available for any domain specific market. For those cases, we use our expertise to forecast and estimate the market size in order to generate comprehensive data sets. Our analyst team adopt a robust research technique in order to produce the estimates:
Data Synthesis: This stage involves the analysis & mapping of all the information obtained from the previous step. It also involves in scrutinizing the data for any discrepancy observed while data gathering related to the market. The data is collected with consideration to the heterogeneity of sources. Robust scientific techniques are in place for synthesizing disparate data sets and provide the essential contextual information that can orient market strategies. The Brainy Insights has extensive experience in data synthesis where the data passes through various stages:


Market Deduction & Formulation: The final stage comprises of assigning data points at appropriate market spaces so as to deduce feasible conclusions. Analyst perspective & subject matter expert based holistic form of market sizing coupled with industry analysis also plays a crucial role in this stage.
This stage involves in finalization of the market size and numbers that we have collected from data integration step. With data interpolation, it is made sure that there is no gap in the market data. Successful trend analysis is done by our analysts using extrapolation techniques, which provide the best possible forecasts for the market.
Data Validation & Market Feedback: Validation is the most important step in the process. Validation & re-validation via an intricately designed process helps us finalize data-points to be used for final calculations.

The Brainy Insights interacts with leading companies and experts of the concerned domain to develop the analyst team’s market understanding and expertise. It improves and substantiates every single data presented in the market reports. The data validation interview and discussion panels are typically composed of the most experienced industry members. The participants include, however, are not limited to:
Moreover, we always validate our data and findings through primary respondents from all the major regions we are working on.


Free Customization
Fortune 500 Clients
Free Yearly Update On Purchase Of Multi/Corporate License
Companies Served Till Date