- +1-315-215-1633
- sales@thebrainyinsights.com

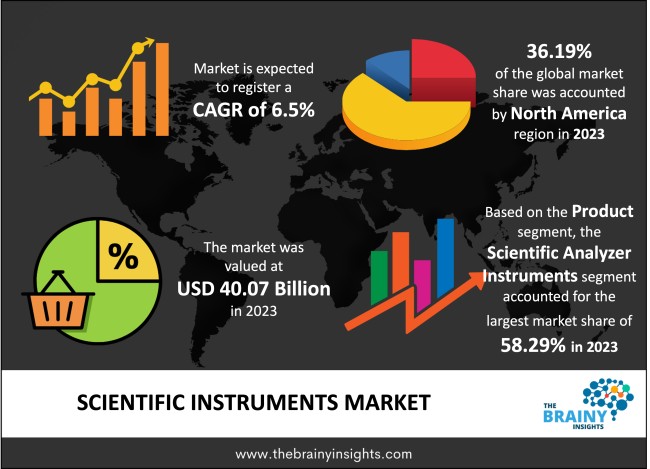
The global scientific instruments market is expected to grow from USD 40.07 billion in 2023 to USD 75.21 billion by 2033, at a CAGR of 6.5% during the forecast period 2024-2033. North America dominated the market in 2023. Accuracy can be achieved with the help of scientific instruments. These instruments use advanced technologies such as artificial machine learning and intelligence. This makes their accuracy higher than that of ordinary instruments, and there are no errors due to the technology.
Scientific instruments are gadgets used for scientific purposes that are for measuring, indicating, and recording physical values. Scientific instruments are used for numerous applications for measuring temperature, direction, pressure, speed, etc. These instruments are essential in laboratory applications. Scientific instruments are considered more advanced and specialized than substitute devices like thermometers, metre sticks, scales, chronometers, etc. They are used for improving the control of experiments and simplifying operations. Scientific equipment comes in wide varieties and is employed in various ways. They are utilized for both natural occurrences and theoretical inquiry. By enabling scientists to gather precise data and observe invisible phenomena to the naked eye, scientific instruments are crucial to advancing scientific research capabilities. Scientific Instruments are also used in schools and colleges to teach students practical skills. This gives students a chance to see theoretical knowledge being applied practically, to operate the instrument, and to learn its details, which they can use in the future.
Get an overview of this study by requesting a free sample
Increasing use in research studies: There are growing research projects in fields like drug development, treatment discovery, etc. These research studies require the use of pure materials without the presence of any containment. The concerned parties install hugely on the research projects, which raises the stakes on the outcome. Further, the experiments without any failure help in cost-cutting and even enables consistent lab results. Thus, various research organizations gradually realize the benefits of scientific instruments for deriving successful results. The deployment of manual labour can lead to high costs, which will hamper the productivity of the research centre in the long run. However, these costs can be saved using different scientific instruments; that adhere to the application's requirements.
Maintenance and sanitization requirements– Scientific instruments are used in many crucial applications. These scientific instruments require regular maintenance to operate efficiently. Sanitization of scientific instruments is necessary for eliminating the probability of cross infections. Due to high maintenance requirements, the market growth for scientific instruments is hampered.
Rising investment in life science research and development activities– Government agencies have increased pharmaceutical research and development spending. The life science research and development expenditure has improved by leaps and bounds due to several factors such as progressing drug discovery field, demand for clinical diagnostics, emerging applications, growing ageing populations and rising prevalence of chronic diseases. Numerous industry participants reported record sales of scientific instruments, primarily driven by robust growth in emerging countries such as China, India, and many others. Advances have aided the development of the biotechnology industry in life science research and technology innovations such as human genome mapping and the emergence of proteomics. As a result, high-end research projects require quality instruments with high throughput capacity, further fuelling the scientific instruments market.
Stringent regulations for product approval– Scientific instruments are used in clinical, diagnostics and research applications. These instruments must pass strict regulations of concerned agencies and efficiently handle product applications. These instruments should adhere to the given regulations to be launched in the market.
The regions analyzed for the market include North America, Europe, South America, Asia Pacific, the Middle East, and Africa. North America emerged as the most significant global scientific instruments market, with a revenue share of 36.19% in 2023. The region has a high market growth rate due to the growing collaboration among education institutes and manufacturers. Investment in the life science research industry will drive the North American market. The increased focus on research and development of new drugs and therapeutic technologies will lead to higher usage of scientific instruments in clinical and diagnostic applications. The Asia-Pacific region is anticipated to grow lucratively during the forecast period. The increasing investments in research and academic applications will likely provide more growth opportunities to the scientific instruments market in the region.
North America Region Scientific Instruments Market Share in 2023 - 36.19%
www.thebrainyinsights.com
Check the geographical analysis of this market by requesting a free sample
The product segment is divided into scientific analyzers instruments, scientific clinical instruments and others. The scientific analyzer instruments segment dominated the market with a revenue share of 58.29% in 2023. Scientific analyzer instruments are necessary for testing procedures in hospitals and diagnostic centres. Scientific analyzer instruments are effective and help in the identification of materials.
The application segment includes research, clinical and diagnostics. The research segment dominated the market with a revenue share of 42.90% in 2023. Research applications require the use of scientific instruments for various applications such as the collection of samples, preparation of samples, and identification of materials. Without the help of scientific instruments, many researchers cannot conduct a thorough study.
The end-user segment includes research and academic institutes, government institutes, hospital and clinics, and pharmaceutical and biotechnology companies. The hospital and clinic segment dominated the market with a revenue share of 31.02% in 2023. Hospitals and clinics have higher usage of scientific instruments, especially during surgeries. The increasing number of patients visiting hospitals and clinics leads to higher demand for scientific instruments.
| Attribute | Description |
|---|---|
| Market Size | Revenue (USD Billion) |
| Market size value in 2023 | USD 40.07 Billion |
| Market size value in 2033 | USD 75.21 Billion |
| CAGR (2024 to 2033) | 6.5% |
| Historical data | 2020-2022 |
| Base Year | 2023 |
| Forecast | 2024-2033 |
| Region | The regions examined for the market are Europe, Asia Pacific, North America, South America, and Middle East & Africa. |
| Segments | The research segment is based on product, application, and end-user. |
As per The Brainy Insights, the size of the scientific instruments market was valued USD 40.07 billion in 2023 to USD 75.21 billion by 2033.
Global scientific instruments market is growing at a CAGR of 6.5% during the forecast period 2024-2033.
North America region emerged as the largest market for the scientific instruments.
The market's growth will be influenced by the growing usage of scientific instruments in research applications.
The high cost could hamper the market growth.
The increasing investment in life science research and development activities is providing huge opportunities to the market.
1. Introduction
1.1. Objectives of the Study
1.2. Market Definition
1.3. Research Scope
1.4. Currency
1.5. Key Target Audience
2. Research Methodology and Assumptions
3. Executive Summary
4. Premium Insights
4.1. Porter’s Five Forces Analysis
4.2. Value Chain Analysis
4.3. Top Investment Pockets
4.3.1. Market Attractiveness Analysis By Product
4.3.2. Market Attractiveness Analysis By Application
4.3.3. Market Attractiveness Analysis By End-user
4.3.4. Market Attractiveness Analysis By Region
4.4. Industry Trends
5. Market Dynamics
5.1. Market Evaluation
5.2. Drivers
5.2.1. Increasing uses of scientific instruments in different applications
5.3. Restraints
5.3.1. Compliance issues
5.4. Opportunities
5.4.1. Increasing investment in life-science research industry
5.5. Challenges
5.5.1. Stringent regulations for product approval
6. Global Scientific Instruments Market Analysis and Forecast, By Product
6.1. Segment Overview
6.2. Scientific Analyzers Instruments
6.3. Scientific Clinical Instruments
6.4. Others
7. Global Scientific Instruments Market Analysis and Forecast, By Application
7.1. Segment Overview
7.2. Research
7.3. Clinical
7.4. Diagnostics
8. Global Scientific Instruments Market Analysis and Forecast, By End-user
8.1. Segment Overview
8.2. Research and Academic Institutes
8.3. Government Institutes
8.4. Hospitals and Clinics
8.5. Pharmaceutical and Biotechnology Companies
9. Global Scientific Instruments Market Analysis and Forecast, By Regional Analysis
9.1. Segment Overview
9.2. North America
9.2.1. U.S.
9.2.2. Canada
9.2.3. Mexico
9.3. Europe
9.3.1. Germany
9.3.2. France
9.3.3. U.K.
9.3.4. Italy
9.3.5. Spain
9.4. Asia-Pacific
9.4.1. Japan
9.4.2. China
9.4.3. India
9.5. South America
9.5.1. Brazil
9.6. Middle East and Africa
9.6.1. UAE
9.6.2. South Africa
10. Global Scientific Instruments Market-Competitive Landscape
10.1. Overview
10.2. Market Share of Key Players in the Scientific Instruments Market
10.2.1. Global Company Market Share
10.2.2. North America Company Market Share
10.2.3. Europe Company Market Share
10.2.4. APAC Company Market Share
10.3. Competitive Situations and Trends
10.3.1. Product Launches and Developments
10.3.2. Partnerships, Collaborations, and Agreements
10.3.3. Mergers & Acquisitions
10.3.4. Expansions
11. Company Profiles
11.1. Agilent Technologies, Inc.
11.1.1. Business Overview
11.1.2. Company Snapshot
11.1.3. Company Market Share Analysis
11.1.4. Company Product Portfolio
11.1.5. Recent Developments
11.1.6. SWOT Analysis
11.2. Thermo Fisher Scientific
11.2.1. Business Overview
11.2.2. Company Snapshot
11.2.3. Company Market Share Analysis
11.2.4. Company Product Portfolio
11.2.5. Recent Developments
11.2.6. SWOT Analysis
11.3. Merck KGaA
11.3.1. Business Overview
11.3.2. Company Snapshot
11.3.3. Company Market Share Analysis
11.3.4. Company Product Portfolio
11.3.5. Recent Developments
11.3.6. SWOT Analysis
11.4. PerkinElmer Inc.
11.4.1. Business Overview
11.4.2. Company Snapshot
11.4.3. Company Market Share Analysis
11.4.4. Company Product Portfolio
11.4.5. Recent Developments
11.4.6. SWOT Analysis
11.5. Bruker Corporation
11.5.1. Business Overview
11.5.2. Company Snapshot
11.5.3. Company Market Share Analysis
11.5.4. Company Product Portfolio
11.5.5. Recent Developments
11.5.6. SWOT Analysis
11.6. Shimadzu Corporation
11.6.1. Business Overview
11.6.2. Company Snapshot
11.6.3. Company Market Share Analysis
11.6.4. Company Product Portfolio
11.6.5. Recent Developments
11.6.6. SWOT Analysis
11.7. Danaher Corporation
11.7.1. Business Overview
11.7.2. Company Snapshot
11.7.3. Company Market Share Analysis
11.7.4. Company Product Portfolio
11.7.5. Recent Developments
11.7.6. SWOT Analysis
11.8. Waters
1.1.1. Business Overview
1.1.2. Company Snapshot
1.1.3. Company Market Share Analysis
1.1.4. Company Product Portfolio
1.1.5. Recent Developments
1.1.6. SWOT Analysis
11.9. Zeiss International
11.9.1. Business Overview
11.9.2. Company Snapshot
11.9.3. Company Market Share Analysis
11.9.4. Company Product Portfolio
11.9.5. Recent Developments
11.9.6. SWOT Analysis
11.10. F. Hoffmann-La Roche Ltd.
11.10.1. Business Overview
11.10.2. Company Snapshot
11.10.3. Company Market Share Analysis
11.10.4. Company Product Portfolio
11.10.5. Recent Developments
11.10.6. SWOT Analysis
11.11. Mettler Toledo.
11.11.1. Business Overview
11.11.2. Company Snapshot
11.11.3. Company Market Share Analysis
11.11.4. Company Product Portfolio
11.11.5. Recent Developments
11.11.6. SWOT Analysis
11.12. Promega Corporation
11.12.1. Business Overview
11.12.2. Company Snapshot
11.12.3. Company Market Share Analysis
11.12.4. Company Product Portfolio
11.12.5. Recent Developments
11.12.6. SWOT Analysis
11.13. Agilent Technologies, Inc.
11.13.1. Business Overview
11.13.2. Company Snapshot
11.13.3. Company Market Share Analysis
11.13.4. Company Product Portfolio
11.13.5. Recent Developments
11.13.6. SWOT Analysis
11.14. Lonza
11.14.1. Business Overview
11.14.2. Company Snapshot
11.14.3. Company Market Share Analysis
11.14.4. Company Product Portfolio
11.14.5. Recent Developments
11.14.6. SWOT Analysis
11.15. Danaher
11.15.1. Business Overview
11.15.2. Company Snapshot
11.15.3. Company Market Share Analysis
11.15.4. Company Product Portfolio
11.15.5. Recent Developments
11.15.6. SWOT Analysis
11.16. Geno Technology, Inc.
11.16.1. Business Overview
11.16.2. Company Snapshot
11.16.3. Company Market Share Analysis
11.16.4. Company Product Portfolio
11.16.5. Recent Developments
11.16.6. SWOT Analysis
11.17. BioThema AB
11.17.1. Business Overview
11.17.2. Company Snapshot
11.17.3. Company Market Share Analysis
11.17.4. Company Product Portfolio
11.17.5. Recent Developments
11.17.6. SWOT Analysis
List of Table
1. Global Scientific Instruments Market, By Product, 2020-2033 (USD Billion)
2. Global Scientific Analyzers Instruments, Scientific Instruments Market, By Region, 2020-2033 (USD Billion)
3. Global Scientific Clinical Instruments, Scientific Instruments Market, By Region, 2020-2033 (USD Billion)
4. Global Others, Scientific Instruments Market, By Region, 2020-2033 (USD Billion)
5. Global Scientific Instruments Market, By Application, 2020-2033 (USD Billion)
6. Global Research, Scientific Instruments Market, By Region, 2020-2033 (USD Billion)
7. Global Clinical, Scientific Instruments Market, By Region, 2020-2033 (USD Billion)
8. Global Diagnostics, Scientific Instruments Market, By Region, 2020-2033 (USD Billion)
9. Global Scientific Instruments Market, By End-user, 2020-2033 (USD Billion)
10. Global Research and Academic Institutes, Scientific Instruments Market, By Region, 2020-2033 (USD Billion)
11. Global Government Institutes, Scientific Instruments Market, By Region, 2020-2033 (USD Billion)
12. Global Hospitals and Clinics, Scientific Instruments Market, By Region, 2020-2033 (USD Billion)
13. Global Pharmaceutical and Biotechnology Companies, Scientific Instruments Market, By Region, 2020-2033 (USD Billion)
14. Global Scientific Instruments Market, By Region, 2020-2033 (USD Billion)
15. North America Scientific Instruments Market, By Product, 2020-2033 (USD Billion)
16. North America Scientific Instruments Market, By Application, 2020-2033 (USD Billion)
17. North America Scientific Instruments Market, By End-user, 2020-2033 (USD Billion)
18. U.S. Scientific Instruments Market, By Product, 2020-2033 (USD Billion)
19. U.S. Scientific Instruments Market, By Application, 2020-2033 (USD Billion)
20. U.S. Scientific Instruments Market, By End-user, 2020-2033 (USD Billion)
21. Canada Scientific Instruments Market, By Product, 2020-2033 (USD Billion)
22. Canada Scientific Instruments Market, By Application, 2020-2033 (USD Billion)
23. Canada Scientific Instruments Market, By End-user, 2020-2033 (USD Billion)
24. Mexico Scientific Instruments Market, By Product, 2020-2033 (USD Billion)
25. Mexico Scientific Instruments Market, By Application, 2020-2033 (USD Billion)
26. Mexico Scientific Instruments Market, By End-user, 2020-2033 (USD Billion)
27. Europe Scientific Instruments Market, By Product, 2020-2033 (USD Billion)
28. Europe Scientific Instruments Market, By Application, 2020-2033 (USD Billion)
29. Europe Scientific Instruments Market, By End-user, 2020-2033 (USD Billion)
30. Germany Scientific Instruments Market, By Product, 2020-2033 (USD Billion)
31. Germany Scientific Instruments Market, By Application, 2020-2033 (USD Billion)
32. Germany Scientific Instruments Market, By End-user, 2020-2033 (USD Billion)
33. France Scientific Instruments Market, By Product, 2020-2033 (USD Billion)
34. France Scientific Instruments Market, By Application, 2020-2033 (USD Billion)
35. France Scientific Instruments Market, By End-user, 2020-2033 (USD Billion)
36. U.K. Scientific Instruments Market, By Product, 2020-2033 (USD Billion)
37. U.K. Scientific Instruments Market, By Application, 2020-2033 (USD Billion)
38. U.K. Scientific Instruments Market, By End-user, 2020-2033 (USD Billion)
39. Italy Scientific Instruments Market, By Product, 2020-2033 (USD Billion)
40. Italy Scientific Instruments Market, By Application, 2020-2033 (USD Billion)
41. Italy Scientific Instruments Market, By End-user, 2020-2033 (USD Billion)
42. Spain Scientific Instruments Market, By Product, 2020-2033 (USD Billion)
43. Spain Scientific Instruments Market, By Application, 2020-2033 (USD Billion)
44. Spain Scientific Instruments Market, By End-user, 2020-2033 (USD Billion)
45. Asia Pacific Scientific Instruments Market, By Product, 2020-2033 (USD Billion)
46. Asia Pacific Scientific Instruments Market, By Application, 2020-2033 (USD Billion)
47. Asia Pacific Scientific Instruments Market, By End-user, 2020-2033 (USD Billion)
48. Japan Scientific Instruments Market, By Product, 2020-2033 (USD Billion)
49. Japan Scientific Instruments Market, By Application, 2020-2033 (USD Billion)
50. Japan Scientific Instruments Market, By End-user, 2020-2033 (USD Billion)
51. China Scientific Instruments Market, By Product, 2020-2033 (USD Billion)
52. China Scientific Instruments Market, By Application, 2020-2033 (USD Billion)
53. China Scientific Instruments Market, By End-user, 2020-2033 (USD Billion)
54. India Scientific Instruments Market, By Product, 2020-2033 (USD Billion)
55. India Scientific Instruments Market, By Application, 2020-2033 (USD Billion)
56. India Scientific Instruments Market, By End-user, 2020-2033 (USD Billion)
57. South America Scientific Instruments Market, By Product, 2020-2033 (USD Billion)
58. South America Scientific Instruments Market, By Application, 2020-2033 (USD Billion)
59. South America Scientific Instruments Market, By End-user, 2020-2033 (USD Billion)
60. Brazil Scientific Instruments Market, By Product, 2020-2033 (USD Billion)
61. Brazil Scientific Instruments Market, By Application, 2020-2033 (USD Billion)
62. Brazil Scientific Instruments Market, By End-user, 2020-2033 (USD Billion)
63. Middle East and Africa Scientific Instruments Market, By Product, 2020-2033 (USD Billion)
64. Middle East and Africa Scientific Instruments Market, By Application, 2020-2033 (USD Billion)
65. Middle East and Africa Scientific Instruments Market, By End-user, 2020-2033 (USD Billion)
66. UAE Scientific Instruments Market, By Product, 2020-2033 (USD Billion)
67. UAE Scientific Instruments Market, By Application, 2020-2033 (USD Billion)
68. UAE Scientific Instruments Market, By End-user, 2020-2033 (USD Billion)
69. South Africa Scientific Instruments Market, By Product, 2020-2033 (USD Billion)
70. South Africa Scientific Instruments Market, By Application, 2020-2033 (USD Billion)
71. South Africa Scientific Instruments Market, By End-user, 2020-2033 (USD Billion)
List of Figures
1. Global Scientific Instruments Market Segmentation
2. Scientific Instruments Market: Research Methodology
3. Market Size Estimation Methodology: Bottom-Up Approach
4. Market Size Estimation Methodology: Top-Down Approach
5. Data Triangulation
6. Porter’s Five Forces Analysis
7. Value Chain Analysis
8. Global Scientific Instruments Market Attractiveness Analysis By Product
9. Global Scientific Instruments Market Attractiveness Analysis By Application
10. Global Scientific Instruments Market Attractiveness Analysis By End-user
11. Global Scientific Instruments Market Attractiveness Analysis By Region
12. Global Scientific Instruments Market: Dynamics
13. Global Scientific Instruments Market Share by Product (2023 & 2033)
14. Global Scientific Instruments Market Share by Application (2023 & 2033)
15. Global Scientific Instruments Market Share by End-user (2023 & 2033)
16. Global Scientific Instruments Market Share by Regions (2023 & 2033)
17. Global Scientific Instruments Market Share by Company (2023)
This study forecasts revenue at global, regional, and country levels from 2020 to 2033. The Brainy Insights has segmented the global scientific instruments market based on below mentioned segments:
Global Scientific Instruments Market by Product:
Global Scientific Instruments Market by Application:
Global Scientific Instruments Market by End-user:
Global Scientific instruments Market by Region:
Research has its special purpose to undertake marketing efficiently. In this competitive scenario, businesses need information across all industry verticals; the information about customer wants, market demand, competition, industry trends, distribution channels etc. This information needs to be updated regularly because businesses operate in a dynamic environment. Our organization, The Brainy Insights incorporates scientific and systematic research procedures in order to get proper market insights and industry analysis for overall business success. The analysis consists of studying the market from a miniscule level wherein we implement statistical tools which helps us in examining the data with accuracy and precision.
Our research reports feature both; quantitative and qualitative aspects for any market. Qualitative information for any market research process are fundamental because they reveal the customer needs and wants, usage and consumption for any product/service related to a specific industry. This in turn aids the marketers/investors in knowing certain perceptions of the customers. Qualitative research can enlighten about the different product concepts and designs along with unique service offering that in turn, helps define marketing problems and generate opportunities. On the other hand, quantitative research engages with the data collection process through interviews, e-mail interactions, surveys and pilot studies. Quantitative aspects for the market research are useful to validate the hypotheses generated during qualitative research method, explore empirical patterns in the data with the help of statistical tools, and finally make the market estimations.
The Brainy Insights offers comprehensive research and analysis, based on a wide assortment of factual insights gained through interviews with CXOs and global experts and secondary data from reliable sources. Our analysts and industry specialist assume vital roles in building up statistical tools and analysis models, which are used to analyse the data and arrive at accurate insights with exceedingly informative research discoveries. The data provided by our organization have proven precious to a diverse range of companies, facilitating them to address issues such as determining which products/services are the most appealing, whether or not customers use the product in the manner anticipated, the purchasing intentions of the market and many others.
Our research methodology encompasses an idyllic combination of primary and secondary initiatives. Key phases involved in this process are listed below:

The phase involves the gathering and collecting of market data and its related information with the help of different sources & research procedures.

The data procurement stage involves in data gathering and collecting through various data sources.
This stage involves in extensive research. These data sources includes:
Purchased Database: Purchased databases play a crucial role in estimating the market sizes irrespective of the domain. Our purchased database includes:
Primary Research: The Brainy Insights interacts with leading companies and experts of the concerned domain to develop the analyst team’s market understanding and expertise. It improves and substantiates every single data presented in the market reports. Primary research mainly involves in telephonic interviews, E-mail interactions and face-to-face interviews with the raw material providers, manufacturers/producers, distributors, & independent consultants. The interviews that we conduct provides valuable data on market size and industry growth trends prevailing in the market. Our organization also conducts surveys with the various industry experts in order to gain overall insights of the industry/market. For instance, in healthcare industry we conduct surveys with the pharmacists, doctors, surgeons and nurses in order to gain insights and key information of a medical product/device/equipment which the customers are going to usage. Surveys are conducted in the form of questionnaire designed by our own analyst team. Surveys plays an important role in primary research because surveys helps us to identify the key target audiences of the market. Additionally, surveys helps to identify the key target audience engaged with the market. Our survey team conducts the survey by targeting the key audience, thus gaining insights from them. Based on the perspectives of the customers, this information is utilized to formulate market strategies. Moreover, market surveys helps us to understand the current competitive situation of the industry. To be precise, our survey process typically involve with the 360 analysis of the market. This analytical process begins by identifying the prospective customers for a product or service related to the market/industry to obtain data on how a product/service could fit into customers’ lives.

Secondary Research: The secondary data sources includes information published by the on-profit organizations such as World bank, WHO, company fillings, investor presentations, annual reports, national government documents, statistical databases, blogs, articles, white papers and others. From the annual report, we analyse a company’s revenue to understand the key segment and market share of that organization in a particular region. We analyse the company websites and adopt the product mapping technique which is important for deriving the segment revenue. In the product mapping method, we select and categorize the products offered by the companies catering to domain specific market, deduce the product revenue for each of the companies so as to get overall estimation of the market size. We also source data and analyses trends based on information received from supply side and demand side intermediaries in the value chain. The supply side denotes the data gathered from supplier, distributor, wholesaler and the demand side illustrates the data gathered from the end customers for respective market domain.

The supply side for a domain specific market is analysed by:
The demand side for the market is estimated through:
In-house Library: Apart from these third-party sources, we have our in-house library of qualitative and quantitative information. Our in-house database includes market data for various industry and domains. These data are updated on regular basis as per the changing market scenario. Our library includes, historic databases, internal audit reports and archives.
Sometimes there are instances where there is no metadata or raw data available for any domain specific market. For those cases, we use our expertise to forecast and estimate the market size in order to generate comprehensive data sets. Our analyst team adopt a robust research technique in order to produce the estimates:
Data Synthesis: This stage involves the analysis & mapping of all the information obtained from the previous step. It also involves in scrutinizing the data for any discrepancy observed while data gathering related to the market. The data is collected with consideration to the heterogeneity of sources. Robust scientific techniques are in place for synthesizing disparate data sets and provide the essential contextual information that can orient market strategies. The Brainy Insights has extensive experience in data synthesis where the data passes through various stages:


Market Deduction & Formulation: The final stage comprises of assigning data points at appropriate market spaces so as to deduce feasible conclusions. Analyst perspective & subject matter expert based holistic form of market sizing coupled with industry analysis also plays a crucial role in this stage.
This stage involves in finalization of the market size and numbers that we have collected from data integration step. With data interpolation, it is made sure that there is no gap in the market data. Successful trend analysis is done by our analysts using extrapolation techniques, which provide the best possible forecasts for the market.
Data Validation & Market Feedback: Validation is the most important step in the process. Validation & re-validation via an intricately designed process helps us finalize data-points to be used for final calculations.

The Brainy Insights interacts with leading companies and experts of the concerned domain to develop the analyst team’s market understanding and expertise. It improves and substantiates every single data presented in the market reports. The data validation interview and discussion panels are typically composed of the most experienced industry members. The participants include, however, are not limited to:
Moreover, we always validate our data and findings through primary respondents from all the major regions we are working on.


Free Customization
Fortune 500 Clients
Free Yearly Update On Purchase Of Multi/Corporate License
Companies Served Till Date