- +1-315-215-1633
- sales@thebrainyinsights.com

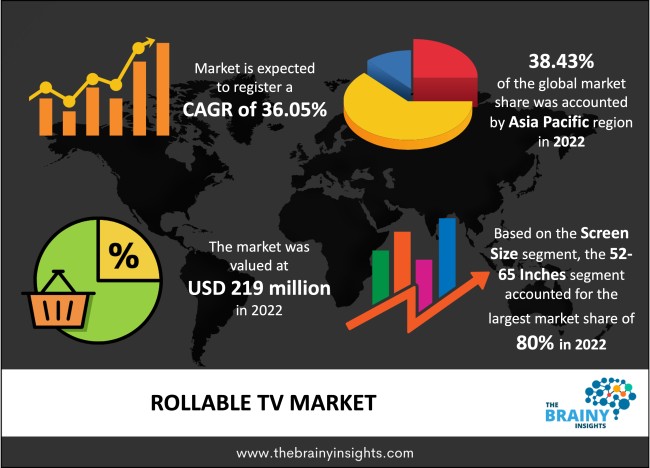
The global rollable TV market was valued at USD 219 million in 2022 and growing at a CAGR of 36.05% from 2023 to 2032. The market is expected to reach USD 4,758.06 million by 2032. Rollable TVs are considered niche premium products. It has become the ideal combination of technology and design innovation which will contribute to its significant growth soon. The organizations manufacturing rollable TVs offer many services and features; for instance, LG Signature OLED R TV allows the user to play with many different screen sizes and aspects. Also, it is available in many colours like moon gray, signature black, topaz blue and toffee brown to attract customers. Moreover, the organization provides 3 years of extended service and sends technicians twice a year to inspect the working of the TV. LG would also send technicians to help in installing the TV. These factors would attract customers to flourish in the market.
The growing use of OLED-based devices broadly drives the rollable TV. Based on one of the articles of March 2023, there will be 29 models in the LG OLED TV lineup, which consists of wireless TVs and rollable screens. There is also an advancement in technology, which is leading to the development of energy-efficient, high-specification, attractive, flexible display products, propelling the growth of the market. Rollable TVs have high prices, so it is likely to start as a small niche market and complement the interior design. This TV can be hidden by rolling it. This is also getting used as its main selling point, as it disappears when there is no need to see it. Moreover, the rollable TV can be incorporated with any piece of furniture, from beds to worktops, and it does not take up too much space. This type of technology would allow very large displays without being intrusive. OLED use for premium TVs like rollable TVs would grow as luxury OLED models are proving to be more profitable than liquid crystal display (LCD) TVs as they have higher retail prices. As this market generally targets the sophisticated consumer as it is a luxury niche product, the manufacturers highlight the certifications they have taken to attract consumers’ attention. For instance, LG Signature OLED R uses an OLED panel approved by Swiss-based Societe Generale de Surveillance (SGS) to show that it decreases the use of hazardous substances, produces fewer air pollutants, and is easy to recycle. Also, this TV uses the planet’s first Eyesafe-certified TV panels, which meet the low blue light emission condition of US-based Eyesafe, and it is also rated positively by TUV Rheinland and Underwriters Laboratories.
Get an overview of this study by requesting a free sample
Groundbreaking technology- Rollable TVs are predicted to change the TV industry. It is presently targeting the more sophisticated, luxurious customer. For instance, LG launched its first rollable TV in late 2020 in South Korea. Its upgraded version started getting sold internationally to 15 countries in 2021. They are the UK, USA, Switzerland, Spain, Saudi Arabia, UAE, Nigeria, Belgium, Australia, Israel, France, Germany, Russia, Netherlands and Italy. The organization believes this will be the turning point in TV history. This groundbreaking technology will revolutionize the way one uses space. As the market is expensive, the leading organizations are moving slowly and launching in the market where they feel they will get good reception. Moreover, OLED technology is attracting a significant market share in the display market. All these factors are driving the growth of the rollable TV market.
High-Cost- A rollable TV is very costly, which is attributed to the fact that the manufacturing process of rollable TV works is not completely automated. Hence, it requires an actual workforce. This type of TV is not easy to manufacture. Moreover, its price in the UK is 99,999 GBP which is around 30% high than in Korea. In the US, its price is USD 99,999, makes around 13% higher than in Korea. Also, it is built for luxury home spaces and retail/office outlets. All these factors act as a restraint for the market.
Demand from the opulent society- The expensive range of rollable TVs gives customers a good choice for redefining their lifestyle, which could help make a bold statement. Moreover, it provides excellent picture quality in a way that gives an immersive experience in everything from sports to movies to gaming. As the market is at the initial stage, many new additions would be added based on the experience; this will help in expanding the market. For instance, LG has come with only 65-inch big rollable TV, but there is an expectation that organizations with come up with larger sizes. All these factors would drive the rollable TV market in the forecasting period.
The regions analyzed for the market include North America, Europe, South America, Asia Pacific, the Middle East, and Africa. Asia Pacific emerged as the largest market for the global rollable TV market, with a 38.43% share of the market revenue in 2022.
The Asia-Pacific region will account for the largest market share with revenue growth. As rollable tv is a niche premium product, the organizations are moving slowly and planning to launch in a market which can offer them a good opening. For instance, Asian countries like China and Japan etc. are generally more open to new formats. For instance, LG’s rollable TV was first introduced in South Korea, and a year later, it was introduced to the country like US and UK along with other European countries.
Asia Pacific Region Rollable TV Market Share in 2022 - 38.43%
www.thebrainyinsights.com
Check the geographical analysis of this market by requesting a free sample
The technology segment is divided into Oled, E-Paper Display, Quantum Dot Led and Led-Backlit LCD. The Oled segment dominated the market, with a market share of around 87% in 2022. This factor is attributed to the fact that the OLED market is growing rapidly. Also, LCD panel price is increasing rapidly, which has narrowed the price gap between LCD panels and OLED displays. OLED price is decreasing due to an increase in the supply.
The screen size segment is divided into below 52 inches, 52- 65 inches and above 65 inches. The 52- 65 inches segment dominated the market, with a market share of around 80% in 2022. This factor is because most products launched by organizations and preferred by the consumer fall under this category. Moreover, a leading organization like LG developed its first rollable TV of size 65 inches. Also, based on one of the studies, most of the OLED advanced TV was sold in size 55 inches and 65 inches. OLED is broadly used in the making of rollable TVs.
| Attribute | Description |
|---|---|
| Market Size | Revenue (USD Billion) |
| Market size value in 2022 | USD 219 Million |
| Market size value in 2032 | USD 4,758.06 Million |
| CAGR (2023 to 2032) | 36.05% |
| Historical data | 2019-2021 |
| Base Year | 2022 |
| Forecast | 2023-2032 |
| Regional Segments | The regions analyzed for the market are Asia Pacific, Europe, South America, North America, and Middle East & Africa. Furthermore, the regions are further analyzed at the country level. |
| Segments | Technology, Screen Size |
Asia Pacific region emerged as the largest market for the Rollable TV.
The market's growth will be influenced by the ground-breaking technology and growing use of OLED-based devices.
High prices could hamper the market growth.
Demand from the opulent society will provide huge opportunities to the market.
1. Introduction
1.1. Objectives of the Study
1.2. Market Definition
1.3. Research Scope
1.4. Currency
1.5. Key Target Audience
2. Research Methodology and Assumptions
3. Executive Summary
4. Premium Insights
4.1. Porter’s Five Forces Analysis
4.2. Value Chain Analysis
4.3. Top Investment Pockets
4.3.1. Market Attractiveness Analysis By Technology
4.3.2. Market Attractiveness Analysis By Screen Size
4.3.3. Market Attractiveness Analysis By Region
4.4. Industry Trends
5. Market Dynamics
5.1. Market Evaluation
5.2. Drivers
5.2.1. Ground breaking technology
5.3. Restraints
5.3.1. High prices
5.4. Opportunities
5.4.1. Demand from opulent society
5.5. Challenges
5.5.1. Economic slowdown
6. Global Rollable TV Market Analysis and Forecast, By Technology
6.1. Segment Overview
6.2. Oled
6.3. E-Paper Display
6.4. Quantum Dot Led
6.5. Led-Backlit LCD
7. Global Rollable TV Market Analysis and Forecast, By Screen Size
7.1. Segment Overview
7.2. Below 52 inches
7.3. 52- 65 Inches
7.4. Above 65 inches
8. Global Rollable TV Market Analysis and Forecast, By Regional Analysis
8.1. Segment Overview
8.2. North America
8.2.1. U.S.
8.2.2. Canada
8.2.3. Mexico
8.3. Europe
8.3.1. Germany
8.3.2. France
8.3.3. U.K.
8.3.4. Italy
8.3.5. Spain
8.4. Asia-Pacific
8.4.1. Japan
8.4.2. China
8.4.3. India
8.5. South America
8.5.1. Brazil
8.6. Middle East and Africa
8.6.1. UAE
8.6.2. South Africa
9. Global Rollable TV Market-Competitive Landscape
9.1. Overview
9.2. Market Share of Key Players in Global Rollable TV Market
9.2.1. Global Company Market Share
9.2.2. North America Company Market Share
9.2.3. Europe Company Market Share
9.2.4. APAC Company Market Share
9.3. Competitive Situations and Trends
9.3.1. Product Launches and Developments
9.3.2. Partnerships, Collaborations, and Agreements
9.3.3. Mergers & Acquisitions
9.3.4. Expansions
10. Company Profiles
10.1. LG Display Co., Ltd.
10.1.1. Business Overview
10.1.2. Company Snapshot
10.1.3. Company Market Share Analysis
10.1.4. Company Product Portfolio
10.1.5. Recent Developments
10.1.6. SWOT Analysis
10.2. Samsung Electronics Co., Ltd.
10.2.1. Business Overview
10.2.2. Company Snapshot
10.2.3. Company Market Share Analysis
10.2.4. Company Product Portfolio
10.2.5. Recent Developments
10.2.6. SWOT Analysis
10.3. E. I. Du Pont De Nemours and Company
10.3.1. Business Overview
10.3.2. Company Snapshot
10.3.3. Company Market Share Analysis
10.3.4. Company Product Portfolio
10.3.5. Recent Developments
10.3.6. SWOT Analysis
10.4. AU Optronics Corp.
10.4.1. Business Overview
10.4.2. Company Snapshot
10.4.3. Company Market Share Analysis
10.4.4. Company Product Portfolio
10.4.5. Recent Developments
10.4.6. SWOT Analysis
10.5. Sharp Corp. (Foxconn)
10.5.1. Business Overview
10.5.2. Company Snapshot
10.5.3. Company Market Share Analysis
10.5.4. Company Product Portfolio
10.5.5. Recent Developments
10.5.6. SWOT Analysis
10.6. Visionox Corporation
10.6.1. Business Overview
10.6.2. Company Snapshot
10.6.3. Company Market Share Analysis
10.6.4. Company Product Portfolio
10.6.5. Recent Developments
10.6.6. SWOT Analysis
10.7. BOE Technology Group Co., Ltd.
10.7.1. Business Overview
10.7.2. Company Snapshot
10.7.3. Company Market Share Analysis
10.7.4. Company Product Portfolio
10.7.5. Recent Developments
10.7.6. SWOT Analysis
10.8. Innolux Corp.
10.8.1. Business Overview
10.8.2. Company Snapshot
10.8.3. Company Market Share Analysis
10.8.4. Company Product Portfolio
10.8.5. Recent Developments
10.8.6. SWOT Analysis
10.9. Ink Holdings, Inc.
10.9.1. Business Overview
10.9.2. Company Snapshot
10.9.3. Company Market Share Analysis
10.9.4. Company Product Portfolio
10.9.5. Recent Developments
10.9.6. SWOT Analysis
10.10. Japan Display Inc.
10.10.1. Business Overview
10.10.2. Company Snapshot
10.10.3. Company Market Share Analysis
10.10.4. Company Product Portfolio
10.10.5. Recent Developments
10.10.6. SWOT Analysis
10.11. Corning Incorporated
10.11.1. Business Overview
10.11.2. Company Snapshot
10.11.3. Company Market Share Analysis
10.11.4. Company Product Portfolio
10.11.5. Recent Developments
10.11.6. SWOT Analysis
List of Table
1. Global Rollable TV Market, By Technology, 2019-2032 (USD Million)
2. Global Oled, Rollable TV Market, By Region, 2019-2032 (USD Million)
3. Global E-Paper Display, Rollable TV Market, By Region, 2019-2032 (USD Million)
4. Global Quantum Dot Led, Rollable TV Market, By Region, 2019-2032 (USD Million)
5. Global Led-Backlit LCD, Rollable TV Market, By Region, 2019-2032 (USD Million)
6. Global Rollable TV Market, By Screen Size, 2019-2032 (USD Million)
7. Global Below 52 inches, Rollable TV Market, By Region, 2019-2032 (USD Million)
8. Global 52- 65 Inches, Rollable TV Market, By Region, 2019-2032 (USD Million)
9. Global Above 65 inches, Rollable TV Market, By Region, 2019-2032 (USD Million)
10. North America Rollable TV Market, By Technology, 2019-2032 (USD Million)
11. North America Rollable TV Market, By Screen Size, 2019-2032 (USD Million)
12. U.S. Rollable TV Market, By Technology, 2019-2032 (USD Million)
13. U.S. Rollable TV Market, By Screen Size, 2019-2032 (USD Million)
14. Canada Rollable TV Market, By Technology, 2019-2032 (USD Million)
15. Canada Rollable TV Market, By Screen Size, 2019-2032 (USD Million)
16. Mexico Rollable TV Market, By Technology, 2019-2032 (USD Million)
17. Mexico Rollable TV Market, By Screen Size, 2019-2032 (USD Million)
18. Europe Rollable TV Market, By Technology, 2019-2032 (USD Million)
19. Europe Rollable TV Market, By Screen Size, 2019-2032 (USD Million)
20. Germany Rollable TV Market, By Technology, 2019-2032 (USD Million)
21. Germany Rollable TV Market, By Screen Size, 2019-2032 (USD Million)
22. France Rollable TV Market, By Technology, 2019-2032 (USD Million)
23. France Rollable TV Market, By Screen Size, 2019-2032 (USD Million)
24. U.K. Rollable TV Market, By Technology, 2019-2032 (USD Million)
25. U.K. Rollable TV Market, By Screen Size, 2019-2032 (USD Million)
26. Italy Rollable TV Market, By Technology, 2019-2032 (USD Million)
27. Italy Rollable TV Market, By Screen Size, 2019-2032 (USD Million)
28. Spain Rollable TV Market, By Technology, 2019-2032 (USD Million)
29. Spain Rollable TV Market, By Screen Size, 2019-2032 (USD Million)
30. Asia Pacific Rollable TV Market, By Technology, 2019-2032 (USD Million)
31. Asia Pacific Rollable TV Market, By Screen Size, 2019-2032 (USD Million)
32. Japan Rollable TV Market, By Technology, 2019-2032 (USD Million)
33. Japan Rollable TV Market, By Screen Size, 2019-2032 (USD Million)
34. China Rollable TV Market, By Technology, 2019-2032 (USD Million)
35. China Rollable TV Market, By Screen Size, 2019-2032 (USD Million)
36. India Rollable TV Market, By Technology, 2019-2032 (USD Million)
37. India Rollable TV Market, By Screen Size, 2019-2032 (USD Million)
38. South America Rollable TV Market, By Technology, 2019-2032 (USD Million)
39. South America Rollable TV Market, By Screen Size, 2019-2032 (USD Million)
40. Brazil Rollable TV Market, By Technology, 2019-2032 (USD Million)
41. Brazil Rollable TV Market, By Sales Channel, 2019-2032 (USD Million)
42. Middle East and Africa Rollable TV Market, By Technology, 2019-2032 (USD Million)
43. Middle East and Africa Rollable TV Market, By Screen Size, 2019-2032 (USD Million)
44. UAE Rollable TV Market, By Technology, 2019-2032 (USD Million)
45. UAE Rollable TV Market, By Screen Size, 2019-2032 (USD Million)
46. South Africa Rollable TV Market, By Technology, 2019-2032 (USD Million)
47. South Africa Rollable TV Market, By Screen Size, 2019-2032 (USD Million)
List of Figures
1. Global Rollable TV Market Segmentation
2. Global Rollable TV Market: Research Methodology
3. Market Size Estimation Methodology: Bottom-Up Approach
4. Market Size Estimation Methodology: Top-Down Approach
5. Data Triangulation
6. Porter’s Five Forces Analysis
7. Value Chain Analysis
8. Global Rollable TV Market Attractiveness Analysis By Technology
9. Global Rollable TV Market Attractiveness Analysis By Screen Size
10. Global Rollable TV Market Attractiveness Analysis By Region
11. Global Rollable TV Market: Dynamics
12. Global Rollable TV Market Share By Technology (2023 & 2032)
13. Global Rollable TV Market Share By Screen Size (2023 & 2032)
14. Global Rollable TV Market Share By Regions (2023 & 2032)
15. Global Rollable TV Market Share By Company (2022)
This study forecasts revenue at global, regional, and country levels from 2019 to 2032. The Brainy Insights has segmented the global rollable TV market based on below mentioned segments:
Global Rollable TV Market by Technology:
Global Rollable TV Market by Screen Size:
Global Rollable TV by Region:
Research has its special purpose to undertake marketing efficiently. In this competitive scenario, businesses need information across all industry verticals; the information about customer wants, market demand, competition, industry trends, distribution channels etc. This information needs to be updated regularly because businesses operate in a dynamic environment. Our organization, The Brainy Insights incorporates scientific and systematic research procedures in order to get proper market insights and industry analysis for overall business success. The analysis consists of studying the market from a miniscule level wherein we implement statistical tools which helps us in examining the data with accuracy and precision.
Our research reports feature both; quantitative and qualitative aspects for any market. Qualitative information for any market research process are fundamental because they reveal the customer needs and wants, usage and consumption for any product/service related to a specific industry. This in turn aids the marketers/investors in knowing certain perceptions of the customers. Qualitative research can enlighten about the different product concepts and designs along with unique service offering that in turn, helps define marketing problems and generate opportunities. On the other hand, quantitative research engages with the data collection process through interviews, e-mail interactions, surveys and pilot studies. Quantitative aspects for the market research are useful to validate the hypotheses generated during qualitative research method, explore empirical patterns in the data with the help of statistical tools, and finally make the market estimations.
The Brainy Insights offers comprehensive research and analysis, based on a wide assortment of factual insights gained through interviews with CXOs and global experts and secondary data from reliable sources. Our analysts and industry specialist assume vital roles in building up statistical tools and analysis models, which are used to analyse the data and arrive at accurate insights with exceedingly informative research discoveries. The data provided by our organization have proven precious to a diverse range of companies, facilitating them to address issues such as determining which products/services are the most appealing, whether or not customers use the product in the manner anticipated, the purchasing intentions of the market and many others.
Our research methodology encompasses an idyllic combination of primary and secondary initiatives. Key phases involved in this process are listed below:

The phase involves the gathering and collecting of market data and its related information with the help of different sources & research procedures.

The data procurement stage involves in data gathering and collecting through various data sources.
This stage involves in extensive research. These data sources includes:
Purchased Database: Purchased databases play a crucial role in estimating the market sizes irrespective of the domain. Our purchased database includes:
Primary Research: The Brainy Insights interacts with leading companies and experts of the concerned domain to develop the analyst team’s market understanding and expertise. It improves and substantiates every single data presented in the market reports. Primary research mainly involves in telephonic interviews, E-mail interactions and face-to-face interviews with the raw material providers, manufacturers/producers, distributors, & independent consultants. The interviews that we conduct provides valuable data on market size and industry growth trends prevailing in the market. Our organization also conducts surveys with the various industry experts in order to gain overall insights of the industry/market. For instance, in healthcare industry we conduct surveys with the pharmacists, doctors, surgeons and nurses in order to gain insights and key information of a medical product/device/equipment which the customers are going to usage. Surveys are conducted in the form of questionnaire designed by our own analyst team. Surveys plays an important role in primary research because surveys helps us to identify the key target audiences of the market. Additionally, surveys helps to identify the key target audience engaged with the market. Our survey team conducts the survey by targeting the key audience, thus gaining insights from them. Based on the perspectives of the customers, this information is utilized to formulate market strategies. Moreover, market surveys helps us to understand the current competitive situation of the industry. To be precise, our survey process typically involve with the 360 analysis of the market. This analytical process begins by identifying the prospective customers for a product or service related to the market/industry to obtain data on how a product/service could fit into customers’ lives.

Secondary Research: The secondary data sources includes information published by the on-profit organizations such as World bank, WHO, company fillings, investor presentations, annual reports, national government documents, statistical databases, blogs, articles, white papers and others. From the annual report, we analyse a company’s revenue to understand the key segment and market share of that organization in a particular region. We analyse the company websites and adopt the product mapping technique which is important for deriving the segment revenue. In the product mapping method, we select and categorize the products offered by the companies catering to domain specific market, deduce the product revenue for each of the companies so as to get overall estimation of the market size. We also source data and analyses trends based on information received from supply side and demand side intermediaries in the value chain. The supply side denotes the data gathered from supplier, distributor, wholesaler and the demand side illustrates the data gathered from the end customers for respective market domain.

The supply side for a domain specific market is analysed by:
The demand side for the market is estimated through:
In-house Library: Apart from these third-party sources, we have our in-house library of qualitative and quantitative information. Our in-house database includes market data for various industry and domains. These data are updated on regular basis as per the changing market scenario. Our library includes, historic databases, internal audit reports and archives.
Sometimes there are instances where there is no metadata or raw data available for any domain specific market. For those cases, we use our expertise to forecast and estimate the market size in order to generate comprehensive data sets. Our analyst team adopt a robust research technique in order to produce the estimates:
Data Synthesis: This stage involves the analysis & mapping of all the information obtained from the previous step. It also involves in scrutinizing the data for any discrepancy observed while data gathering related to the market. The data is collected with consideration to the heterogeneity of sources. Robust scientific techniques are in place for synthesizing disparate data sets and provide the essential contextual information that can orient market strategies. The Brainy Insights has extensive experience in data synthesis where the data passes through various stages:


Market Deduction & Formulation: The final stage comprises of assigning data points at appropriate market spaces so as to deduce feasible conclusions. Analyst perspective & subject matter expert based holistic form of market sizing coupled with industry analysis also plays a crucial role in this stage.
This stage involves in finalization of the market size and numbers that we have collected from data integration step. With data interpolation, it is made sure that there is no gap in the market data. Successful trend analysis is done by our analysts using extrapolation techniques, which provide the best possible forecasts for the market.
Data Validation & Market Feedback: Validation is the most important step in the process. Validation & re-validation via an intricately designed process helps us finalize data-points to be used for final calculations.

The Brainy Insights interacts with leading companies and experts of the concerned domain to develop the analyst team’s market understanding and expertise. It improves and substantiates every single data presented in the market reports. The data validation interview and discussion panels are typically composed of the most experienced industry members. The participants include, however, are not limited to:
Moreover, we always validate our data and findings through primary respondents from all the major regions we are working on.


Free Customization
Fortune 500 Clients
Free Yearly Update On Purchase Of Multi/Corporate License
Companies Served Till Date