- +1-315-215-1633
- sales@thebrainyinsights.com

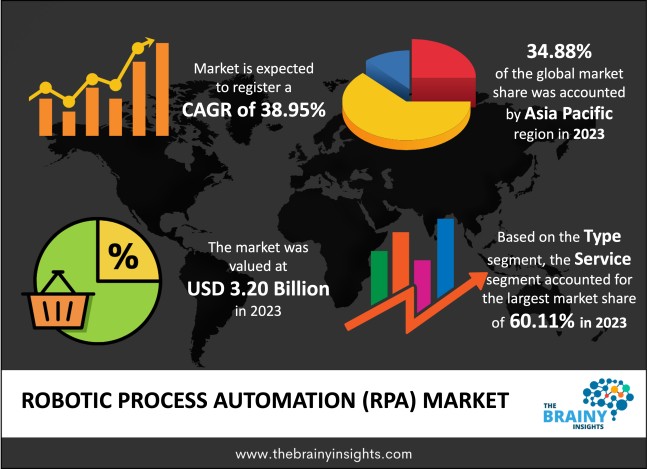
The global Robotic Process Automation (RPA) market was valued at USD 3.20 billion in 2023 and growing at a CAGR of 38.95% from 2024 to 2033. The market is expected to reach USD 85.85 billion by 2033. Rising demand from the end-user industries, such as BFSI, Pharma & Healthcare, IT & Telecom has propelled the growth of the Robotic Process Automation (RPA) Market. Unprecedented use of RPA by providing a helping hand to the doctors and other healthcare personnel. Thereby looking into more critical tasks helps in saving time and benefits the patients as well. Further, rising technological advancements and increased adoption of Artificial Intelligence (AI), Machine Leaning, cloud, to streamline the business process may also provide lucrative opportunities towards the growth of the RPA Market, in the period forecasted.
Robotic Process Automation (RPA) is an automation technology that primarily uses robots/bots to perform various repetitive and rule-based tasks in the organization. With increasing use of large sets of data and increased chances of the manual errors, their prevails rising demand from various end-user industries where constant repetitive tasks, such as, data entry, customer service, bill process and other activities can be shifted from the personnel to the RPA. Thus, RPA helps these industries in the reduction of manual errors, increased productivity & efficiency levels. Thereby utilizing the personnel in the places that require critical tasks handling and value-added work scenarios.
The RPA technology has also seen constant growth and maturity over the years. Thereby improving the overall performance of the industries, across the verticals and delivering quality results towards growth and development of the economy. This, in turn has led the increased investment in the RPA technology, thereby contributing towards the growth of the RPA Market.
Get an overview of this study by requesting a free sample
Rising demand from the end-user industries- Increased demand from various end-user industries has led to the growth of the RPA Market. BFSI sector, for example, uses RPA technology to smoothen the process of granting loans, opening of the bank accounts, deposits. Thereby improving the effectives and efficiency of the bank and other financial institutions. Additionally, various financial institutions are also integrating RPA and AI-based technology to set new policies, procedures and other regulations that are essential to the BFSI services.
Higher automation costs- higher automation and installation costs of RPA is one of the major factors that may hinder the growth of the RPA market. There is large chunk of MSME’s that are not able to incur these costs. This has led only the MNC’s and other large institutions taking unprecedented advantage of the technology. This in turn, may hinder the organization’s growth.
Technological advancements- technological advancements and integration of various AI-based software to deliver quality results to the end-users and expanding the company’s growth at unprecedented levels have opened the white spaces for the companies to tap into the dynamic market may provide lucrative opportunities to the growth of the RPA market.
The regions analyzed for the market include North America, Europe, South America, Asia Pacific, the Middle East, and Africa. Asia Pacific emerged as the largest market for the global Robotic Process Automation (RPA) market, with a 34.88% share of the market revenue in 2023.
Asia-Pacific region is anticipated to exhibit highest growth rate over the period. Nations such as China, India, and Japan have a tremendous demand for RPA across the verticals. Also, multiple key players in these countries lend a helping hand towards the market growth. In May 2022, UiPath entered into partnership agreement with U.S.-based document workflow automation platform. This was done to enhance and empower the growth of the SMEs to digitalize the business and run the same in an effective and efficient manner.
Asia Pacific Region Robotic Process Automation (RPA) Market Share in 2023 - 34.88%
www.thebrainyinsights.com
Check the geographical analysis of this market by requesting a free sample
The Type segment is divided into software, and services. The service segment dominated the market with 60.11% share in the year 2023. Whereas the software segment is expected to be the fastest moving market by Type. Various services such as, consulting and training have helped the market upgrade its automation process, which have ultimately helped in higher scaling, and increased productivity in the market.
BFSI segment has dominated the RPA market with 43.21% of the market share and is expected to be the fastest growing market, globally. RPA’s various services and minimization of the redundant efforts has helped the BFSI sector grow at a faster pace. BFSI services such as:
On-premises segment occupies largest market share with 51.32% market share whereas the cloud segment is expected to be the fastest growing segment in the RPA market. On-premises helps the companies governing RPA systems and taking care of their requirements that requires handling extensive data and providing meaningful insights out from the same.
The Organization type segment is divided into Large Enterprises and Small & Medium Enterprises. Large Enterprises captures the largest market share with 61.56% market share. Larger the organization, larger the organizational activities and higher data error chances. Therefore, Larger organizations are deploying RPA technology to minimize the human error, redundant activities and reducing the time that is wasted in the conventional activities. which in turn, reduced the operational and overhead costs of the large organizations.
| Attribute | Description |
|---|---|
| Market Size | Revenue (USD Billion) |
| Market size value in 2023 | USD 3.20 Billion |
| Market size value in 2033 | USD 85.85 Billion |
| CAGR (2024 to 2033) | 38.95% |
| Historical data | 2020-2022 |
| Base Year | 2023 |
| Forecast | 2024-2033 |
| Region | The regions analyzed for the market are Asia Pacific, Europe, South America, North America, and Middle East & Africa. Furthermore, the regions are further analyzed at the country level. |
| Segments | Type, Application, Deployment, Orgnization |
As per The Brainy Insights, the size of the robotic process automation (RPA) market was valued at USD 2.3 billion in 2022 to USD 66 billion by 2032.
The global robotic process automation (RPA) market is growing at a CAGR of 39.9% during the forecast period 2023-2032.
The Asia Pacific region emerged as the largest market for the robotic process automation (RPA).
The rising demand from the end-user industries will influence the market's growth.
1. Introduction
1.1. Objectives of the Study
1.2. Market Definition
1.3. Research Scope
1.4. Currency
1.5. Key Target Audience
2. Research Methodology and Assumptions
3. Executive Summary
4. Premium Insights
4.1. Porter’s Five Forces Analysis
4.2. Value Chain Analysis
4.3. Top Investment Pockets
4.3.1. Market Attractiveness Analysis by Type
4.3.2. Market Attractiveness Analysis by Application
4.3.3. Market Attractiveness Analysis by Deployment
4.3.4. Market Attractiveness Analysis by Organization
4.3.5. Market Attractiveness Analysis by Region
4.4. Industry Trends
5. Market Dynamics
5.1. Market Evaluation
5.2. Drivers
5.2.1. Rising demand from the end-user industries
5.3. Restraints
5.3.1. Higher automation costs
5.4. Opportunities
5.4.1. Technological advancement
5.5. Challenges
5.5.1. Lower levels of employment of manpower
6. Global Robotic Process Automation (RPA) Market Analysis and Forecast, By Type
6.1. Segment Overview
6.2. Software
6.3. Service
7. Global Robotic Process Automation (RPA) Market Analysis and Forecast, By Application
7.1. Segment Overview
7.2. BFSI
7.3. Pharma & Healthcare
7.4. Retail & Consumer Goods
7.5. Information Technology (IT) & Telecom
7.6. Communication and Media & Education
7.7. Manufacturing
7.8. Logistics and Energy & Utilities
7.9. Others
8. Global Robotic Process Automation (RPA) Market Analysis and Forecast, By Deployment
8.1. Segment Overview
8.2. Cloud
8.3. On-premises
9. Global Robotic Process Automation (RPA) Market Analysis and Forecast, By Organization
9.1. Segment Overview
9.2. Large Enterprises
9.3. Small & Medium Enterprises
10. Global Robotic Process Automation (RPA) Market Analysis and Forecast, By Regional Analysis
10.1. Segment Overview
10.2. North America
10.2.1. U.S.
10.2.2. Canada
10.2.3. Mexico
10.3. Europe
10.3.1. Germany
10.3.2. France
10.3.3. U.K.
10.3.4. Italy
10.3.5. Spain
10.4. Asia-Pacific
10.4.1. Japan
10.4.2. China
10.4.3. India
10.5. South America
10.5.1. Brazil
10.6. Middle East and Africa
10.6.1. UAE
10.6.2. South Africa
11. Global Robotic Process Automation (RPA) Market-Competitive Landscape
11.1. Overview
11.2. Market Share of Key Players in Global Robotic Process Automation (RPA) Market
11.2.1. Global Company Market Share
11.2.2. North America Company Market Share
11.2.3. Europe Company Market Share
11.2.4. APAC Company Market Share
11.3. Competitive Situations and Trends
11.3.1. Product Launches and Developments
11.3.2. Partnerships, Collaborations, and Agreements
11.3.3. Mergers & Acquisitions
11.3.4. Expansions
12. Company Profiles
12.1. Automation Anywhere
12.1.1. Business Overview
12.1.2. Company Snapshot
12.1.3. Company Market Share Analysis
12.1.4. Company Product Portfolio
12.1.5. Recent Developments
12.1.6. SWOT Analysis
12.2. Blue Prism
12.2.1. Business Overview
12.2.2. Company Snapshot
12.2.3. Company Market Share Analysis
12.2.4. Company Product Portfolio
12.2.5. Recent Developments
12.2.6. SWOT Analysis
12.3. UiPath
12.3.1. Business Overview
12.3.2. Company Snapshot
12.3.3. Company Market Share Analysis
12.3.4. Company Product Portfolio
12.3.5. Recent Developments
12.3.6. SWOT Analysis
12.4. Pegasytems
12.4.1. Business Overview
12.4.2. Company Snapshot
12.4.3. Company Market Share Analysis
12.4.4. Company Product Portfolio
12.4.5. Recent Developments
12.4.6. SWOT Analysis
12.5. OnviSource Inc
12.5.1. Business Overview
12.5.2. Company Snapshot
12.5.3. Company Market Share Analysis
12.5.4. Company Product Portfolio
12.5.5. Recent Developments
12.5.6. SWOT Analysis
12.6. NTT Advanced Technology Corp
12.6.1. Business Overview
12.6.2. Company Snapshot
12.6.3. Company Market Share Analysis
12.6.4. Company Product Portfolio
12.6.5. Recent Developments
12.6.6. SWOT Analysis
12.7. NICE
12.7.1. Business Overview
12.7.2. Company Snapshot
12.7.3. Company Market Share Analysis
12.7.4. Company Product Portfolio
12.7.5. Recent Developments
12.7.6. SWOT Analysis
12.8. AntWork Inc
12.8.1. Business Overview
12.8.2. Company Snapshot
12.8.3. Company Market Share Analysis
12.8.4. Company Product Portfolio
12.8.5. Recent Developments
12.8.6. SWOT Analysis
12.9. KOFAX Inc
12.9.1. Business Overview
12.9.2. Company Snapshot
12.9.3. Company Market Share Analysis
12.9.4. Company Product Portfolio
12.9.5. Recent Developments
12.9.6. SWOT Analysis
12.10. FPT Software
12.10.1. Business Overview
12.10.2. Company Snapshot
12.10.3. Company Market Share Analysis
12.10.4. Company Product Portfolio
12.10.5. Recent Developments
12.10.6. SWOT Analysis
List of Table
1. Global Robotic Process Automation (RPA) Market, By Type, 2020-2033(USD Billion)
2. Global Software, Robotic Process Automation (RPA) Market, By Region, 2020-2033(USD Billion)
3. Global Service, Robotic Process Automation (RPA) Market, By Region, 2020-2033(USD Billion)
4. Global Robotic Process Automation (RPA) Market, By Application, 2020-2033(USD Billion)
5. Global BFSI, Robotic Process Automation (RPA) Market, By Region, 2020-2033(USD Billion)
6. Global Pharma & Healthcare, Robotic Process Automation (RPA) Market, By Region, 2020-2033(USD Billion)
7. Global Retail & Consumer Goods, Robotic Process Automation (RPA) Market, By Region, 2020-2033(USD Billion)
8. Global Information Technology (IT) & Telecom, Robotic Process Automation (RPA) Market, By Region, 2020-2033(USD Billion)
9. Global Communication and Media & Education, Robotic Process Automation (RPA) Market, By Region, 2020-2033(USD Billion)
10. Global Manufacturing, Robotic Process Automation (RPA) Market, By Region, 2020-2033(USD Billion)
11. Global Logistics and Energy & Utilities, Robotic Process Automation (RPA) Market, By Region, 2020-2033(USD Billion)
12. Global Others, Robotic Process Automation (RPA) Market, By Region, 2020-2033(USD Billion)
13. Global Robotic Process Automation (RPA) Market, By Deployment, 2020-2033(USD Billion)
14. Global Cloud, Robotic Process Automation (RPA) Market, By Region, 2020-2033(USD Billion)
15. Global On-premises, Robotic Process Automation (RPA) Market, By Region, 2020-2033(USD Billion)
16. Global Robotic Process Automation (RPA) Market, By Organization, 2020-2033(USD Billion)
17. Global Large Enterprises, Robotic Process Automation (RPA) Market, By Region, 2020-2033(USD Billion)
18. Global Small & Medium Enterprises, Robotic Process Automation (RPA) Market, By Region, 2020-2033(USD Billion)
19. North America Robotic Process Automation (RPA) Market, By Type, 2020-2033(USD Billion)
20. North America Robotic Process Automation (RPA) Market, By Application, 2020-2033(USD Billion)
21. North America Robotic Process Automation (RPA) Market, By Deployment, 2020-2033(USD Billion)
22. North America Robotic Process Automation (RPA) Market, By Organization, 2020-2033(USD Billion)
23. U.S. Robotic Process Automation (RPA) Market, By Type, 2020-2033(USD Billion)
24. U.S. Robotic Process Automation (RPA) Market, By Application, 2020-2033(USD Billion)
25. U.S. Robotic Process Automation (RPA) Market, By Deployment, 2020-2033(USD Billion)
26. U.S. Robotic Process Automation (RPA) Market, By Organization, 2020-2033(USD Billion)
27. Canada Robotic Process Automation (RPA) Market, By Type, 2020-2033(USD Billion)
28. Canada Robotic Process Automation (RPA) Market, By Application, 2020-2033(USD Billion)
29. Canada Robotic Process Automation (RPA) Market, By Deployment, 2020-2033(USD Billion)
30. Canada Robotic Process Automation (RPA) Market, By Organization, 2020-2033(USD Billion)
31. Mexico Robotic Process Automation (RPA) Market, By Type, 2020-2033(USD Billion)
32. Mexico Robotic Process Automation (RPA) Market, By Application, 2020-2033(USD Billion)
33. Mexico Robotic Process Automation (RPA) Market, By Deployment, 2020-2033(USD Billion)
34. Mexico Robotic Process Automation (RPA) Market, By Organization, 2020-2033(USD Billion)
35. Europe Robotic Process Automation (RPA) Market, By Type, 2020-2033(USD Billion)
36. Europe Robotic Process Automation (RPA) Market, By Application, 2020-2033(USD Billion)
37. Europe Robotic Process Automation (RPA) Market, By Deployment, 2020-2033(USD Billion)
38. Europe Robotic Process Automation (RPA) Market, By Organization, 2020-2033(USD Billion)
39. Germany Robotic Process Automation (RPA) Market, By Type, 2020-2033(USD Billion)
40. Germany Robotic Process Automation (RPA) Market, By Application, 2020-2033(USD Billion)
41. Germany Robotic Process Automation (RPA) Market, By Deployment, 2020-2033(USD Billion)
42. Germany Robotic Process Automation (RPA) Market, By Organization, 2020-2033(USD Billion)
43. France Robotic Process Automation (RPA) Market, By Type, 2020-2033(USD Billion)
44. France Robotic Process Automation (RPA) Market, By Application, 2020-2033(USD Billion)
45. France Robotic Process Automation (RPA) Market, By Deployment, 2020-2033(USD Billion)
46. France Robotic Process Automation (RPA) Market, By Organization, 2020-2033(USD Billion)
47. U.K. Robotic Process Automation (RPA) Market, By Type, 2020-2033(USD Billion)
48. U.K. Robotic Process Automation (RPA) Market, By Application, 2020-2033(USD Billion)
49. U.K. Robotic Process Automation (RPA) Market, By Deployment, 2020-2033(USD Billion)
50. U.K. Robotic Process Automation (RPA) Market, By Organization, 2020-2033(USD Billion)
51. Italy Robotic Process Automation (RPA) Market, By Type, 2020-2033(USD Billion)
52. Italy Robotic Process Automation (RPA) Market, By Application, 2020-2033(USD Billion)
53. Italy Robotic Process Automation (RPA) Market, By Deployment, 2020-2033(USD Billion)
54. Italy Robotic Process Automation (RPA) Market, By Organization, 2020-2033(USD Billion)
55. Spain Robotic Process Automation (RPA) Market, By Type, 2020-2033(USD Billion)
56. Spain Robotic Process Automation (RPA) Market, By Application, 2020-2033(USD Billion)
57. Spain Robotic Process Automation (RPA) Market, By Deployment, 2020-2033(USD Billion)
58. Spain Robotic Process Automation (RPA) Market, By Organization, 2020-2033(USD Billion)
59. Asia Pacific Robotic Process Automation (RPA) Market, By Type, 2020-2033(USD Billion)
60. Asia Pacific Robotic Process Automation (RPA) Market, By Application, 2020-2033(USD Billion)
61. Asia Pacific Robotic Process Automation (RPA) Market, By Deployment, 2020-2033(USD Billion)
62. Asia Pacific Robotic Process Automation (RPA) Market, By Organization, 2020-2033(USD Billion)
63. Japan Robotic Process Automation (RPA) Market, By Type, 2020-2033(USD Billion)
64. Japan Robotic Process Automation (RPA) Market, By Application, 2020-2033(USD Billion)
65. Japan Robotic Process Automation (RPA) Market, By Deployment, 2020-2033(USD Billion)
66. Japan Robotic Process Automation (RPA) Market, By Organization, 2020-2033(USD Billion)
67. China Robotic Process Automation (RPA) Market, By Type, 2020-2033(USD Billion)
68. China Robotic Process Automation (RPA) Market, By Application, 2020-2033(USD Billion)
69. China Robotic Process Automation (RPA) Market, By Deployment, 2020-2033(USD Billion)
70. China Robotic Process Automation (RPA) Market, By Organization, 2020-2033(USD Billion)
71. India Robotic Process Automation (RPA) Market, By Type, 2020-2033(USD Billion)
72. India Robotic Process Automation (RPA) Market, By Application, 2020-2033(USD Billion)
73. India Robotic Process Automation (RPA) Market, By Deployment, 2020-2033(USD Billion)
74. India Robotic Process Automation (RPA) Market, By Organization, 2020-2033(USD Billion)
75. South America Robotic Process Automation (RPA) Market, By Type, 2020-2033(USD Billion)
76. South America Robotic Process Automation (RPA) Market, By Application, 2020-2033(USD Billion)
77. South America Robotic Process Automation (RPA) Market, By Deployment, 2020-2033(USD Billion)
78. South America Robotic Process Automation (RPA) Market, By Organization, 2020-2033(USD Billion)
79. Brazil Robotic Process Automation (RPA) Market, By Type, 2020-2033(USD Billion)
80. Brazil Robotic Process Automation (RPA) Market, By Application, 2020-2033(USD Billion)
81. Brazil Robotic Process Automation (RPA) Market, By Deployment, 2020-2033(USD Billion)
82. Brazil Robotic Process Automation (RPA) Market, By Organization, 2020-2033(USD Billion)
83. Middle East and Africa Robotic Process Automation (RPA) Market, By Type, 2020-2033(USD Billion)
84. Middle East and Africa Robotic Process Automation (RPA) Market, By Application, 2020-2033(USD Billion)
85. Middle East and Africa Robotic Process Automation (RPA) Market, By Deployment, 2020-2033(USD Billion)
86. Middle East and Africa Robotic Process Automation (RPA) Market, By Organization, 2020-2033(USD Billion)
87. UAE Robotic Process Automation (RPA) Market, By Type, 2020-2033(USD Billion)
88. UAE Robotic Process Automation (RPA) Market, By Application, 2020-2033(USD Billion)
89. UAE Robotic Process Automation (RPA) Market, By Deployment, 2020-2033(USD Billion)
90. UAE Robotic Process Automation (RPA) Market, By Organization, 2020-2033(USD Billion)
91. South Africa Robotic Process Automation (RPA) Market, By Type, 2020-2033(USD Billion)
92. South Africa Robotic Process Automation (RPA) Market, By Application, 2020-2033(USD Billion)
93. South Africa Robotic Process Automation (RPA) Market, By Deployment, 2020-2033(USD Billion)
94. South Africa Robotic Process Automation (RPA) Market, By Organization, 2020-2033(USD Billion)
List of Figures
1. Global Robotic Process Automation (RPA) Market Segmentation
2. Global Robotic Process Automation (RPA) Market: Research Methodology
3. Market Size Estimation Methodology: Bottom-Up Approach
4. Market Size Estimation Methodology: Top-Down Approach
5. Data Triangulation
6. Porter’s Five Forces Analysis
7. Value Chain Analysis
8. Global Robotic Process Automation (RPA) Market Attractiveness Analysis by Type
9. Global Robotic Process Automation (RPA) Market Attractiveness Analysis by Application
10. Global Robotic Process Automation (RPA) Market Attractiveness Analysis by Deployment
11. Global Robotic Process Automation (RPA) Market Attractiveness Analysis by Organization
12. Global Robotic Process Automation (RPA) Market Attractiveness Analysis by Region
13. Global Robotic Process Automation (RPA) Market: Dynamics
14. Global Robotic Process Automation (RPA) Market Share by Type (2023 & 2033)
15. Global Robotic Process Automation (RPA) Market Share by Application (2023 & 2033)
16. Global Robotic Process Automation (RPA) Market Share Analysis by Deployment (2023 & 2033)
17. Global Robotic Process Automation (RPA) Market Share Analysis by Organization (2023 & 2033)
18. Global Robotic Process Automation (RPA) Market Share by Regions (2023 & 2033)
19. Global Robotic Process Automation (RPA) Market Share by Company (2023)
This study forecasts revenue at global, regional, and country levels from 2019 to 2032. The Brainy Insights has segmented the global robotic process automation (RPA) market based on below-mentioned segments:
Global Robotic Process Automation (RPA) Market by Type:
Global Robotic Process Automation (RPA) Market by Application:
Global Robotic Process Automation (RPA) Market by Deployment:
Global Robotic Process Automation (RPA) Market by Organization:
Global Robotic Process Automation (RPA) Market by Region:
Research has its special purpose to undertake marketing efficiently. In this competitive scenario, businesses need information across all industry verticals; the information about customer wants, market demand, competition, industry trends, distribution channels etc. This information needs to be updated regularly because businesses operate in a dynamic environment. Our organization, The Brainy Insights incorporates scientific and systematic research procedures in order to get proper market insights and industry analysis for overall business success. The analysis consists of studying the market from a miniscule level wherein we implement statistical tools which helps us in examining the data with accuracy and precision.
Our research reports feature both; quantitative and qualitative aspects for any market. Qualitative information for any market research process are fundamental because they reveal the customer needs and wants, usage and consumption for any product/service related to a specific industry. This in turn aids the marketers/investors in knowing certain perceptions of the customers. Qualitative research can enlighten about the different product concepts and designs along with unique service offering that in turn, helps define marketing problems and generate opportunities. On the other hand, quantitative research engages with the data collection process through interviews, e-mail interactions, surveys and pilot studies. Quantitative aspects for the market research are useful to validate the hypotheses generated during qualitative research method, explore empirical patterns in the data with the help of statistical tools, and finally make the market estimations.
The Brainy Insights offers comprehensive research and analysis, based on a wide assortment of factual insights gained through interviews with CXOs and global experts and secondary data from reliable sources. Our analysts and industry specialist assume vital roles in building up statistical tools and analysis models, which are used to analyse the data and arrive at accurate insights with exceedingly informative research discoveries. The data provided by our organization have proven precious to a diverse range of companies, facilitating them to address issues such as determining which products/services are the most appealing, whether or not customers use the product in the manner anticipated, the purchasing intentions of the market and many others.
Our research methodology encompasses an idyllic combination of primary and secondary initiatives. Key phases involved in this process are listed below:

The phase involves the gathering and collecting of market data and its related information with the help of different sources & research procedures.

The data procurement stage involves in data gathering and collecting through various data sources.
This stage involves in extensive research. These data sources includes:
Purchased Database: Purchased databases play a crucial role in estimating the market sizes irrespective of the domain. Our purchased database includes:
Primary Research: The Brainy Insights interacts with leading companies and experts of the concerned domain to develop the analyst team’s market understanding and expertise. It improves and substantiates every single data presented in the market reports. Primary research mainly involves in telephonic interviews, E-mail interactions and face-to-face interviews with the raw material providers, manufacturers/producers, distributors, & independent consultants. The interviews that we conduct provides valuable data on market size and industry growth trends prevailing in the market. Our organization also conducts surveys with the various industry experts in order to gain overall insights of the industry/market. For instance, in healthcare industry we conduct surveys with the pharmacists, doctors, surgeons and nurses in order to gain insights and key information of a medical product/device/equipment which the customers are going to usage. Surveys are conducted in the form of questionnaire designed by our own analyst team. Surveys plays an important role in primary research because surveys helps us to identify the key target audiences of the market. Additionally, surveys helps to identify the key target audience engaged with the market. Our survey team conducts the survey by targeting the key audience, thus gaining insights from them. Based on the perspectives of the customers, this information is utilized to formulate market strategies. Moreover, market surveys helps us to understand the current competitive situation of the industry. To be precise, our survey process typically involve with the 360 analysis of the market. This analytical process begins by identifying the prospective customers for a product or service related to the market/industry to obtain data on how a product/service could fit into customers’ lives.

Secondary Research: The secondary data sources includes information published by the on-profit organizations such as World bank, WHO, company fillings, investor presentations, annual reports, national government documents, statistical databases, blogs, articles, white papers and others. From the annual report, we analyse a company’s revenue to understand the key segment and market share of that organization in a particular region. We analyse the company websites and adopt the product mapping technique which is important for deriving the segment revenue. In the product mapping method, we select and categorize the products offered by the companies catering to domain specific market, deduce the product revenue for each of the companies so as to get overall estimation of the market size. We also source data and analyses trends based on information received from supply side and demand side intermediaries in the value chain. The supply side denotes the data gathered from supplier, distributor, wholesaler and the demand side illustrates the data gathered from the end customers for respective market domain.

The supply side for a domain specific market is analysed by:
The demand side for the market is estimated through:
In-house Library: Apart from these third-party sources, we have our in-house library of qualitative and quantitative information. Our in-house database includes market data for various industry and domains. These data are updated on regular basis as per the changing market scenario. Our library includes, historic databases, internal audit reports and archives.
Sometimes there are instances where there is no metadata or raw data available for any domain specific market. For those cases, we use our expertise to forecast and estimate the market size in order to generate comprehensive data sets. Our analyst team adopt a robust research technique in order to produce the estimates:
Data Synthesis: This stage involves the analysis & mapping of all the information obtained from the previous step. It also involves in scrutinizing the data for any discrepancy observed while data gathering related to the market. The data is collected with consideration to the heterogeneity of sources. Robust scientific techniques are in place for synthesizing disparate data sets and provide the essential contextual information that can orient market strategies. The Brainy Insights has extensive experience in data synthesis where the data passes through various stages:


Market Deduction & Formulation: The final stage comprises of assigning data points at appropriate market spaces so as to deduce feasible conclusions. Analyst perspective & subject matter expert based holistic form of market sizing coupled with industry analysis also plays a crucial role in this stage.
This stage involves in finalization of the market size and numbers that we have collected from data integration step. With data interpolation, it is made sure that there is no gap in the market data. Successful trend analysis is done by our analysts using extrapolation techniques, which provide the best possible forecasts for the market.
Data Validation & Market Feedback: Validation is the most important step in the process. Validation & re-validation via an intricately designed process helps us finalize data-points to be used for final calculations.

The Brainy Insights interacts with leading companies and experts of the concerned domain to develop the analyst team’s market understanding and expertise. It improves and substantiates every single data presented in the market reports. The data validation interview and discussion panels are typically composed of the most experienced industry members. The participants include, however, are not limited to:
Moreover, we always validate our data and findings through primary respondents from all the major regions we are working on.


Free Customization
Fortune 500 Clients
Free Yearly Update On Purchase Of Multi/Corporate License
Companies Served Till Date