- +1-315-215-1633
- sales@thebrainyinsights.com

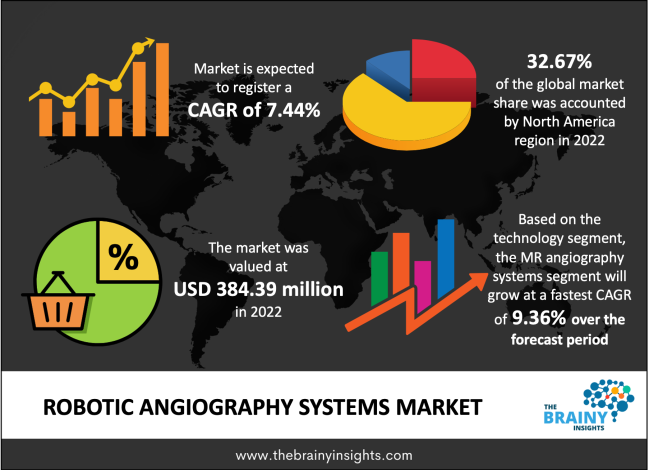
The global robotic angiography systems market was valued at USD 384.39 million in 2022 and growing at a CAGR of 7.44% from 2022 to 2030. The market is expected to reach USD 682.49 million by 2030. Europe is expected to increase the fastest during the forecast period.
Angiography is a minimally invasive medical imaging procedure to observe the interior of various organs and blood vessels in the human body. Healthcare infrastructures are increasingly adopting cutting-edge robotic imaging solutions for angiography due to growing automation integration and advances in imaging technology. On the global market, this is anticipated to increase demand for robotic angiography systems. To analyze blood flow-related issues inside the human body with high precision, accuracy, and reliability, the medical sector is quickly expanding the adoption of cutting-edge diagnostic equipment and imaging technologies. The market for robotic angiography systems is anticipated to benefit significantly from these potentials for high revenue generation. A new generation robotic-assisted angiography system was designed for invasive cardiology treatments, interventional radiology, and surgical procedures. The system's flat panel detector and tube technologies deliver high-quality images with some radiation dosage. A proactive approach to infection management that prevents the growth of germs and viruses in the system is provided by the hygienic design for hybrid operating rooms and the anti-microbial coating of the robotic-assisted angiography system.
Get an overview of this study by requesting a free sample
The market for robotic angiography systems is highly competitive, attributed to an increasing focus on delivering unique products and adopting strategies including collaboration, agreement, and acquisition by top businesses.
On 13 June 2022, The new Allia IGS 7 Platform was launched by General Electric's healthcare subsidiary, GE Healthcare, to advance precision medicine in image-guided therapies. The Red Dot Design Award for Product Design-winning new platform gives consumers more flexibility and promotes complete workplace mobility.
Increase in the prevalence of chronic diseases- There is a massive increase in the burden of heart and kidney-related illnesses worldwide due to rising obesity, expanding unhealthy eating habits, and increasing alcohol consumption. For instance, it was found that approximately 37 million Americans, or more than one in seven adults, are said to have chronic kidney disease. Robotic angiography technologies are being utilized more frequently to visualize the blood arteries in the kidneys and the heart so that issues can be accurately identified and assessed while reducing the possibility of human mistakes. As a result, it is projected that the increasing burden of these diseases will fuel market growth internationally. It is anticipated that the use of these cutting-edge diagnostic methods will be backed by the growing need among healthcare service providers to increase workflow effectiveness and to diagnose illnesses early. The usage of robotic diagnostic equipment among medical service suppliers is predicted to rise, which is anticipated to fuel the expansion of the market for robotic angiography systems across the globe throughout the anticipated time frame. This adoption is expected to be supported by hospitals' increased spending.
Lack of research and development- Although there are many advantages to using robotic angiography systems, various problems, including a high radiation exposure risk, injuries from catheterized arteries, and unsuitability for critically ill patients, are restricting sales in the international market. Further limiting market expansion are the high angiography costs operations, the high initial cost of robotic angiography systems, and the limited funding for angiographic surgeries.
Increasing government-supported innovation: The various chances created due to the rising government support for promoting the development of new technologies invention of revolutionary medical equipment may also be associated with expanding the global market for robotic angiography systems. For instance, as part of the FDA's Q-Submission Program, the Center for Devices and Radiological Health (CDRH), a division of the US Food and Drug Administration (FDA) that supports innovation in medical technology, provides early regulatory help together with two choices. A proper premarket procedure, including De Novo classification, premarket approval, and premarket clearance (510(k)), among others, is followed by the FDA when reviewing medical devices that include artificial intelligence (AI) and machine learning (ML). The CDRH has also created the Partnerships to Advance Innovation and Regulatory Science (PAIRS) initiative, which aims to form partnerships with business leaders to keep up with the quick advancement of modern technology in medical devices.
High cost: The market for robotic angiography systems has several challenges, including concerns about radiation exposure, the probability of injuries caused by catheterized arteries, the high angiography costs procedures, and the high price of robotic angiography devices.
The regions analyzed for the market include North America, Europe, South America, Asia Pacific, the Middle East, and Africa. North America emerged as the most significant global robotic angiography systems market, with a 32.67% market revenue share in 2022.
North America, which accounted for 32.67% of the total revenue in the global robotic angiography systems market in 2022, led the market revenue share. Robotic angiography systems are becoming increasingly popular as several disorders affecting the blood vessels, brain, heart, kidneys, and other organs continue to climb. High-precision imaging solutions are increasingly being used. Leading producers are concentrating on releasing new items. As a result, to meet the rising demand. For instance, in 2021, GE Healthcare, a developer of diagnostic imaging solutions based in the United States, announced the release of Allia IGS 7, a new version of their robotic angiography equipment that incorporated artificial intelligence (AI) optimal imaging settings. The sales of robotic angiography systems in the North American market are predicted to increase due to the debut of various new products.
North America Region Robotic Angiography Systems Market Share in 2022 - 32.67%
www.thebrainyinsights.com
Check the geographical analysis of this market by requesting a free sample
The technology segment is divided into CT angiography systems, X-ray angiography systems, and MR angiography systems. Over the projected period, it is anticipated that the MR angiography systems segment will grow at a significantly high CAGR of 9.36%. MR Angiography Systems assess blood arteries and help spot anomalies using a strong magnetic field, radio waves, and a computer. While no radiation is involved in this examination, contrast material injection may be necessary. Compared to contrast in computed tomography, the contrast utilized in MRA is less likely to result in an allergic reaction.
The application segment is divided into endovascular angiography, onco-angiography, coronary angiography, and neuro-angiography. Over the projected period, it is anticipated that the endovascular angiography segment will grow at a significantly high CAGR of 8.81%. Robots in surgery assist in completing delicate, precise procedures that humans, with their innate physical limitations, may be limited to performing. It is being used for interventional cardiac procedures. However, it could be employed soon for acute stroke therapies in remote regions and situations where a neuro-interventionalist is not accessible.
The indication segment is divided into valvular heart disease, congestive heart failure, coronary artery disease, congenital heart disease, and others. Over the projected period, it is anticipated that the coronary artery disease segment will grow at a significantly high CAGR of 9.77%. Since being incorporated into clinical practice, the intervention has evolved quickly and adaptively. Expanding robotics for diagnostic coronary angiography would lessen operator occupational risks and radiation scatter exposure. This method is especially appealing when using radial access since universal radial diagnostic catheters can easily engage both the right and left coronary arteries.
The end user segment is divided into specialty clinics, academic and research institutes, hospitals, and diagnostic and imaging centers. In 2022, the hospital segment dominated the market, accounting for around 28.76% of global revenue. In hospitals, surgeons who utilize the robotic system discover that it improves precision, flexibility, and control throughout the surgery and gives them a better view of the site than traditional approaches for many surgeries. Patients who require complicated procedures develop trust in hospitals.
| Attribute | Description |
|---|---|
| Market Size | Revenue (USD Million) |
| Market size value in 2022 | USD 384.39 Million |
| Market size value in 2030 | USD 682.49 Million |
| CAGR (2022 to 2030) | 7.44% |
| Historical data | 2019-2020 |
| Base Year | 2021 |
| Forecast | 2022-2030 |
| Segments | Technology, Application, Indication, End User |
| Regional Segments | The regions analyzed for the market are Europe, Asia Pacific, North America, South America, and Middle East & Africa. |
As per The Brainy Insights, the size of the robotic angiography systems market was valued USD 384.39 million in 2022 & USD 682.49 million by 2030.
Global robotic angiography systems market is growing at a CAGR of 7.44% during the forecast period 2022-2030.
The market's growth will be influenced by the increase in the prevalence of chronic diseases.
Lack of research and development could hamper the market growth.
High cost can be a challenging factor in the growth of the robotic angiography systems market.
1. Introduction
1.1. Objective of the Study
1.2. Market Definition
1.3. Research Scope
1.4. Currency
1.5. Key Target Audience
2. Research Methodology and Assumptions
3. Executive Summary
4. Premium Insights
4.1. Porter’s Five Forces Analysis
4.2. Value Chain Analysis
4.3. Top Investment Pockets
4.3.1. Market Attractiveness Analysis By Technology
4.3.2. Market Attractiveness Analysis By Application
4.3.3. Market Attractiveness Analysis By Indication
4.3.4. Market Attractiveness Analysis By End User
4.3.5. Market Attractiveness Analysis By Region
4.4. Industry Trends
5. Market Dynamics
5.1. Market Evaluation
5.2. Drivers
5.2.1. Increase in the prevalence of chronic diseases
5.3. Restraints
5.3.1. Lack of research and development
5.4. Opportunities
5.4.1. Increasing government-supported innovation
5.5. Challenges
5.5.1. High cost
6. Global Robotic Angiography Systems Market Analysis and Forecast, By Technology
6.1. Segment Overview
6.2. CT Angiography Systems
6.3. X-ray Angiography Systems
6.4. MR Angiography Systems
7. Global Robotic Angiography Systems Market Analysis and Forecast, By Application
7.1. Segment Overview
7.2. Endovascular Angiography
7.3. Onco-Angiography
7.4. Coronary Angiography
7.5. Neuro-Angiography
8. Global Robotic Angiography Systems Market Analysis and Forecast, By Indication
8.1. Segment Overview
8.2. Valvular Heart Disease
8.3. Congestive Heart Failure
8.4. Coronary Artery Disease
8.5. Congenital Heart Disease
8.6. Others
9. Global Robotic Angiography Systems Market Analysis and Forecast, By End User
9.1. Segment Overview
9.2. Specialty Clinics
9.3. Academic and Research Institutes
9.4. Hospitals
9.5. Diagnostic and Imaging Centers
10. Global Robotic Angiography Systems Market Analysis and Forecast, By Regional Analysis
10.1. Segment Overview
10.2. North America
10.2.1. U.S.
10.2.2. Canada
10.2.3. Mexico
10.3. Europe
10.3.1. Germany
10.3.2. France
10.3.3. U.K.
10.3.4. Italy
10.3.5. Spain
10.4. Asia-Pacific
10.4.1. Japan
10.4.2. China
10.4.3. India
10.5. South America
10.5.1. Brazil
10.6. Middle East and Africa
10.6.1. UAE
10.6.2. South Africa
11. Global Robotic Angiography Systems Market-Competitive Landscape
11.1. Overview
11.2. Market Share of Key Players in the Robotic Angiography Systems Market
11.2.1. Global Company Market Share
11.2.2. North America Company Market Share
11.2.3. Europe Company Market Share
11.2.4. APAC Company Market Share
11.3. Competitive Situations and Trends
11.3.1. Product Launches and Developments
11.3.2. Partnerships, Collaborations, and Agreements
11.3.3. Mergers & Acquisitions
11.3.4. Expansions
12. Company Profiles
12.1. KUKA AG
12.1.1. Business Overview
12.1.2. Company Snapshot
12.1.3. Company Market Share Analysis
12.1.4. Company Product Portfolio
12.1.5. Recent Developments
12.1.6. SWOT Analysis
12.2. Siemens Healthcare Private Limited
12.2.1. Business Overview
12.2.2. Company Snapshot
12.2.3. Company Market Share Analysis
12.2.4. Company Product Portfolio
12.2.5. Recent Developments
12.2.6. SWOT Analysis
12.3. Shimadzu Medical Systems
12.3.1. Business Overview
12.3.2. Company Snapshot
12.3.3. Company Market Share Analysis
12.3.4. Company Product Portfolio
12.3.5. Recent Developments
12.3.6. SWOT Analysis
12.4. Abbott
12.4.1. Business Overview
12.4.2. Company Snapshot
12.4.3. Company Market Share Analysis
12.4.4. Company Product Portfolio
12.4.5. Recent Developments
12.4.6. SWOT Analysis
12.5. Medtronic Plc
12.5.1. Business Overview
12.5.2. Company Snapshot
12.5.3. Company Market Share Analysis
12.5.4. Company Product Portfolio
12.5.5. Recent Developments
12.5.6. SWOT Analysis
12.6. GE Healthcare
12.6.1. Business Overview
12.6.2. Company Snapshot
12.6.3. Company Market Share Analysis
12.6.4. Company Product Portfolio
12.6.5. Recent Developments
12.6.6. SWOT Analysis
12.7. Corindus, Inc.
12.7.1. Business Overview
12.7.2. Company Snapshot
12.7.3. Company Market Share Analysis
12.7.4. Company Product Portfolio
12.7.5. Recent Developments
12.7.6. SWOT Analysis
12.8. Canon Medical Systems Corporation
12.8.1. Business Overview
12.8.2. Company Snapshot
12.8.3. Company Market Share Analysis
12.8.4. Company Product Portfolio
12.8.5. Recent Developments
12.8.6. SWOT Analysis
12.9. Philips Healthcare
12.9.1. Business Overview
12.9.2. Company Snapshot
12.9.3. Company Market Share Analysis
12.9.4. Company Product Portfolio
12.9.5. Recent Developments
12.9.6. SWOT Analysis
12.10. Boston Scientific Corporation
12.10.1. Business Overview
12.10.2. Company Snapshot
12.10.3. Company Market Share Analysis
12.10.4. Company Product Portfolio
12.10.5. Recent Developments
12.10.6. SWOT Analysis
List of Table
1. Global Robotic Angiography Systems Market, By Technology, 2019-2030 (USD Million)
2. Global CT Angiography Systems, Robotic Angiography Systems Market, By Region, 2019-2030 (USD Million)
3. Global X-ray Angiography Systems, Robotic Angiography Systems Market, By Region, 2019-2030 (USD Million)
4. Global MR Angiography Systems, Robotic Angiography Systems Market, By Region, 2019-2030 (USD Million)
5. Global Robotic Angiography Systems Market, By Application, 2019-2030 (USD Million)
6. Global Endovascular Angiography, Robotic Angiography Systems Market, By Region, 2019-2030 (USD Million)
7. Global Onco-Angiography, Robotic Angiography Systems Market, By Region, 2019-2030 (USD Million)
8. Global Coronary Angiography, Robotic Angiography Systems Market, By Region, 2019-2030 (USD Million)
9. Global Neuro-Angiography, Robotic Angiography Systems Market, By Region, 2019-2030 (USD Million)
10. Global Robotic Angiography Systems Market, By Indication, 2019-2030 (USD Million)
11. Global Valvular Heart Disease, Robotic Angiography Systems Market, By Region, 2019-2030 (USD Million)
12. Global Congestive Heart Failures, Robotic Angiography Systems Market, By Region, 2019-2030 (USD Million)
13. Global Coronary Artery Disease, Robotic Angiography Systems Market, By Region, 2019-2030 (USD Million)
14. Global Congenital Heart Disease, Robotic Angiography Systems Market, By Region, 2019-2030 (USD Million)
15. Global Others, Robotic Angiography Systems Market, By Region, 2019-2030 (USD Million)
16. Global Robotic Angiography Systems Market, By End User, 2019-2030 (USD Million)
17. Global Specialty Clinics, Robotic Angiography Systems Market, By Region, 2019-2030 (USD Million)
18. Global Academic and Research Institutes, Robotic Angiography Systems Market, By Region, 2019-2030 (USD Million)
19. Global Hospitals, Robotic Angiography Systems Market, By Region, 2019-2030 (USD Million)
20. Global Diagnostic and Imaging Centers, Robotic Angiography Systems Market, By Region, 2019-2030 (USD Million)
21. Global Robotic Angiography Systems Market, By Region, 2019-2030 (USD Million)
22. North America Robotic Angiography Systems Market, By Technology, 2019-2030 (USD Million)
23. North America Robotic Angiography Systems Market, By Application, 2019-2030 (USD Million)
24. North America Robotic Angiography Systems Market, By Indication, 2019-2030 (USD Million)
25. North America Robotic Angiography Systems Market, By End User, 2019-2030 (USD Million)
26. U.S. Robotic Angiography Systems Market, By Technology, 2019-2030 (USD Million)
27. U.S. Robotic Angiography Systems Market, By Application, 2019-2030 (USD Million)
28. U.S. Robotic Angiography Systems Market, By Indication, 2019-2030 (USD Million)
29. U.S. Robotic Angiography Systems Market, By End User, 2019-2030 (USD Million)
30. Canada Robotic Angiography Systems Market, By Technology, 2019-2030 (USD Million)
31. Canada Robotic Angiography Systems Market, By Application, 2019-2030 (USD Million)
32. Canada Robotic Angiography Systems Market, By Indication, 2019-2030 (USD Million)
33. Canada Robotic Angiography Systems Market, By End User, 2019-2030 (USD Million)
34. Mexico Robotic Angiography Systems Market, By Technology, 2019-2030 (USD Million)
35. Mexico Robotic Angiography Systems Market, By Application, 2019-2030 (USD Million)
36. Mexico Robotic Angiography Systems Market, By Indication, 2019-2030 (USD Million)
37. Mexico Robotic Angiography Systems Market, By End User, 2019-2030 (USD Million)
38. Europe Robotic Angiography Systems Market, By Technology, 2019-2030 (USD Million)
39. Europe Robotic Angiography Systems Market, By Application, 2019-2030 (USD Million)
40. Europe Robotic Angiography Systems Market, By Indication, 2019-2030 (USD Million)
41. Europe Robotic Angiography Systems Market, By End User, 2019-2030 (USD Million)
42. Germany Robotic Angiography Systems Market, By Technology, 2019-2030 (USD Million)
43. Germany Robotic Angiography Systems Market, By Application, 2019-2030 (USD Million)
44. Germany Robotic Angiography Systems Market, By Indication, 2019-2030 (USD Million)
45. Germany Robotic Angiography Systems Market, By End User, 2019-2030 (USD Million)
46. France Robotic Angiography Systems Market, By Technology, 2019-2030 (USD Million)
47. France Robotic Angiography Systems Market, By Application, 2019-2030 (USD Million)
48. France Robotic Angiography Systems Market, By Indication, 2019-2030 (USD Million)
49. France Robotic Angiography Systems Market, By End User, 2019-2030 (USD Million)
50. U.K. Robotic Angiography Systems Market, By Technology, 2019-2030 (USD Million)
51. U.K. Robotic Angiography Systems Market, By Application, 2019-2030 (USD Million)
52. U.K. Robotic Angiography Systems Market, By Indication, 2019-2030 (USD Million)
53. U.K. Robotic Angiography Systems Market, By End User, 2019-2030 (USD Million)
54. Italy Robotic Angiography Systems Market, By Technology, 2019-2030 (USD Million)
55. Italy Robotic Angiography Systems Market, By Application, 2019-2030 (USD Million)
56. Italy Robotic Angiography Systems Market, By Indication, 2019-2030 (USD Million)
57. Italy Robotic Angiography Systems Market, By End User, 2019-2030 (USD Million)
58. Spain Robotic Angiography Systems Market, By Technology, 2019-2030 (USD Million)
59. Spain Robotic Angiography Systems Market, By Application, 2019-2030 (USD Million)
60. Spain Robotic Angiography Systems Market, By Indication, 2019-2030 (USD Million)
61. Spain Robotic Angiography Systems Market, By End User, 2019-2030 (USD Million)
62. Asia Pacific Robotic Angiography Systems Market, By Technology, 2019-2030 (USD Million)
63. Asia Pacific Robotic Angiography Systems Market, By Application, 2019-2030 (USD Million)
64. Asia Pacific Robotic Angiography Systems Market, By Indication, 2019-2030 (USD Million)
65. Asia Pacific Robotic Angiography Systems Market, By End User, 2019-2030 (USD Million)
66. Japan Robotic Angiography Systems Market, By Technology, 2019-2030 (USD Million)
67. Japan Robotic Angiography Systems Market, By Application, 2019-2030 (USD Million)
68. Japan Robotic Angiography Systems Market, By Indication 2019-2030 (USD Million)
69. Japan Robotic Angiography Systems Market, By End User, 2019-2030 (USD Million)
70. China Robotic Angiography Systems Market, By Technology, 2019-2030 (USD Million)
71. China Robotic Angiography Systems Market, By Application, 2019-2030 (USD Million)
72. China Robotic Angiography Systems Market, By Indication, 2019-2030 (USD Million)
73. China Robotic Angiography Systems Market, By End User, 2019-2030 (USD Million)
74. India Robotic Angiography Systems Market, By Technology, 2019-2030 (USD Million)
75. India Robotic Angiography Systems Market, By Application, 2019-2030 (USD Million)
76. India Robotic Angiography Systems Market, By Indication, 2019-2030 (USD Million)
77. India Robotic Angiography Systems Market, By End User, 2019-2030 (USD Million)
78. South America Robotic Angiography Systems Market, By Technology, 2019-2030 (USD Million)
79. South America Robotic Angiography Systems Market, By Application, 2019-2030 (USD Million)
80. South America Robotic Angiography Systems Market, By Indication, 2019-2030 (USD Million)
81. South America Robotic Angiography Systems Market, By End User, 2019-2030 (USD Million)
82. Brazil Robotic Angiography Systems Market, By Technology, 2019-2030 (USD Million)
83. Brazil Robotic Angiography Systems Market, By Application, 2019-2030 (USD Million)
84. Brazil Robotic Angiography Systems Market, By Indication, 2019-2030 (USD Million)
85. Brazil Robotic Angiography Systems Market, By End User, 2019-2030 (USD Million)
86. Middle East and Africa Robotic Angiography Systems Market, By Technology, 2019-2030 (USD Million)
87. Middle East and Africa Robotic Angiography Systems Market, By Application, 2019-2030 (USD Million)
88. Middle East and Africa Robotic Angiography Systems Market, By Indication, 2019-2030 (USD Million)
89. Middle East and Africa Robotic Angiography Systems Market, By End User, 2019-2030 (USD Million)
90. UAE Robotic Angiography Systems Market, By Technology, 2019-2030 (USD Million)
91. UAE Robotic Angiography Systems Market, By Application, 2019-2030 (USD Million)
92. UAE Robotic Angiography Systems Market, By Indication, 2019-2030 (USD Million)
93. UAE Robotic Angiography Systems Market, By End User, 2019-2030 (USD Million)
94. South Africa Robotic Angiography Systems Market, By Technology, 2019-2030 (USD Million)
95. South Africa Robotic Angiography Systems Market, By Application, 2019-2030 (USD Million)
96. South Africa Robotic Angiography Systems Market, By Indication, 2019-2030 (USD Million)
97. South Africa Robotic Angiography Systems Market, By End User, 2019-2030 (USD Million)
List of Figures
1. Global Robotic Angiography Systems Market Segmentation
2. Robotic Angiography Systems Market: Research Methodology
3. Market Size Estimation Methodology: Bottom-Up Approach
4. Market Size Estimation Methodology: Top-Down Approach
5. Data Triangulation
6. Porter’s Five Forces Analysis
7. Value Chain Analysis
8. Global Robotic Angiography Systems Market Attractiveness Analysis By Technology
9. Global Robotic Angiography Systems Market Attractiveness Analysis By Application
10. Global Robotic Angiography Systems Market Attractiveness Analysis By Indication
11. Global Robotic Angiography Systems Market Attractiveness Analysis By End User
12. Global Robotic Angiography Systems Market Attractiveness Analysis By Region
13. Global Robotic Angiography Systems Market: Dynamics
14. Global Robotic Angiography Systems Market Share by Technology (2022 & 2030)
15. Global Robotic Angiography Systems Market Share by Application (2022 & 2030)
16. Global Robotic Angiography Systems Market Share by Indication (2022 & 2030)
17. Global Robotic Angiography Systems Market Share by End User (2022 & 2030)
18. Global Robotic Angiography Systems Market Share by Regions (2022 & 2030)
19. Global Robotic Angiography Systems Market Share by Company (2021)
This study forecasts revenue at global, regional, and country levels from 2019 to 2030. The Brainy Insights has segmented the global robotic angiography systems market based on below mentioned segments:
Global Robotic Angiography Systems Market by Technology:
Global Robotic Angiography Systems Market by Application:
Global Robotic Angiography Systems Market by Indication:
Global Robotic Angiography Systems Market by End User:
Global Robotic Angiography Systems Market by Region:
Research has its special purpose to undertake marketing efficiently. In this competitive scenario, businesses need information across all industry verticals; the information about customer wants, market demand, competition, industry trends, distribution channels etc. This information needs to be updated regularly because businesses operate in a dynamic environment. Our organization, The Brainy Insights incorporates scientific and systematic research procedures in order to get proper market insights and industry analysis for overall business success. The analysis consists of studying the market from a miniscule level wherein we implement statistical tools which helps us in examining the data with accuracy and precision.
Our research reports feature both; quantitative and qualitative aspects for any market. Qualitative information for any market research process are fundamental because they reveal the customer needs and wants, usage and consumption for any product/service related to a specific industry. This in turn aids the marketers/investors in knowing certain perceptions of the customers. Qualitative research can enlighten about the different product concepts and designs along with unique service offering that in turn, helps define marketing problems and generate opportunities. On the other hand, quantitative research engages with the data collection process through interviews, e-mail interactions, surveys and pilot studies. Quantitative aspects for the market research are useful to validate the hypotheses generated during qualitative research method, explore empirical patterns in the data with the help of statistical tools, and finally make the market estimations.
The Brainy Insights offers comprehensive research and analysis, based on a wide assortment of factual insights gained through interviews with CXOs and global experts and secondary data from reliable sources. Our analysts and industry specialist assume vital roles in building up statistical tools and analysis models, which are used to analyse the data and arrive at accurate insights with exceedingly informative research discoveries. The data provided by our organization have proven precious to a diverse range of companies, facilitating them to address issues such as determining which products/services are the most appealing, whether or not customers use the product in the manner anticipated, the purchasing intentions of the market and many others.
Our research methodology encompasses an idyllic combination of primary and secondary initiatives. Key phases involved in this process are listed below:

The phase involves the gathering and collecting of market data and its related information with the help of different sources & research procedures.

The data procurement stage involves in data gathering and collecting through various data sources.
This stage involves in extensive research. These data sources includes:
Purchased Database: Purchased databases play a crucial role in estimating the market sizes irrespective of the domain. Our purchased database includes:
Primary Research: The Brainy Insights interacts with leading companies and experts of the concerned domain to develop the analyst team’s market understanding and expertise. It improves and substantiates every single data presented in the market reports. Primary research mainly involves in telephonic interviews, E-mail interactions and face-to-face interviews with the raw material providers, manufacturers/producers, distributors, & independent consultants. The interviews that we conduct provides valuable data on market size and industry growth trends prevailing in the market. Our organization also conducts surveys with the various industry experts in order to gain overall insights of the industry/market. For instance, in healthcare industry we conduct surveys with the pharmacists, doctors, surgeons and nurses in order to gain insights and key information of a medical product/device/equipment which the customers are going to usage. Surveys are conducted in the form of questionnaire designed by our own analyst team. Surveys plays an important role in primary research because surveys helps us to identify the key target audiences of the market. Additionally, surveys helps to identify the key target audience engaged with the market. Our survey team conducts the survey by targeting the key audience, thus gaining insights from them. Based on the perspectives of the customers, this information is utilized to formulate market strategies. Moreover, market surveys helps us to understand the current competitive situation of the industry. To be precise, our survey process typically involve with the 360 analysis of the market. This analytical process begins by identifying the prospective customers for a product or service related to the market/industry to obtain data on how a product/service could fit into customers’ lives.

Secondary Research: The secondary data sources includes information published by the on-profit organizations such as World bank, WHO, company fillings, investor presentations, annual reports, national government documents, statistical databases, blogs, articles, white papers and others. From the annual report, we analyse a company’s revenue to understand the key segment and market share of that organization in a particular region. We analyse the company websites and adopt the product mapping technique which is important for deriving the segment revenue. In the product mapping method, we select and categorize the products offered by the companies catering to domain specific market, deduce the product revenue for each of the companies so as to get overall estimation of the market size. We also source data and analyses trends based on information received from supply side and demand side intermediaries in the value chain. The supply side denotes the data gathered from supplier, distributor, wholesaler and the demand side illustrates the data gathered from the end customers for respective market domain.

The supply side for a domain specific market is analysed by:
The demand side for the market is estimated through:
In-house Library: Apart from these third-party sources, we have our in-house library of qualitative and quantitative information. Our in-house database includes market data for various industry and domains. These data are updated on regular basis as per the changing market scenario. Our library includes, historic databases, internal audit reports and archives.
Sometimes there are instances where there is no metadata or raw data available for any domain specific market. For those cases, we use our expertise to forecast and estimate the market size in order to generate comprehensive data sets. Our analyst team adopt a robust research technique in order to produce the estimates:
Data Synthesis: This stage involves the analysis & mapping of all the information obtained from the previous step. It also involves in scrutinizing the data for any discrepancy observed while data gathering related to the market. The data is collected with consideration to the heterogeneity of sources. Robust scientific techniques are in place for synthesizing disparate data sets and provide the essential contextual information that can orient market strategies. The Brainy Insights has extensive experience in data synthesis where the data passes through various stages:


Market Deduction & Formulation: The final stage comprises of assigning data points at appropriate market spaces so as to deduce feasible conclusions. Analyst perspective & subject matter expert based holistic form of market sizing coupled with industry analysis also plays a crucial role in this stage.
This stage involves in finalization of the market size and numbers that we have collected from data integration step. With data interpolation, it is made sure that there is no gap in the market data. Successful trend analysis is done by our analysts using extrapolation techniques, which provide the best possible forecasts for the market.
Data Validation & Market Feedback: Validation is the most important step in the process. Validation & re-validation via an intricately designed process helps us finalize data-points to be used for final calculations.

The Brainy Insights interacts with leading companies and experts of the concerned domain to develop the analyst team’s market understanding and expertise. It improves and substantiates every single data presented in the market reports. The data validation interview and discussion panels are typically composed of the most experienced industry members. The participants include, however, are not limited to:
Moreover, we always validate our data and findings through primary respondents from all the major regions we are working on.


Free Customization
Fortune 500 Clients
Free Yearly Update On Purchase Of Multi/Corporate License
Companies Served Till Date