- +1-315-215-1633
- sales@thebrainyinsights.com

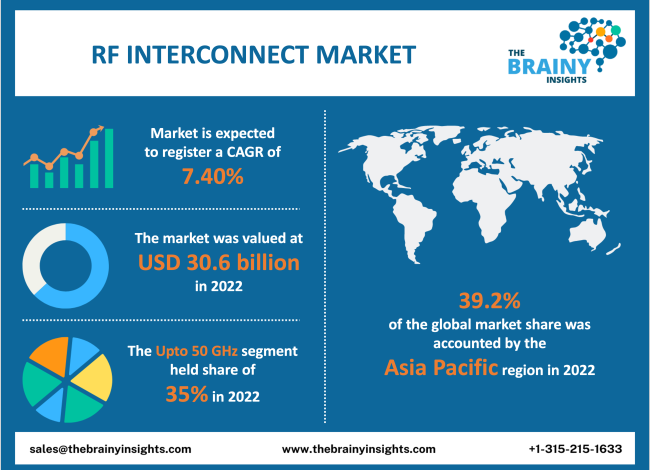
The global RF Interconnect market was valued at USD 30.6 billion in 2022 and growing at a CAGR of 7.40% from 2023 to 2032. The market is expected to reach USD 62.48 billion by 2032. The growing use of radio frequency cables in telecommunication, military, and aerospace, is pushing the demand for the RF interconnect market. In the military, RF cable assemblies recreate a critical role in mission-critical military electronic systems. RF cables are operated in hostile and stressful environments, delivering fast communication and less failure. Further, RF cable assemblies are performed in test measurement gear and laboratory as they are trustworthy and prompt. These advantages are pushing the use of RF cables in military applications and driving the RF interconnect market growth.
RF high-speed interconnection is operated in multiple electronic devices where signal transmission quality is essential in applications using high-speed digital signals. Radio Frequency interconnects the path that connects one device to another; RF-interconnect structures contain microstrip transmission lines, waveguides with RF connectors, adapters, coaxial cable assemblies, and attenuators. Multiple wireless communication systems need numerous RF to interconnect paths, like RF modules to antennas, sensitive sensor modules, and between networked devices. The RF hardware is highly digitized; more applications need high-speed digital signals for data communication between RF hardware. The latest high-speed digital technologies also leverage RF coaxial transmission lines and microstrip (stripline) transmission lines for connector interfaces, cabling, and chip fan-out. RF interconnect for high-speed digital applications require sound isolation and security from electromagnetic interference. Therefore, shielding and connector quality is very important. Moreover, numerous high-speed digital applications have high interconnect viscosity, demanding small pitch distances. Therefore, push-type connectors and connector assemblies with many RF connectors, like snap-connectors and pogo-pins, are common. An essential element is that decreasing the waiting time between separate parallel digital signals needs closely matched transmission line lengths, which is a design challenge considering the complexity of dense digital signal pathways.
Get an overview of this study by requesting a free sample
In July 2020 – TE Connectivity presented a new line of signal cables with a halogen-free design specially manufactured for different railway applications. The latest addition produces lighter weight, low power consumption, compact design, and low-cost installations.
The IT Offices and New Data Centers are promoting market growth- Technology giants substantially fund new data center infrastructures to increase global reach, especially across rising economies. The setup of additional information & technology (IT) hubs and data centers needs a vast network of cables like optical fiber cables, coaxial cables, and Ethernet cables, driving the global radio frequency to interconnect market growth. For example, Microsoft Corp. declared joining forces with the Spanish telecommunications company called Telefónica to open a recent data center region in Spain. The firm's target is to serve private and public businesses to promote digital transformation and improve their global strategic collaboration to serve Telefónica's consumers in multiple countries.
Problem With Coaxial Cable - A coaxial cable transmits a signal from a radio or tv transmitter to an antenna. The cable includes cords inside and an outer metal braid mesh separated by a foam-like insulation material known as the dielectric. Sometimes, a coaxial cable can get damaged when the dielectric becomes broken or separated, which allows the internal wire to contact the external braid producing a short that can damage the transmitter also another major disadvantage of coax is the fact that they are bulky.
Technological Advancements- The technology providers are working on cutting-edge designs that accommodate significantly limited space restrictions and produce spaceflight connectors that successfully work up to 70 GHz. Times Microwave’s new InstaBend high-performance microwave assemblies deliver a flexible preassembled design for interconnects between RF circuit cards, modules, and enclosure panels, allowing space-efficient implementation for higher frequencies.
The regions analyzed for the market include North America, Europe, South America, Asia Pacific, the Middle East, and Africa. Asia Pacific emerged as the largest market for the global RF Interconnect market, with a 39.2% share of the market revenue in 2022.
Promising government initiatives, increasing construction activities, advancing manufacturing facilities, and rising investments in recent infrastructures are some factors pushing the demand for RF interconnect elements in the Asia Pacific region. For instance, in August 2020, the PM of India launched a superior submarine optical fiber cable to join the Andaman and Nicobar Islands with the mainland parts. The government seeks to deliver high-speed internet data transfer to the residents and drive the regional economy.
Asia Pacific Region RF Interconnect Market Share in 2022 - 39.2%
www.thebrainyinsights.com
Check the geographical analysis of this market by requesting a free sample
The type segment is divided into RF cable assembly, RF coaxial adapter, RF cable, and RFconnector. The RF cable segment dominated the market, with a market share of around 27% in 2022. Cable assembly refers to the group of one or more cables circled in a single tube. The ends are installed with a connector and are attached to adapters. RF cable groups serve as transmission lines for RF signals traversing from one end in a system to another, for instance, equipment to the antenna, PC board to the antenna, equipment to equipment, PC board to a PC board.
The frequency segment is divided into Up to 50 GHz, up to 6 GHz, and Above 50 GHz. The upto 50 GHz segment dominated the market, with a market share of around 35% in 2022. The frequency range is called Super High Frequency (SHF). The Super High Frequency is the International Telecommunication Union (ITU) designation for RF between 3 and 50 gigahertz. Since the wavelengths range from one to ten centimeters, the frequency band is called the centimeter band or centimeter wave.
The end-user segment is divided into Construction, Aerospace & Défense, Oil & Gas, IT & Telecommunication, Consumer Electronics {High Tech Products, HVAC, Household Appliances, White Goods, Small Appliances}, Power Transmission & Distribution, Manufacturing, and Automotive. The consumer electronics segment dominated the market, with a market share of around 14% in 2022. The Constant expansion of high-tech devices and new HVAC equipment with additional components is set to support the customer electronics segment in gaining a substantial pace in the worldwide radio frequency cable industry.
| Attribute | Description |
|---|---|
| Market Size | Revenue (USD Billion), Volume (Units) |
| Market size value in 2022 | USD 30.6 Billion |
| Market size value in 2032 | USD 62.48 Billion |
| CAGR (2023 to 2032) | 7.40% |
| Historical data | 2019-2021 |
| Base Year | 2022 |
| Forecast | 2023-2032 |
| Regional Segments | The regions analyzed for the market are Asia Pacific, Europe, South America, North America, and Middle East & Africa. Furthermore, the regions are further analyzed at the country level. |
| Segments | Type, Frequency, End- User |
As per The Brainy Insights, the size of the RF Interconnect market was valued at USD 30.6 billion in 2022 to USD 62.48 billion by 2032.
Global RF Interconnect market is growing at a CAGR of 7.40% during the forecast period 2023-2032.
Asia Pacific region emerged as the largest market for the RF Interconnect market.
The IT offices and new data centers are promoting market growth.
1. Introduction
1.1. Objectives of the Study
1.2. Market Definition
1.3. Research Scope
1.4. Currency
1.5. Key Target Audience
2. Research Methodology and Assumptions
3. Executive Summary
4. Premium Insights
4.1. Porter’s Five Forces Analysis
4.2. Value Chain Analysis
4.3. Top Investment Pockets
4.3.1. Market Attractiveness Analysis by Type
4.3.2. Market Attractiveness Analysis by Frequency
4.3.3. Market Attractiveness Analysis by End-User
4.3.4. Market Attractiveness Analysis by Region
4.4. Industry Trends
5. Market Dynamics
5.1. Market Evaluation
5.2. Drivers
5.2.1. The IT offices and new data centers are promoting market growth
5.3. Restraints
5.3.1. Problem with coaxial cable restrict the market development
5.4. Opportunities
5.4.1. Technological advancements
6. Global RF Interconnect Market Analysis and Forecast, By Type:
6.1. Segment Overview
6.2. RF Cable Assembly
6.3. RF Coaxial Adapter
6.4. RF Cable
6.5. RF Connector
7. Global RF Interconnect Market Analysis and Forecast, By Frequency
7.1. Segment Overview
7.2. Up to 50 GHz
7.3. Up to 6 GHz
7.4. Above 50 GHz
8. Global RF Interconnect Market Analysis and Forecast, By End-User
8.1. Segment Overview
8.2. Construction
8.3. Aerospace & Défense
8.4. Oil & Gas
8.5. IT & Telecommunication
8.6. Consumer Electronics
8.7. Power Transmission & Distribution
8.8. Manufacturing
8.9. Automotive
9. Global RF Interconnect Market Analysis and Forecast, By Regional Analysis
9.1. Segment Overview
9.2. North America
9.2.1. U.S.
9.2.2. Canada
9.2.3. Mexico
9.3. Europe
9.3.1. Germany
9.3.2. France
9.3.3. U.K.
9.3.4. Italy
9.3.5. Spain
9.4. Asia-Pacific
9.4.1. Japan
9.4.2. China
9.4.3. India
9.5. South America
9.5.1. Brazil
9.6. Middle East and Africa
9.6.1. UAE
9.6.2. South Africa
10. Global RF Interconnect Market-Competitive Landscape
10.1. Overview
10.2. Market Share of Key Players in the RF Interconnect Market
10.2.1. Global Company Market Share
10.2.2. North America Company Market Share
10.2.3. Europe Company Market Share
10.2.4. APAC Company Market Share
10.3. Competitive Situations and Trends
10.3.1. Product Launches and Developments
10.3.2. Partnerships, Collaborations, and Agreements
10.3.3. Mergers & Acquisitions
10.3.4. Expansions
11. Company Profiles
11.1. Amphenol RF
11.1.1. Business Overview
11.1.2. Company Snapshot
11.1.3. Company Market Share Analysis
11.1.4. Company Product Portfolio
11.1.5. Recent Developments
11.1.6. SWOT Analysis
11.2. Cobham Advanced Electronic Solutions.
11.2.1. Business Overview
11.2.2. Company Snapshot
11.2.3. Company Market Share Analysis
11.2.4. Company Product Portfolio
11.2.5. Recent Developments
11.2.6. SWOT Analysis
11.3. Corning Incorporated
11.3.1. Business Overview
11.3.2. Company Snapshot
11.3.3. Company Market Share Analysis
11.3.4. Company Product Portfolio
11.3.5. Recent Developments
11.3.6. SWOT Analysis
11.4. Delta Electronics, Inc.
11.4.1. Business Overview
11.4.2. Company Snapshot
11.4.3. Company Market Share Analysis
11.4.4. Company Product Portfolio
11.4.5. Recent Developments
11.4.6. SWOT Analysis
11.5. DigiLens Inc
11.5.1. Business Overview
11.5.2. Company Snapshot
11.5.3. Company Market Share Analysis
11.5.4. Company Product Portfolio
11.5.5. Recent Developments
11.5.6. SWOT Analysis
11.6. Ducommun Incorporated
11.6.1. Business Overview
11.6.2. Company Snapshot
11.6.3. Company Market Share Analysis
11.6.4. Company Product Portfolio
11.6.5. Recent Developments
11.6.6. SWOT Analysis
11.7. ETL Systems Ltd.
11.7.1. Business Overview
11.7.2. Company Snapshot
11.7.3. Company Market Share Analysis
11.7.4. Company Product Portfolio
11.7.5. Recent Developments
11.7.6. SWOT Analysis
11.8. Flann Microwave Ltd
11.8.1. Business Overview
11.8.2. Company Snapshot
11.8.3. Company Market Share Analysis
11.8.4. Company Product Portfolio
11.8.5. Recent Developments
11.8.6. SWOT Analysis
11.9. Global Invacom
11.9.1. Business Overview
11.9.2. Company Snapshot
11.9.3. Company Market Share Analysis
11.9.4. Company Product Portfolio
11.9.5. Recent Developments
11.9.6. SWOT Analysis
11.10. HUBER + SUHNER.
11.10.1. Business Overview
11.10.2. Company Snapshot
11.10.3. Company Market Share Analysis
11.10.4. Company Product Portfolio
11.10.5. Recent Developments
11.10.6. SWOT Analysis
11.11. Jupiter Microwave Components Inc.
11.11.1. Business Overview
11.11.2. Company Snapshot
11.11.3. Company Market Share Analysis
11.11.4. Company Product Portfolio
11.11.5. Recent Developments
11.11.6. SWOT Analysis
11.12. Penn Engineering Components.
11.12.1. Business Overview
11.12.2. Company Snapshot
11.12.3. Company Market Share Analysis
11.12.4. Company Product Portfolio
11.12.5. Recent Developments
11.12.6. SWOT Analysis
11.13. Quantic Electronics
11.13.1. Business Overview
11.13.2. Company Snapshot
11.13.3. Company Market Share Analysis
11.13.4. Company Product Portfolio
11.13.5. Recent Developments
11.13.6. SWOT Analysis
11.14. Radiall
11.14.1. Business Overview
11.14.2. Company Snapshot
11.14.3. Company Market Share Analysis
11.14.4. Company Product Portfolio
11.14.5. Recent Developments
11.14.6. SWOT Analysis
11.15. Samtec
11.15.1. Business Overview
11.15.2. Company Snapshot
11.15.3. Company Market Share Analysis
11.15.4. Company Product Portfolio
11.15.5. Recent Developments
11.15.6. SWOT Analysis
11.16. Smiths Interconnect
11.16.1. Business Overview
11.16.2. Company Snapshot
11.16.3. Company Market Share Analysis
11.16.4. Company Product Portfolio
11.16.5. Recent Developments
11.16.6. SWOT Analysis
11.17. W.L. Gore & Associates, Inc
11.17.1. Business Overview
11.17.2. Company Snapshot
11.17.3. Company Market Share Analysis
11.17.4. Company Product Portfolio
11.17.5. Recent Developments
11.17.6. SWOT Analysis
List of Table
1. Global RF Interconnect Market, By Type, 2019-2032 (USD Billion)
2. Global RF Cable Assembly RF Interconnect Market, By Region, 2019-2032 (USD Billion)
3. Global RF Coaxial Adapter RF Interconnect Market, By Region, 2019-2032 (USD Billion)
4. Global RF Cable RF Interconnect Market, By Region, 2019-2032 (USD Billion)
5. Global RF Connector RF Interconnect Market, By Region, 2019-2032 (USD Billion)
6. Global RF Interconnect Market, By Frequency, 2019-2032 (USD Billion)
7. Global Up to 50 GHz RF Interconnect Market, By Region, 2019-2032 (USD Billion)
8. Global Up to 6 GHz RF Interconnect Market, By Region, 2019-2032 (USD Billion)
9. Global Above 50 GHz RF Interconnect Market, By Region, 2019-2032 (USD Billion)
10. Global RF Interconnect Market, By End-User, 2019-2032 (USD Billion)
11. Global Aerospace & Défense RF Interconnect Market, By Region, 2019-2032 (USD Billion)
12. Global Oil & Gas RF Interconnect Market, By Region, 2019-2032 (USD Billion)
13. Global IT & Telecommunication RF Interconnect Market, By Region, 2019-2032 (USD Billion)
14. Global Consumer Electronics RF Interconnect Market, By Region, 2019-2032 (USD Billion)
15. Global Power Transmission & Distribution RF Interconnect Market, By Region, 2019-2032 (USD Billion)
16. Global Manufacturing RF Interconnect Market, By Region, 2019-2032 (USD Billion)
17. Global Automotive RF Interconnect Market, By Region, 2019-2032 (USD Billion)
18. North America RF Interconnect Market, By Product, 2019-2032 (USD Billion)
19. North America RF Interconnect Market, By Frequency, 2019-2032 (USD Billion)
20. North America RF Interconnect Market, By End-User, 2019-2032 (USD Billion)
21. U.S. RF Interconnect Market, By Product, 2019-2032 (USD Billion)
22. U.S. RF Interconnect Market, By Frequency, 2019-2032 (USD Billion)
23. U.S. RF Interconnect Market, By End-User, 2019-2032 (USD Billion)
24. Canada RF Interconnect Market, By Product, 2019-2032 (USD Billion)
25. Canada RF Interconnect Market, By Frequency, 2019-2032 (USD Billion)
26. Canada RF Interconnect Market, By End-User, 2019-2032 (USD Billion)
27. Mexico RF Interconnect Market, By Product, 2019-2032 (USD Billion)
28. Mexico RF Interconnect Market, By Frequency, 2019-2032 (USD Billion)
29. Mexico RF Interconnect Market, By End-User, 2019-2032 (USD Billion)
30. Europe RF Interconnect Market, By Product, 2019-2032 (USD Billion)
31. Europe RF Interconnect Market, By Frequency, 2019-2032 (USD Billion)
32. Europe RF Interconnect Market, By End-User, 2019-2032 (USD Billion)
33. Germany RF Interconnect Market, By Product, 2019-2032 (USD Billion)
34. Germany RF Interconnect Market, By Frequency, 2019-2032 (USD Billion)
35. Germany RF Interconnect Market, By End-User, 2019-2032 (USD Billion)
36. France RF Interconnect Market, By Product 2019-2032 (USD Billion)
37. France RF Interconnect Market, By Frequency, 2019-2032 (USD Billion)
38. France RF Interconnect Market, By End-User, 2019-2032 (USD Billion)
39. U.K. RF Interconnect Market, By Product, 2019-2032 (USD Billion)
40. U.K. RF Interconnect Market, By Frequency, 2019-2032 (USD Billion)
41. U.K. RF Interconnect Market, By End-User, 2019-2032 (USD Billion)
42. Italy RF Interconnect Market, By Product, 2019-2032 (USD Billion)
43. Italy RF Interconnect Market, By Frequency, 2019-2032 (USD Billion)
44. Italy RF Interconnect Market, By End-User, 2019-2032 (USD Billion)
45. Spain RF Interconnect Market, By Product, 2019-2032 (USD Billion)
46. Spain RF Interconnect Market, By Frequency, 2019-2032 (USD Billion)
47. Spain RF Interconnect Market, By End-User, 2019-2032 (USD Billion)
48. Asia Pacific RF Interconnect Market, By Product, 2019-2032 (USD Billion)
49. Asia Pacific RF Interconnect Market, By Frequency, 2019-2032 (USD Billion)
50. Asia Pacific RF Interconnect Market, By End-User, 2019-2032 (USD Billion)
51. Japan RF Interconnect Market, By Product, 2019-2032 (USD Billion)
52. Japan RF Interconnect Market, By Frequency, 2019-2032 (USD Billion)
53. Japan RF Interconnect Market, By End-User, 2019-2032 (USD Billion)
54. China RF Interconnect Market, By Product 2019-2032 (USD Billion)
55. China RF Interconnect Market, By Frequency, 2019-2032 (USD Billion)
56. China RF Interconnect Market, By End-User, 2019-2032 (USD Billion)
57. India RF Interconnect Market, By Product 2019-2032 (USD Billion)
58. India RF Interconnect Market, By Frequency, 2019-2032 (USD Billion)
59. India RF Interconnect Market, By End-User, 2019-2032 (USD Billion)
60. South America RF Interconnect Market, By Product, 2019-2032 (USD Billion)
61. South America RF Interconnect Market, By Frequency, 2019-2032 (USD Billion)
62. South America RF Interconnect Market, By End-User, 2019-2032 (USD Billion)
63. Brazil RF Interconnect Market, By Product 2019-2032 (USD Billion)
64. Brazil RF Interconnect Market, By Frequency, 2019-2032 (USD Billion)
65. Brazil RF Interconnect Market, By End-User, 2019-2032 (USD Billion)
66. Middle East and Africa RF Interconnect Market, By Product, 2019-2032 (USD Billion)
67. Middle East and Africa RF Interconnect Market, By Frequency, 2019-2032 (USD Billion)
68. Middle East and Africa RF Interconnect Market, By End-User, 2019-2032 (USD Billion)
69. UAE RF Interconnect Market, By Product, 2019-2032 (USD Billion)
70. UAE RF Interconnect Market, By Frequency, 2019-2032 (USD Billion)
71. UAE RF Interconnect Market, By End-User, 2019-2032 (USD Billion)
72. South Africa RF Interconnect Market, By Product 2019-2032 (USD Billion)
73. South Africa RF Interconnect Market, By Frequency, 2019-2032 (USD Billion)
74. South Africa RF Interconnect Market, By End-User, 2019-2032 (USD Billion)
List of Figures
1. Global RF Interconnect Market Segmentation
2. RF Interconnect Market: Research Methodology
3. Market Size Estimation Methodology: Bottom-Up Approach
4. Market Size Estimation Methodology: Top-Down Approach
5. Data Triangulation
6. Porter’s Five Forces Analysis
7. Value Chain Analysis
8. Global RF Interconnect Market Attractiveness Analysis by Product
9. Global RF Interconnect Market Attractiveness Analysis by Frequency
10. Global RF Interconnect Market Attractiveness Analysis by End-User
11. Global RF Interconnect Market Attractiveness Analysis by Region
12. Global RF Interconnect Market: Dynamics
13. Global RF Interconnect Market Share by Product (2022 & 2032)
14. Global RF Interconnect Market Share by Frequency (2022 & 2032)
15. Global RF Interconnect Market Share by End-User (2022 & 2032)
16. Global RF Interconnect Market Share by Regions (2022 & 2032)
17. Global RF Interconnect Market Share by Company (2022)
This study forecasts revenue at global, regional, and country levels from 2019 to 2032. The Brainy Insights has segmented the global RF Interconnect market based on below mentioned segments:
Global RF Interconnect Market Type:
Global RF Interconnect Market Frequency:
Global RF Interconnect Market End-User:
Global RF Interconnect Market by Region:
Research has its special purpose to undertake marketing efficiently. In this competitive scenario, businesses need information across all industry verticals; the information about customer wants, market demand, competition, industry trends, distribution channels etc. This information needs to be updated regularly because businesses operate in a dynamic environment. Our organization, The Brainy Insights incorporates scientific and systematic research procedures in order to get proper market insights and industry analysis for overall business success. The analysis consists of studying the market from a miniscule level wherein we implement statistical tools which helps us in examining the data with accuracy and precision.
Our research reports feature both; quantitative and qualitative aspects for any market. Qualitative information for any market research process are fundamental because they reveal the customer needs and wants, usage and consumption for any product/service related to a specific industry. This in turn aids the marketers/investors in knowing certain perceptions of the customers. Qualitative research can enlighten about the different product concepts and designs along with unique service offering that in turn, helps define marketing problems and generate opportunities. On the other hand, quantitative research engages with the data collection process through interviews, e-mail interactions, surveys and pilot studies. Quantitative aspects for the market research are useful to validate the hypotheses generated during qualitative research method, explore empirical patterns in the data with the help of statistical tools, and finally make the market estimations.
The Brainy Insights offers comprehensive research and analysis, based on a wide assortment of factual insights gained through interviews with CXOs and global experts and secondary data from reliable sources. Our analysts and industry specialist assume vital roles in building up statistical tools and analysis models, which are used to analyse the data and arrive at accurate insights with exceedingly informative research discoveries. The data provided by our organization have proven precious to a diverse range of companies, facilitating them to address issues such as determining which products/services are the most appealing, whether or not customers use the product in the manner anticipated, the purchasing intentions of the market and many others.
Our research methodology encompasses an idyllic combination of primary and secondary initiatives. Key phases involved in this process are listed below:

The phase involves the gathering and collecting of market data and its related information with the help of different sources & research procedures.

The data procurement stage involves in data gathering and collecting through various data sources.
This stage involves in extensive research. These data sources includes:
Purchased Database: Purchased databases play a crucial role in estimating the market sizes irrespective of the domain. Our purchased database includes:
Primary Research: The Brainy Insights interacts with leading companies and experts of the concerned domain to develop the analyst team’s market understanding and expertise. It improves and substantiates every single data presented in the market reports. Primary research mainly involves in telephonic interviews, E-mail interactions and face-to-face interviews with the raw material providers, manufacturers/producers, distributors, & independent consultants. The interviews that we conduct provides valuable data on market size and industry growth trends prevailing in the market. Our organization also conducts surveys with the various industry experts in order to gain overall insights of the industry/market. For instance, in healthcare industry we conduct surveys with the pharmacists, doctors, surgeons and nurses in order to gain insights and key information of a medical product/device/equipment which the customers are going to usage. Surveys are conducted in the form of questionnaire designed by our own analyst team. Surveys plays an important role in primary research because surveys helps us to identify the key target audiences of the market. Additionally, surveys helps to identify the key target audience engaged with the market. Our survey team conducts the survey by targeting the key audience, thus gaining insights from them. Based on the perspectives of the customers, this information is utilized to formulate market strategies. Moreover, market surveys helps us to understand the current competitive situation of the industry. To be precise, our survey process typically involve with the 360 analysis of the market. This analytical process begins by identifying the prospective customers for a product or service related to the market/industry to obtain data on how a product/service could fit into customers’ lives.

Secondary Research: The secondary data sources includes information published by the on-profit organizations such as World bank, WHO, company fillings, investor presentations, annual reports, national government documents, statistical databases, blogs, articles, white papers and others. From the annual report, we analyse a company’s revenue to understand the key segment and market share of that organization in a particular region. We analyse the company websites and adopt the product mapping technique which is important for deriving the segment revenue. In the product mapping method, we select and categorize the products offered by the companies catering to domain specific market, deduce the product revenue for each of the companies so as to get overall estimation of the market size. We also source data and analyses trends based on information received from supply side and demand side intermediaries in the value chain. The supply side denotes the data gathered from supplier, distributor, wholesaler and the demand side illustrates the data gathered from the end customers for respective market domain.

The supply side for a domain specific market is analysed by:
The demand side for the market is estimated through:
In-house Library: Apart from these third-party sources, we have our in-house library of qualitative and quantitative information. Our in-house database includes market data for various industry and domains. These data are updated on regular basis as per the changing market scenario. Our library includes, historic databases, internal audit reports and archives.
Sometimes there are instances where there is no metadata or raw data available for any domain specific market. For those cases, we use our expertise to forecast and estimate the market size in order to generate comprehensive data sets. Our analyst team adopt a robust research technique in order to produce the estimates:
Data Synthesis: This stage involves the analysis & mapping of all the information obtained from the previous step. It also involves in scrutinizing the data for any discrepancy observed while data gathering related to the market. The data is collected with consideration to the heterogeneity of sources. Robust scientific techniques are in place for synthesizing disparate data sets and provide the essential contextual information that can orient market strategies. The Brainy Insights has extensive experience in data synthesis where the data passes through various stages:


Market Deduction & Formulation: The final stage comprises of assigning data points at appropriate market spaces so as to deduce feasible conclusions. Analyst perspective & subject matter expert based holistic form of market sizing coupled with industry analysis also plays a crucial role in this stage.
This stage involves in finalization of the market size and numbers that we have collected from data integration step. With data interpolation, it is made sure that there is no gap in the market data. Successful trend analysis is done by our analysts using extrapolation techniques, which provide the best possible forecasts for the market.
Data Validation & Market Feedback: Validation is the most important step in the process. Validation & re-validation via an intricately designed process helps us finalize data-points to be used for final calculations.

The Brainy Insights interacts with leading companies and experts of the concerned domain to develop the analyst team’s market understanding and expertise. It improves and substantiates every single data presented in the market reports. The data validation interview and discussion panels are typically composed of the most experienced industry members. The participants include, however, are not limited to:
Moreover, we always validate our data and findings through primary respondents from all the major regions we are working on.


Free Customization
Fortune 500 Clients
Free Yearly Update On Purchase Of Multi/Corporate License
Companies Served Till Date