- +1-315-215-1633
- sales@thebrainyinsights.com

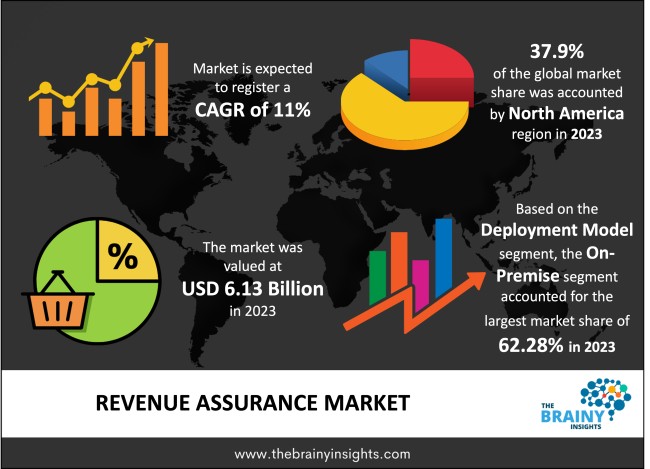
Global revenue assurance market is expected to reach USD 17.40 Billion by 2033, at a CAGR of 11% from 2024 to 2033. An upsurge in the complication of networks & services coupled with the rising use of technology by fraudsters is driving the expansion of the revenue assurance market. The revenue assurance market will grow due to the rapidly growing digital transformation and adoption of automation. Along with this, integrating the latest technologies will also help the revenue assurance market grow in the future.
Revenue assurance is applying a software solution that allows a communications service provider (CSP) to capture revenue for all services generated accurately. Revenue assurance sometimes expands into business assurance, service assurance, network assurance, risk management & fraud management. Revenue assurance is primarily strongly connected to billing assurance. A dedicated revenue assurance department may essay some of the processes associated with recognizing, curing, or preventing errors. However, responsibility for revenue assurance is frequently diffuse & varies significantly with the provider's organizational structure. The revenue assurance techniques applied in practice protect a wide range, from analysis & execution of enterprise controls to mechanical data interrogation. The revenue assurance process can be considered an auditing process in many ways. The revenue assurance processes can protect all departments & service lines in a telecommunications organization. One of the primary focus areas of a revenue assurance tool is to compare XDRs or CDRs from 2 distinct sources & check if all the records from the first system have appropriately moved to the second system keeping the proper business rules in regard. A telecom institution's revenue chain is usually a highly complex set of inter-related technologies & methods providing seamless services to the end customer. Revenue Assurance is highly accurate and transparent. These two qualities maintain the customer's trust and make their billing experience easy. Revenue Assurance reduces the chances of mistakes in billing. It also helps companies assume many types of risks. Revenue Assurance identifies and resolves issues related to revenue.
Get an overview of this study by requesting a free sample
The rise of the subscription economy is driving the revenue assurance market. Moreover, the demand for revenue assurance solutions increases as the number of users making real-time transactions boosts. Further, the revenue assurance solutions are intended to improve organizational competence while maintaining revenue capacity. Furthermore, the growing number of online & mobile banking network services will increase the market's growth in the analysis period.
The aging workforce is possibly one of the foremost causes of the skilled labor shortage. Further, monitoring fraud transactions at an early phase is also a challenge for companies that can limit the growth of the revenue assurance market.
New technologies involving the cloud, the Internet of Things (IoT), SDN/NFV, and 4G/5G create opportunities for operators to launch new industry services & models. The introduction of advanced technologies & mechanisms like real-time revenue assurance is expected to expand the market growth in the years to come.
End-use enterprises often lack their responsibility towards empowering their refuse & resources to spend extra in investing in revenue leakages services and solutions, which is anticipated to hinder the demand in the future years. Additionally, the shortage of emphasis on modification often leads to extreme instances, which have a financial influence, such as unanticipated revenue leakages that affect billing due to alterations in the web, mainly if risk management activity is weak or absent. This is further projected to be a challenge to market growth.
The global revenue assurance market has been segmented based on deployment model, component, vertical and regions.
The regions analyzed for the market include North America, Europe, South America, Asia Pacific, and the Middle East and Africa. North America region emerged as the largest market for the global revenue assurance market with a 37.9% share of the market revenue in 2023.
North America Region Revenue Assurance Market Share in 2023 - 37.9%
www.thebrainyinsights.com
Check the geographical analysis of this market by requesting a free sample
The key players are now concentrating on implementing strategies such as adopting new technology, product innovations, mergers & acquisitions, joint venture, alliances, and partnerships to improve their market position in the global revenue assurance industry.
For example, in January 2020, Subex partnered with Jawwal, a Palestine-based MNO, to provide its ROC revenue assurance platform while expanding the partnership for the forthcoming five years. The partnership includes implementing the ROC RA platform, allowing Jawwal to protect its recently launched digital services, optimizing revenue streams, and diminishing risks.
As per The Brainy Insights, the size of the revenue assurance market was valued at USD 6.13 Billion in 2023 to USD 17.40 Billion by 2033.
Global revenue assurance market is growing at a CAGR of 11% during the forecast period 2024-2033.
North America region emerged as the largest market for the revenue assurance.
The market's growth will be influenced by rise of the subscription economy.
Dearth of skilled persons and high cost of solution could hamper the market growth.
Integration of advanced technologies will provide huge opportunities to the market.
1. Introduction
1.1. Objectives of the Study
1.2. Market Definition
1.3. Research Scope
1.4. Currency
1.5. Key Target Audience
2. Research Methodology and Assumptions
3. Executive Summary
4. Premium Insights
4.1. Porter’s Five Forces Analysis
4.2. Value Chain Analysis
4.3. Top Investment Pockets
4.3.1. Market Attractiveness Analysis By Deployment Model
4.3.2. Market Attractiveness Analysis By Component
4.3.3. Market Attractiveness Analysis By Vertical
4.3.4. Market Attractiveness Analysis By Region
4.4. Industry Trends
5. Market Dynamics
5.1. Market Evaluation
5.2. Drivers
5.2.1. Rise of the subscription economy
5.2.2. Increasing incidence of revenue leakages
5.2.3. Expansion in the generation of transaction data
5.3. Restraints
5.3.1. Economic slowdown and currency fluctuations
5.3.2. Lack of skilled personnel
5.4. Opportunities
5.4.1. Integration of advanced technologies
6. Global Revenue Assurance Market Analysis and Forecast, By Deployment Model
6.1. Segment Overview
6.2. Cloud
6.3. On-Premise
7. Global Revenue Assurance Market Analysis and Forecast, By Component
7.1. Segment Overview
7.2. Services
7.3. Software
8. Global Revenue Assurance Market Analysis and Forecast, By Vertical
8.1. Segment Overview
8.2. Retail
8.3. Telecom
8.4. BFSI
8.5. Healthcare
8.6. Energy & Utilities
8.7. Others
9. Global Revenue Assurance Market Analysis and Forecast, By Regional Analysis
9.1. Segment Overview
9.2. North America
9.2.1. U.S.
9.2.2. Canada
9.2.3. Mexico
9.3. Europe
9.3.1. Germany
9.3.2. France
9.3.3. U.K.
9.3.4. Italy
9.3.5. Spain
9.4. Asia-Pacific
9.4.1. Japan
9.4.2. China
9.4.3. India
9.5. South America
9.5.1. Brazil
9.6. Middle East and Africa
9.6.1. UAE
9.6.2. South Africa
10. Global Revenue Assurance Market-Competitive Landscape
10.1. Overview
10.2. Market Share of Key Players in the Revenue Assurance Market
10.2.1. Global Company Market Share
10.2.2. North America Company Market Share
10.2.3. Europe Company Market Share
10.2.4. APAC Company Market Share
10.3. Competitive Situations and Trends
10.3.1. Product Launches and Developments
10.3.2. Partnerships, Collaborations, and Agreements
10.3.3. Mergers & Acquisitions
10.3.4. Expansions
11. Company Profiles
11.1. Araxxe
11.1.1. Business Overview
11.1.2. Company SnapsServices
11.1.3. Company Market Share Analysis
11.1.4. Company Product Portfolio
11.1.5. Recent Developments
11.1.6. SWOT Analysis
11.2. Accenture plc
11.2.1. Business Overview
11.2.2. Company SnapsServices
11.2.3. Company Market Share Analysis
11.2.4. Company Product Portfolio
11.2.5. Recent Developments
11.2.6. SWOT Analysis
11.3. Amdocs
11.3.1. Business Overview
11.3.2. Company SnapsServices
11.3.3. Company Market Share Analysis
11.3.4. Company Product Portfolio
11.3.5. Recent Developments
11.3.6. SWOT Analysis
11.4. Subex Limited
11.4.1. Business Overview
11.4.2. Company SnapsServices
11.4.3. Company Market Share Analysis
11.4.4. Company Product Portfolio
11.4.5. Recent Developments
11.4.6. SWOT Analysis
11.5. Hewlett Packard Enterprise Development LP
11.5.1. Business Overview
11.5.2. Company SnapsServices
11.5.3. Company Market Share Analysis
11.5.4. Company Product Portfolio
11.5.5. Recent Developments
11.5.6. SWOT Analysis
11.6. Tech Mahindra Limited
11.6.1. Business Overview
11.6.2. Company SnapsServices
11.6.3. Company Market Share Analysis
11.6.4. Company Product Portfolio
11.6.5. Recent Developments
11.6.6. SWOT Analysis
11.7. TEOCO
11.7.1. Business Overview
11.7.2. Company SnapsServices
11.7.3. Company Market Share Analysis
11.7.4. Company Product Portfolio
11.7.5. Recent Developments
11.7.6. SWOT Analysis
11.8. Telefonaktiebolaget LM Ericsson
11.8.1. Business Overview
11.8.2. Company SnapsServices
11.8.3. Company Market Share Analysis
11.8.4. Company Product Portfolio
11.8.5. Recent Developments
11.8.6. SWOT Analysis
11.9. International Business Machines Corporation
11.9.1. Business Overview
11.9.2. Company SnapsServices
11.9.3. Company Market Share Analysis
11.9.4. Company Product Portfolio
11.9.5. Recent Developments
11.9.6. SWOT Analysis
11.10. Tata Consultancy Services Limited
11.10.1. Business Overview
11.10.2. Company SnapsServices
11.10.3. Company Market Share Analysis
11.10.4. Company Product Portfolio
11.10.5. Recent Developments
11.10.6. SWOT Analysis
11.11. WeDo Technologies
11.11.1. Business Overview
11.11.2. Company SnapsServices
11.11.3. Company Market Share Analysis
11.11.4. Company Product Portfolio
11.11.5. Recent Developments
11.11.6. SWOT Analysis
List of Table
1. Global Revenue Assurance Market, By Deployment Model, 2020-2033 (USD Billion)
2. Global Cloud Revenue Assurance Market, By Region, 2020-2033 (USD Billion)
3. Global On-Premise Revenue Assurance Market, By Region, 2020-2033 (USD Billion)
4. Global Revenue Assurance Market, By Component, 2020-2033 (USD Billion)
5. Global Services Revenue Assurance Market, By Region, 2020-2033 (USD Billion)
6. Global Software Revenue Assurance Market, By Region, 2020-2033 (USD Billion)
7. Global Revenue Assurance Market, By Vertical , 2020-2033 (USD Billion)
8. Global Retail Revenue Assurance Market, By Region, 2020-2033 (USD Billion)
9. Global Telecom Revenue Assurance Market, By Region, 2020-2033 (USD Billion)
10. Global BFSI Revenue Assurance Market, By Region, 2020-2033 (USD Billion)
11. Global Healthcare Revenue Assurance Market, By Region, 2020-2033 (USD Billion)
12. Global Energy & Utilities Revenue Assurance Market, By Region, 2020-2033 (USD Billion)
13. Global Others Revenue Assurance Market, By Region, 2020-2033 (USD Billion)
14. Global Revenue Assurance Market, By Region, 2020-2033 (USD Billion)
15. North America Revenue Assurance Market, By Deployment Model, 2020-2033 (USD Billion)
16. North America Revenue Assurance Market, By Component, 2020-2033 (USD Billion)
17. North America Revenue Assurance Market, By Vertical , 2020-2033 (USD Billion)
18. U.S. Revenue Assurance Market, By Deployment Model, 2020-2033 (USD Billion)
19. U.S. Revenue Assurance Market, By Component, 2020-2033 (USD Billion)
20. U.S. Revenue Assurance Market, By Vertical , 2020-2033 (USD Billion)
21. Canada Revenue Assurance Market, By Deployment Model, 2020-2033 (USD Billion)
22. Canada Revenue Assurance Market, By Component, 2020-2033 (USD Billion)
23. Canada Revenue Assurance Market, By Vertical , 2020-2033 (USD Billion)
24. Mexico Revenue Assurance Market, By Deployment Model, 2020-2033 (USD Billion)
25. Mexico Revenue Assurance Market, By Component, 2020-2033 (USD Billion)
26. Mexico Revenue Assurance Market, By Vertical , 2020-2033 (USD Billion)
27. Europe Revenue Assurance Market, By Deployment Model, 2020-2033 (USD Billion)
28. Europe Revenue Assurance Market, By Component, 2020-2033 (USD Billion)
29. Europe Revenue Assurance Market, By Vertical , 2020-2033 (USD Billion)
30. Germany Revenue Assurance Market, By Deployment Model, 2020-2033 (USD Billion)
31. Germany Revenue Assurance Market, By Component, 2020-2033 (USD Billion)
32. Germany Revenue Assurance Market, By Vertical , 2020-2033 (USD Billion)
33. France Revenue Assurance Market, By Deployment Model, 2020-2033 (USD Billion)
34. France Revenue Assurance Market, By Component, 2020-2033 (USD Billion)
35. France Revenue Assurance Market, By Vertical , 2020-2033 (USD Billion)
36. U.K. Revenue Assurance Market, By Deployment Model, 2020-2033 (USD Billion)
37. U.K. Revenue Assurance Market, By Component, 2020-2033 (USD Billion)
38. U.K. Revenue Assurance Market, By Vertical , 2020-2033 (USD Billion)
39. Italy Revenue Assurance Market, By Deployment Model, 2020-2033 (USD Billion)
40. Italy Revenue Assurance Market, By Component, 2020-2033 (USD Billion)
41. Italy Revenue Assurance Market, By Vertical , 2020-2033 (USD Billion)
42. Spain Revenue Assurance Market, By Deployment Model, 2020-2033 (USD Billion)
43. Spain Revenue Assurance Market, By Component, 2020-2033 (USD Billion)
44. Spain Revenue Assurance Market, By Vertical , 2020-2033 (USD Billion)
45. Asia Pacific Revenue Assurance Market, By Deployment Model, 2020-2033 (USD Billion)
46. Asia Pacific Revenue Assurance Market, By Component, 2020-2033 (USD Billion)
47. Asia Pacific Revenue Assurance Market, By Vertical , 2020-2033 (USD Billion)
48. Japan Revenue Assurance Market, By Deployment Model, 2020-2033 (USD Billion)
49. Japan Revenue Assurance Market, By Component, 2020-2033 (USD Billion)
50. Japan Revenue Assurance Market, By Vertical , 2020-2033 (USD Billion)
51. China Revenue Assurance Market, By Deployment Model, 2020-2033 (USD Billion)
52. China Revenue Assurance Market, By Component, 2020-2033 (USD Billion)
53. China Revenue Assurance Market, By Vertical , 2020-2033 (USD Billion)
54. India Revenue Assurance Market, By Deployment Model, 2020-2033 (USD Billion)
55. India Revenue Assurance Market, By Component, 2020-2033 (USD Billion)
56. India Revenue Assurance Market, By Vertical , 2020-2033 (USD Billion)
57. South America Revenue Assurance Market, By Deployment Model, 2020-2033 (USD Billion)
58. South America Revenue Assurance Market, By Component, 2020-2033 (USD Billion)
59. South America Revenue Assurance Market, By Vertical , 2020-2033 (USD Billion)
60. Brazil Revenue Assurance Market, By Deployment Model, 2020-2033 (USD Billion)
61. Brazil Revenue Assurance Market, By Component, 2020-2033 (USD Billion)
62. Brazil Revenue Assurance Market, By Vertical , 2020-2033 (USD Billion)
63. Middle East and Africa Revenue Assurance Market, By Deployment Model, 2020-2033 (USD Billion)
64. Middle East and Africa Revenue Assurance Market, By Component, 2020-2033 (USD Billion)
65. Middle East and Africa Revenue Assurance Market, By Vertical , 2020-2033 (USD Billion)
66. UAE Revenue Assurance Market, By Deployment Model, 2020-2033 (USD Billion)
67. UAE Revenue Assurance Market, By Component, 2020-2033 (USD Billion)
68. UAE Revenue Assurance Market, By Vertical , 2020-2033 (USD Billion)
69. South Africa Revenue Assurance Market, By Deployment Model, 2020-2033 (USD Billion)
70. South Africa Revenue Assurance Market, By Component, 2020-2033 (USD Billion)
71. South Africa Revenue Assurance Market, By Vertical , 2020-2033 (USD Billion)
List of Figures
1. Global Revenue Assurance Market Segmentation
2. Revenue Assurance Market: Research Methodology
3. Market Size Estimation Methodology: Bottom-Up Approach
4. Market Size Estimation Methodology: Top-Down Approach
5. Data Triangulation
6. Porter’s Five Forces Analysis
7. Value Chain Analysis
8. Global Revenue Assurance Market Attractiveness Analysis By Deployment Model
9. Global Revenue Assurance Market Attractiveness Analysis By Component
10. Global Revenue Assurance Market Attractiveness Analysis By Vertical
11. Global Revenue Assurance Market Attractiveness Analysis By Region
12. Global Revenue Assurance Market: Dynamics
13. Global Revenue Assurance Market Share By Deployment Model (2023 & 2033)
14. Global Revenue Assurance Market Share By Component (2023 & 2033)
15. Global Revenue Assurance Market Share By Vertical (2023 & 2033)
16. Global Revenue Assurance Market Share By Regions (2023 & 2033)
17. Global Revenue Assurance Market Share By Company (2023)
This study forecasts revenue at global, regional, and country levels from 2020 to 2033. The Brainy Insights has segmented the global Revenue Assurance market based on below mentioned segments:
Global Revenue Assurance Market by Deployment Model:
Global Revenue Assurance Market by Component:
Global Revenue Assurance Market by Vertical:
Global Revenue Assurance Market by Region:
Research has its special purpose to undertake marketing efficiently. In this competitive scenario, businesses need information across all industry verticals; the information about customer wants, market demand, competition, industry trends, distribution channels etc. This information needs to be updated regularly because businesses operate in a dynamic environment. Our organization, The Brainy Insights incorporates scientific and systematic research procedures in order to get proper market insights and industry analysis for overall business success. The analysis consists of studying the market from a miniscule level wherein we implement statistical tools which helps us in examining the data with accuracy and precision.
Our research reports feature both; quantitative and qualitative aspects for any market. Qualitative information for any market research process are fundamental because they reveal the customer needs and wants, usage and consumption for any product/service related to a specific industry. This in turn aids the marketers/investors in knowing certain perceptions of the customers. Qualitative research can enlighten about the different product concepts and designs along with unique service offering that in turn, helps define marketing problems and generate opportunities. On the other hand, quantitative research engages with the data collection process through interviews, e-mail interactions, surveys and pilot studies. Quantitative aspects for the market research are useful to validate the hypotheses generated during qualitative research method, explore empirical patterns in the data with the help of statistical tools, and finally make the market estimations.
The Brainy Insights offers comprehensive research and analysis, based on a wide assortment of factual insights gained through interviews with CXOs and global experts and secondary data from reliable sources. Our analysts and industry specialist assume vital roles in building up statistical tools and analysis models, which are used to analyse the data and arrive at accurate insights with exceedingly informative research discoveries. The data provided by our organization have proven precious to a diverse range of companies, facilitating them to address issues such as determining which products/services are the most appealing, whether or not customers use the product in the manner anticipated, the purchasing intentions of the market and many others.
Our research methodology encompasses an idyllic combination of primary and secondary initiatives. Key phases involved in this process are listed below:

The phase involves the gathering and collecting of market data and its related information with the help of different sources & research procedures.

The data procurement stage involves in data gathering and collecting through various data sources.
This stage involves in extensive research. These data sources includes:
Purchased Database: Purchased databases play a crucial role in estimating the market sizes irrespective of the domain. Our purchased database includes:
Primary Research: The Brainy Insights interacts with leading companies and experts of the concerned domain to develop the analyst team’s market understanding and expertise. It improves and substantiates every single data presented in the market reports. Primary research mainly involves in telephonic interviews, E-mail interactions and face-to-face interviews with the raw material providers, manufacturers/producers, distributors, & independent consultants. The interviews that we conduct provides valuable data on market size and industry growth trends prevailing in the market. Our organization also conducts surveys with the various industry experts in order to gain overall insights of the industry/market. For instance, in healthcare industry we conduct surveys with the pharmacists, doctors, surgeons and nurses in order to gain insights and key information of a medical product/device/equipment which the customers are going to usage. Surveys are conducted in the form of questionnaire designed by our own analyst team. Surveys plays an important role in primary research because surveys helps us to identify the key target audiences of the market. Additionally, surveys helps to identify the key target audience engaged with the market. Our survey team conducts the survey by targeting the key audience, thus gaining insights from them. Based on the perspectives of the customers, this information is utilized to formulate market strategies. Moreover, market surveys helps us to understand the current competitive situation of the industry. To be precise, our survey process typically involve with the 360 analysis of the market. This analytical process begins by identifying the prospective customers for a product or service related to the market/industry to obtain data on how a product/service could fit into customers’ lives.

Secondary Research: The secondary data sources includes information published by the on-profit organizations such as World bank, WHO, company fillings, investor presentations, annual reports, national government documents, statistical databases, blogs, articles, white papers and others. From the annual report, we analyse a company’s revenue to understand the key segment and market share of that organization in a particular region. We analyse the company websites and adopt the product mapping technique which is important for deriving the segment revenue. In the product mapping method, we select and categorize the products offered by the companies catering to domain specific market, deduce the product revenue for each of the companies so as to get overall estimation of the market size. We also source data and analyses trends based on information received from supply side and demand side intermediaries in the value chain. The supply side denotes the data gathered from supplier, distributor, wholesaler and the demand side illustrates the data gathered from the end customers for respective market domain.

The supply side for a domain specific market is analysed by:
The demand side for the market is estimated through:
In-house Library: Apart from these third-party sources, we have our in-house library of qualitative and quantitative information. Our in-house database includes market data for various industry and domains. These data are updated on regular basis as per the changing market scenario. Our library includes, historic databases, internal audit reports and archives.
Sometimes there are instances where there is no metadata or raw data available for any domain specific market. For those cases, we use our expertise to forecast and estimate the market size in order to generate comprehensive data sets. Our analyst team adopt a robust research technique in order to produce the estimates:
Data Synthesis: This stage involves the analysis & mapping of all the information obtained from the previous step. It also involves in scrutinizing the data for any discrepancy observed while data gathering related to the market. The data is collected with consideration to the heterogeneity of sources. Robust scientific techniques are in place for synthesizing disparate data sets and provide the essential contextual information that can orient market strategies. The Brainy Insights has extensive experience in data synthesis where the data passes through various stages:


Market Deduction & Formulation: The final stage comprises of assigning data points at appropriate market spaces so as to deduce feasible conclusions. Analyst perspective & subject matter expert based holistic form of market sizing coupled with industry analysis also plays a crucial role in this stage.
This stage involves in finalization of the market size and numbers that we have collected from data integration step. With data interpolation, it is made sure that there is no gap in the market data. Successful trend analysis is done by our analysts using extrapolation techniques, which provide the best possible forecasts for the market.
Data Validation & Market Feedback: Validation is the most important step in the process. Validation & re-validation via an intricately designed process helps us finalize data-points to be used for final calculations.

The Brainy Insights interacts with leading companies and experts of the concerned domain to develop the analyst team’s market understanding and expertise. It improves and substantiates every single data presented in the market reports. The data validation interview and discussion panels are typically composed of the most experienced industry members. The participants include, however, are not limited to:
Moreover, we always validate our data and findings through primary respondents from all the major regions we are working on.


Free Customization
Fortune 500 Clients
Free Yearly Update On Purchase Of Multi/Corporate License
Companies Served Till Date