- +1-315-215-1633
- sales@thebrainyinsights.com

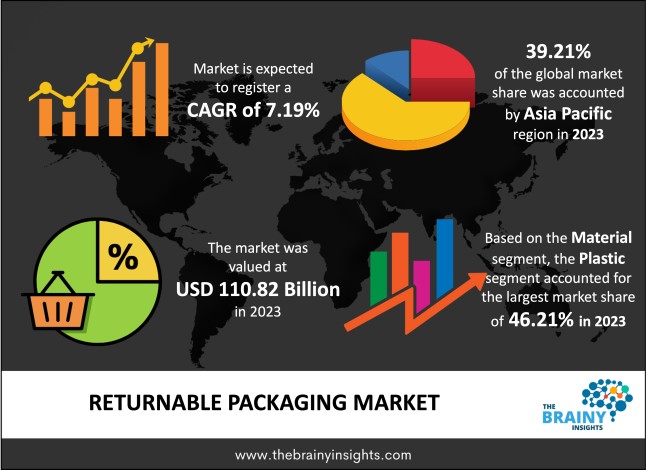
The global returnable packaging market was valued at USD 110.82 Billion in 2023 and grew at a CAGR of 7.19% from 2024 to 2033. The market is expected to reach USD 221.90 Billion by 2033. The growth of the returnable packaging market can be attributed to the rising demand for such products in the food and beverages and automotive industries. The rising consumer awareness is fueling the market's growth in developing regions.
Returnable packaging is a sustainable packaging technique that lessens the packaging and logistics sector's environmental impact. It moves goods quickly and safely along the supply chain by reusing packaging materials without compromising their protective qualities. Returnable packaging is a more affordable option for businesses that handle a large volume of merchandise. Single-use packaging can have a major negative environmental impact. However, returnable packaging can replace one-way packaging with a returnable solution. Once the assets reach their destination, returnable packaging is gathered and shipped back to the distribution site. Returnable packaging minimizes waste from packing, lowers the demand for warehousing and storage, and lowers operating and labour expenses.
Get an overview of this study by requesting a free sample
Increasing demand for sustainable packaging: The increasing need to implement sustainable development models stems from growing knowledge of environmental deterioration, climate change, and the dire repercussions it poses to humankind. The growing consumer demand for sustainability has brought about a considerable transition in the packaging business in recent years. Sustainable packaging is progressively replacing the age of single-use plastics and excessive packaging waste. For several years, single-use packaging has remained in the atmosphere as microplastics and eventually ends up in humans' bodies, posing serious health risks. Due to the enormous demand for packaging worldwide, enormous volumes of packaging trash are produced daily. Reusable, eco-friendly, returnable packaging lowers the quantity of waste produced daily. Additionally, the market is expanding due to the growing need for returnable packaging in several industries.
High cost: The market growth of the returnable packaging market would be impeded by the high initial cost. The cost of the return trip of the return packaging raises the operation cost, making it more expensive. As returnable packaging is comparatively costly, small and medium-sized businesses need help to afford to use it. Most of the market comprises these businesses, which will go untapped due to hefty costs.
Increasing investments in research and development of sustainable packaging: Businesses can develop new goods and services to cater to the evolving needs of their clientele by investing in research and development. Businesses may get a competitive advantage and increase their market share. R&D in returnable packaging can also assist businesses in enhancing their current line of goods and services. Plastic packaging has advantages over alternative packaging options like paper or glass, so it is unlikely to be replaced for many of its current uses soon. It is more likely that the manufacture of plastic will alter and that the amount of recycled plastic may rise over time. While some companies have adopted new plastic policies, such as banning plastic bags and making other adjustments to their products or supply chains, others have decided to transition to recyclable materials when they cannot completely eliminate plastics.
The regions analyzed for the market include North America, Europe, South America, Asia Pacific, the Middle East, and Africa. Asia-Pacific emerged as the most significant returnable packaging market, with a 39.21% market revenue share in 2023.
Asia-Pacific region will account for the largest market share with revenue growth. The region has a high demand for returnable packaging as the prevalence of cancer is rapidly growing. The growing investment in food and beverages, automotive, healthcare and consumer goods industries and the presence of manufacturers are the primary factors for the market growth. Furthermore, increasing government initiatives are promoting the commercialization of returnable packaging products.
Asia-Pacific region Returnable Packaging Market Share in 2023 - 39.21%
www.thebrainyinsights.com
Check the geographical analysis of this market by requesting a free sample
The material segment is divided into plastic, wood, metal, glass and foam. The plastic segment dominated the market, with a share of around 46.21% in 2023. Plastic is widely accessible, flexible, strong, lightweight, and multipurpose. Plastics are perfect for various packaging since they are easily moulded into many sizes and shapes. The non-corrosive quality and solvent resilience make plastic ideal for packaging liquids such as baked goods, dairy, and beverages.
The product type segment is divided into intermediate bulk containers, pallets, dunnage, crates, barrels and drums, bottles and others. The pallets segment dominated the market, with a share of around 57.93% in 2023. Returnable packaging for pallets is widely used in many different sectors. Pallets may be reused, which makes them an affordable, practical, and environmentally friendly packaging material.
The application segment is divided into automotive, food and beverages, healthcare, consumer goods, and others. The food and beverages segment dominated the market, with a share of around 42.12% in 2023. Consumer demand for packaged food and beverages has increased due to population growth and rising disposable income. This market will grow due to rising customer demand for groceries, dairy products, and other beverages.
| Attribute | Description |
|---|---|
| Market Size | Revenue (USD Billion) |
| Market size value in 2023 | USD 110.82 Billion |
| Market size value in 2033 | USD 221.90 Billion |
| CAGR (2024 to 2033) | 7.19% |
| Historical data | 2020-2022 |
| Base Year | 2023 |
| Forecast | 2024-2033 |
| Region | The regions analyzed for the market are Asia Pacific, Europe, South America, North America, and Middle East & Africa. Furthermore, the regions are further analyzed at the country level. |
| Segments | Material, Product Type and Application |
As per The Brainy Insights, the size of the returnable packaging market was valued at USD 110.82 Billion in 2023 to USD 221.90 Billion by 2033.
Global returnable packaging market is growing at a CAGR of 7.19% during the forecast period 2024-2033.
Asia Pacific region emerged as the largest market for the returnable packaging.
The market's growth will be influenced by the growing demand for returnable packaging in several applications.
The high cost can hamper the market growth.
The growth of food and beverages industry is providing huge opportunities to the market.
1. Introduction
1.1. Objectives of the Study
1.2. Market Definition
1.3. Research Scope
1.4. Currency
1.5. Key Target Audience
2. Research Methodology and Assumptions
3. Executive Summary
4. Premium Insights
4.1. Porter’s Five Forces Analysis
4.2. Value Chain Analysis
4.3. Top Investment Pockets
4.3.1. Market Attractiveness Analysis by Material
4.3.2. Market Attractiveness Analysis by Product Type
4.3.3. Market Attractiveness Analysis by Application
4.3.4. Market Attractiveness Analysis by Region
4.4. Industry Trends
5. Market Dynamics
5.1. Market Evaluation
5.2. Drivers
5.2.1. Increasing demand for returnable packaging in different applications
5.3. Restraints
5.3.1. High cost
5.4. Opportunities
5.4.1. Increasing investment in development of technology
5.5. Challenges
5.5.1. Supply chain integration
6. Global Returnable Packaging Market Analysis and Forecast, By Material
6.1. Segment Overview
6.2. Plastic
6.3. Wood
6.4. Metal
6.5. Glass
6.6. Foam
7. Global Returnable Packaging Market Analysis and Forecast, By Product Type
7.1. Segment Overview
7.2. Intermediate Bulk Containers
7.3. Pallets
7.4. Dunnage
7.5. Crates
7.6. Barrel and Drums
7.7. Bottles
7.8. Others
8. Global Returnable Packaging Market Analysis and Forecast, By Application
8.1. Segment Overview
8.2. Automotive
8.3. Food and Beverages
8.4. Healthcare
8.5. Consumer Goods
8.6. Others
9. Global Returnable Packaging Market Analysis and Forecast, By Regional Analysis
9.1. Segment Overview
9.2. North America
9.2.1. U.S.
9.2.2. Canada
9.2.3. Mexico
9.3. Europe
9.3.1. Germany
9.3.2. France
9.3.3. U.K.
9.3.4. Italy
9.3.5. Spain
9.4. Asia-Pacific
9.4.1. Japan
9.4.2. China
9.4.3. India
9.5. South America
9.5.1. Brazil
9.6. Middle East and Africa
9.6.1. UAE
9.6.2. South Africa
10. Global Returnable Packaging Market-Competitive Landscape
10.1. Overview
10.2. Market Share of Key Players in the Returnable Packaging Market
10.2.1. Global Company Market Share
10.2.2. North America Company Market Share
10.2.3. Europe Company Market Share
10.2.4. APAC Company Market Share
10.3. Competitive Situations and Trends
10.3.1. Product Launches and Developments
10.3.2. Partnerships, Collaborations, and Agreements
10.3.3. Mergers & Acquisitions
10.3.4. Expansions
11. Company Profiles
11.1. Plastic Packaging Solutions Midlands & East Ltd.
11.1.1. Business Overview
11.1.2. Company Snapshot
11.1.3. Company Market Share Analysis
11.1.4. Company Product Portfolio
11.1.5. Recent Developments
11.1.6. SWOT Analysis
11.2. Lamar Packaging Systems
11.2.1. Business Overview
11.2.2. Company Snapshot
11.2.3. Company Market Share Analysis
11.2.4. Company Product Portfolio
11.2.5. Recent Developments
11.2.6. SWOT Analysis
11.3. Returnable Packaging Resource Inc.
11.3.1. Business Overview
11.3.2. Company Snapshot
11.3.3. Company Market Share Analysis
11.3.4. Company Product Portfolio
11.3.5. Recent Developments
11.3.6. SWOT Analysis
11.4. Tri-Pack Plastic Ltd.
11.4.1. Business Overview
11.4.2. Company Snapshot
11.4.3. Company Market Share Analysis
11.4.4. Company Product Portfolio
11.4.5. Recent Developments
11.4.6. SWOT Analysis
11.5. NEFAB Group
11.5.1. Business Overview
11.5.2. Company Snapshot
11.5.3. Company Market Share Analysis
11.5.4. Company Product Portfolio
11.5.5. Recent Developments
11.5.6. SWOT Analysis
11.6. Amatech Inc.
11.6.1. Business Overview
11.6.2. Company Snapshot
11.6.3. Company Market Share Analysis
11.6.4. Company Product Portfolio
11.6.5. Recent Developments
11.6.6. SWOT Analysis
11.7. CHEP
11.7.1. Business Overview
11.7.2. Company Snapshot
11.7.3. Company Market Share Analysis
11.7.4. Company Product Portfolio
11.7.5. Recent Developments
11.7.6. SWOT Analysis
11.8. ORBIS Corporation
11.8.1. Business Overview
11.8.2. Company Snapshot
11.8.3. Company Market Share Analysis
11.8.4. Company Product Portfolio
11.8.5. Recent Developments
11.8.6. SWOT Analysis
11.9. Integra Packaging
11.9.1. Business Overview
11.9.2. Company Snapshot
11.9.3. Company Market Share Analysis
11.9.4. Company Product Portfolio
11.9.5. Recent Developments
11.9.6. SWOT Analysis
11.10. Celina Industries
11.10.1. Business Overview
11.10.2. Company Snapshot
11.10.3. Company Market Share Analysis
11.10.4. Company Product Portfolio
11.10.5. Recent Developments
11.10.6. SWOT Analysis
11.11. ORBIS Corporation
11.11.1. Business Overview
11.11.2. Company Snapshot
11.11.3. Company Market Share Analysis
11.11.4. Company Product Portfolio
11.11.5. Recent Developments
11.11.6. SWOT Analysis
11.12. UBEECO Packaging Solutions
11.12.1. Business Overview
11.12.2. Company Snapshot
11.12.3. Company Market Share Analysis
11.12.4. Company Product Portfolio
11.12.5. Recent Developments
11.12.6. SWOT Analysis
11.13. Schoeller Allibert
11.13.1. Business Overview
11.13.2. Company Snapshot
11.13.3. Company Market Share Analysis
11.13.4. Company Product Portfolio
11.13.5. Recent Developments
11.13.6. SWOT Analysis
List of Table
1. Global Returnable Packaging Market, By Material, 2020-2033 (USD Billion)
2. Global Plastic, Returnable Packaging Market, By Region, 2020-2033 (USD Billion)
3. Global Wood, Returnable Packaging Market, By Region, 2020-2033 (USD Billion)
4. Global Metal, Returnable Packaging Market, By Region, 2020-2033 (USD Billion)
5. Global Glass, Returnable Packaging Market, By Region, 2020-2033 (USD Billion)
6. Global Foam, Returnable Packaging Market, By Region, 2020-2033 (USD Billion)
7. Global Returnable Packaging Market, By Product Type, 2020-2033 (USD Billion)
8. Global Intermediate Bulk Containers, Returnable Packaging Market, By Region, 2020-2033 (USD Billion)
9. Global Pallets, Returnable Packaging Market, By Region, 2020-2033 (USD Billion)
10. Global Dunnage, Returnable Packaging Market, By Region, 2020-2033 (USD Billion)
11. Global Crates, Returnable Packaging Market, By Region, 2020-2033 (USD Billion)
12. Global Barrel and Drums, Returnable Packaging Market, By Region, 2020-2033 (USD Billion)
13. Global Bottles, Returnable Packaging Market, By Region, 2020-2033 (USD Billion)
14. Global Others, Returnable Packaging Market, By Region, 2020-2033 (USD Billion)
15. Global Returnable Packaging Market, By Application, 2020-2033 (USD Billion)
16. Global Automotive, Returnable Packaging Market, By Region, 2020-2033 (USD Billion)
17. Global Food and Beverages, Returnable Packaging Market, By Region, 2020-2033 (USD Billion)
18. Global Healthcare, Returnable Packaging Market, By Region, 2020-2033 (USD Billion)
19. Global Consumer Goods, Returnable Packaging Market, By Region, 2020-2033 (USD Billion)
20. Global Others, Returnable Packaging Market, By Region, 2020-2033 (USD Billion)
21. Global Returnable Packaging Market, By Region, 2020-2033 (USD Billion)
22. North America Returnable Packaging Market, By Material, 2020-2033 (USD Billion)
23. North America Returnable Packaging Market, By Product Type, 2020-2033 (USD Billion)
24. North America Returnable Packaging Market, By Application, 2020-2033 (USD Billion)
25. U.S. Returnable Packaging Market, By Material, 2020-2033 (USD Billion)
26. U.S. Returnable Packaging Market, By Product Type, 2020-2033 (USD Billion)
27. U.S. Returnable Packaging Market, By Application, 2020-2033 (USD Billion)
28. Canada Returnable Packaging Market, By Material, 2020-2033 (USD Billion)
29. Canada Returnable Packaging Market, By Product Type, 2020-2033 (USD Billion)
30. Canada Returnable Packaging Market, By Application, 2020-2033 (USD Billion)
31. Mexico Returnable Packaging Market, By Material, 2020-2033 (USD Billion)
32. Mexico Returnable Packaging Market, By Product Type, 2020-2033 (USD Billion)
33. Mexico Returnable Packaging Market, By Application, 2020-2033 (USD Billion)
34. Europe Returnable Packaging Market, By Material, 2020-2033 (USD Billion)
35. Europe Returnable Packaging Market, By Product Type, 2020-2033 (USD Billion)
36. Europe Returnable Packaging Market, By Application, 2020-2033 (USD Billion)
37. Germany Returnable Packaging Market, By Material, 2020-2033 (USD Billion)
38. Germany Returnable Packaging Market, By Product Type, 2020-2033 (USD Billion)
39. Germany Returnable Packaging Market, By Application, 2020-2033 (USD Billion)
40. France Returnable Packaging Market, By Material, 2020-2033 (USD Billion)
41. France Returnable Packaging Market, By Product Type, 2020-2033 (USD Billion)
42. France Returnable Packaging Market, By Application, 2020-2033 (USD Billion)
43. U.K. Returnable Packaging Market, By Material, 2020-2033 (USD Billion)
44. U.K. Returnable Packaging Market, By Product Type, 2020-2033 (USD Billion)
45. U.K. Returnable Packaging Market, By Application, 2020-2033 (USD Billion)
46. Italy Returnable Packaging Market, By Material, 2020-2033 (USD Billion)
47. Italy Returnable Packaging Market, By Product Type, 2020-2033 (USD Billion)
48. Italy Returnable Packaging Market, By Application, 2020-2033 (USD Billion)
49. Spain Returnable Packaging Market, By Material, 2020-2033 (USD Billion)
50. Spain Returnable Packaging Market, By Product Type, 2020-2033 (USD Billion)
51. Spain Returnable Packaging Market, By Application, 2020-2033 (USD Billion)
52. Asia Pacific Returnable Packaging Market, By Material, 2020-2033 (USD Billion)
53. Asia Pacific Returnable Packaging Market, By Product Type, 2020-2033 (USD Billion)
54. Asia Pacific Returnable Packaging Market, By Application, 2020-2033 (USD Billion)
55. Japan Returnable Packaging Market, By Material, 2020-2033 (USD Billion)
56. Japan Returnable Packaging Market, By Product Type, 2020-2033 (USD Billion)
57. Japan Returnable Packaging Market, By Application, 2020-2033 (USD Billion)
58. China Returnable Packaging Market, By Material, 2020-2033 (USD Billion)
59. China Returnable Packaging Market, By Product Type, 2020-2033 (USD Billion)
60. China Returnable Packaging Market, By Application, 2020-2033 (USD Billion)
61. India Returnable Packaging Market, By Material, 2020-2033 (USD Billion)
62. India Returnable Packaging Market, By Product Type, 2020-2033 (USD Billion)
63. India Returnable Packaging Market, By Application, 2020-2033 (USD Billion)
64. South America Returnable Packaging Market, By Material, 2020-2033 (USD Billion)
65. South America Returnable Packaging Market, By Product Type, 2020-2033 (USD Billion)
66. South America Returnable Packaging Market, By Application, 2020-2033 (USD Billion)
67. Brazil Returnable Packaging Market, By Material, 2020-2033 (USD Billion)
68. Brazil Returnable Packaging Market, By Product Type, 2020-2033 (USD Billion)
69. Brazil Returnable Packaging Market, By Application, 2020-2033 (USD Billion)
70. Middle East and Africa Returnable Packaging Market, By Material, 2020-2033 (USD Billion)
71. Middle East and Africa Returnable Packaging Market, By Product Type, 2020-2033 (USD Billion)
72. Middle East and Africa Returnable Packaging Market, By Application, 2020-2033 (USD Billion)
73. UAE Returnable Packaging Market, By Material, 2020-2033 (USD Billion)
74. UAE Returnable Packaging Market, By Product Type, 2020-2033 (USD Billion)
75. UAE Returnable Packaging Market, By Application, 2020-2033 (USD Billion)
76. South Africa Returnable Packaging Market, By Material, 2020-2033 (USD Billion)
77. South Africa Returnable Packaging Market, By Product Type, 2020-2033 (USD Billion)
78. South Africa Returnable Packaging Market, By Application, 2020-2033 (USD Billion)
List of Figures
1. Global Returnable Packaging Market Segmentation
2. Returnable Packaging Market: Research Methodology
3. Market Size Estimation Methodology: Bottom-Up Approach
4. Market Size Estimation Methodology: Top-Down Approach
5. Data Triangulation
6. Porter’s Five Forces Analysis
7. Value Chain Analysis
8. Global Returnable Packaging Market Attractiveness Analysis by Material
9. Global Returnable Packaging Market Attractiveness Analysis by Product Type
10. Global Returnable Packaging Market Attractiveness Analysis by Application
11. Global Returnable Packaging Market Attractiveness Analysis by Region
12. Global Returnable Packaging Market: Dynamics
13. Global Returnable Packaging Market Share by Material (2023 & 2033)
14. Global Returnable Packaging Market Share by Product Type (2023 & 2033)
15. Global Returnable Packaging Market Share by Application (2023 & 2033)
16. Global Returnable Packaging Market Share by Regions (2023 & 2033)
17. Global Returnable Packaging Market Share by Company (2023)
This study forecasts revenue at global, regional, and country levels from 2020 to 2033. The Brainy Insights has segmented the global returnable packaging market based on below mentioned segments:
Global Returnable Packaging Market by Material:
Global Returnable Packaging Market by Product Type:
Global Returnable Packaging Market by Application:
Global Returnable Packaging Market by Region:
Research has its special purpose to undertake marketing efficiently. In this competitive scenario, businesses need information across all industry verticals; the information about customer wants, market demand, competition, industry trends, distribution channels etc. This information needs to be updated regularly because businesses operate in a dynamic environment. Our organization, The Brainy Insights incorporates scientific and systematic research procedures in order to get proper market insights and industry analysis for overall business success. The analysis consists of studying the market from a miniscule level wherein we implement statistical tools which helps us in examining the data with accuracy and precision.
Our research reports feature both; quantitative and qualitative aspects for any market. Qualitative information for any market research process are fundamental because they reveal the customer needs and wants, usage and consumption for any product/service related to a specific industry. This in turn aids the marketers/investors in knowing certain perceptions of the customers. Qualitative research can enlighten about the different product concepts and designs along with unique service offering that in turn, helps define marketing problems and generate opportunities. On the other hand, quantitative research engages with the data collection process through interviews, e-mail interactions, surveys and pilot studies. Quantitative aspects for the market research are useful to validate the hypotheses generated during qualitative research method, explore empirical patterns in the data with the help of statistical tools, and finally make the market estimations.
The Brainy Insights offers comprehensive research and analysis, based on a wide assortment of factual insights gained through interviews with CXOs and global experts and secondary data from reliable sources. Our analysts and industry specialist assume vital roles in building up statistical tools and analysis models, which are used to analyse the data and arrive at accurate insights with exceedingly informative research discoveries. The data provided by our organization have proven precious to a diverse range of companies, facilitating them to address issues such as determining which products/services are the most appealing, whether or not customers use the product in the manner anticipated, the purchasing intentions of the market and many others.
Our research methodology encompasses an idyllic combination of primary and secondary initiatives. Key phases involved in this process are listed below:

The phase involves the gathering and collecting of market data and its related information with the help of different sources & research procedures.

The data procurement stage involves in data gathering and collecting through various data sources.
This stage involves in extensive research. These data sources includes:
Purchased Database: Purchased databases play a crucial role in estimating the market sizes irrespective of the domain. Our purchased database includes:
Primary Research: The Brainy Insights interacts with leading companies and experts of the concerned domain to develop the analyst team’s market understanding and expertise. It improves and substantiates every single data presented in the market reports. Primary research mainly involves in telephonic interviews, E-mail interactions and face-to-face interviews with the raw material providers, manufacturers/producers, distributors, & independent consultants. The interviews that we conduct provides valuable data on market size and industry growth trends prevailing in the market. Our organization also conducts surveys with the various industry experts in order to gain overall insights of the industry/market. For instance, in healthcare industry we conduct surveys with the pharmacists, doctors, surgeons and nurses in order to gain insights and key information of a medical product/device/equipment which the customers are going to usage. Surveys are conducted in the form of questionnaire designed by our own analyst team. Surveys plays an important role in primary research because surveys helps us to identify the key target audiences of the market. Additionally, surveys helps to identify the key target audience engaged with the market. Our survey team conducts the survey by targeting the key audience, thus gaining insights from them. Based on the perspectives of the customers, this information is utilized to formulate market strategies. Moreover, market surveys helps us to understand the current competitive situation of the industry. To be precise, our survey process typically involve with the 360 analysis of the market. This analytical process begins by identifying the prospective customers for a product or service related to the market/industry to obtain data on how a product/service could fit into customers’ lives.

Secondary Research: The secondary data sources includes information published by the on-profit organizations such as World bank, WHO, company fillings, investor presentations, annual reports, national government documents, statistical databases, blogs, articles, white papers and others. From the annual report, we analyse a company’s revenue to understand the key segment and market share of that organization in a particular region. We analyse the company websites and adopt the product mapping technique which is important for deriving the segment revenue. In the product mapping method, we select and categorize the products offered by the companies catering to domain specific market, deduce the product revenue for each of the companies so as to get overall estimation of the market size. We also source data and analyses trends based on information received from supply side and demand side intermediaries in the value chain. The supply side denotes the data gathered from supplier, distributor, wholesaler and the demand side illustrates the data gathered from the end customers for respective market domain.

The supply side for a domain specific market is analysed by:
The demand side for the market is estimated through:
In-house Library: Apart from these third-party sources, we have our in-house library of qualitative and quantitative information. Our in-house database includes market data for various industry and domains. These data are updated on regular basis as per the changing market scenario. Our library includes, historic databases, internal audit reports and archives.
Sometimes there are instances where there is no metadata or raw data available for any domain specific market. For those cases, we use our expertise to forecast and estimate the market size in order to generate comprehensive data sets. Our analyst team adopt a robust research technique in order to produce the estimates:
Data Synthesis: This stage involves the analysis & mapping of all the information obtained from the previous step. It also involves in scrutinizing the data for any discrepancy observed while data gathering related to the market. The data is collected with consideration to the heterogeneity of sources. Robust scientific techniques are in place for synthesizing disparate data sets and provide the essential contextual information that can orient market strategies. The Brainy Insights has extensive experience in data synthesis where the data passes through various stages:


Market Deduction & Formulation: The final stage comprises of assigning data points at appropriate market spaces so as to deduce feasible conclusions. Analyst perspective & subject matter expert based holistic form of market sizing coupled with industry analysis also plays a crucial role in this stage.
This stage involves in finalization of the market size and numbers that we have collected from data integration step. With data interpolation, it is made sure that there is no gap in the market data. Successful trend analysis is done by our analysts using extrapolation techniques, which provide the best possible forecasts for the market.
Data Validation & Market Feedback: Validation is the most important step in the process. Validation & re-validation via an intricately designed process helps us finalize data-points to be used for final calculations.

The Brainy Insights interacts with leading companies and experts of the concerned domain to develop the analyst team’s market understanding and expertise. It improves and substantiates every single data presented in the market reports. The data validation interview and discussion panels are typically composed of the most experienced industry members. The participants include, however, are not limited to:
Moreover, we always validate our data and findings through primary respondents from all the major regions we are working on.


Free Customization
Fortune 500 Clients
Free Yearly Update On Purchase Of Multi/Corporate License
Companies Served Till Date