- +1-315-215-1633
- sales@thebrainyinsights.com

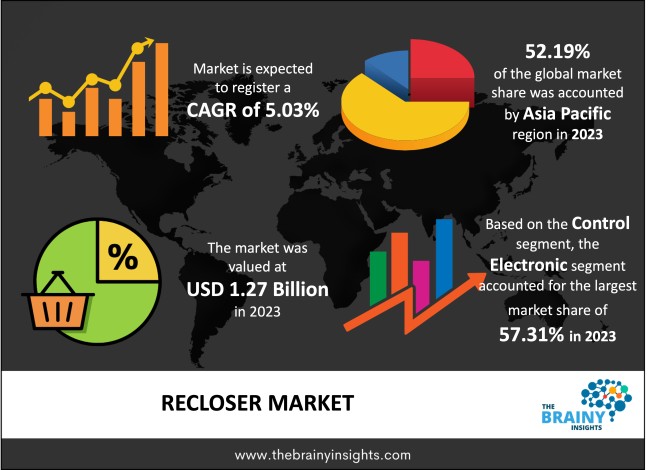
The global Recloser market generated USD 1.27 Billion revenue in 2023 and is projected to grow at a CAGR of 5.03% from 2024 to 2033. The key driver propelling the market forward is the increasing demand for dependable power distribution worldwide, notably in developing economies. Moreover, the increasing focus on expanding and modernizing power infrastructure to accommodate growing energy needs will open up lucrative possibilities over the forecast years.
A recloser is a specialized circuit breaker primarily used in overhead distribution systems to protect power lines from faults or short circuits. It automatically detects abnormalities in the electrical network and interrupts the flow of electricity to isolate the fault. Unlike traditional circuit breakers that remain open until manually reset, a recloser can attempt to restore power after a brief interruption. It achieves this by automatically closing its contacts multiple times rapidly, allowing power to flow again if the fault has cleared. Reclosers often incorporate advanced control and monitoring features, such as remote communication capabilities, enabling utilities to manage and diagnose faults effectively. This technology helps enhance the reliability and resilience of electrical distribution systems by minimizing downtime and reducing the need for manual intervention.
Get an overview of this study by requesting a free sample
Increasing Demand for Reliable Power Supply - With growing industrialization and urbanization, there's a heightened need for a consistent and uninterrupted power supply. Reclosers help restore power automatically after temporary faults, improving grid reliability and minimizing downtime.
Ageing Power Infrastructure - Many power grids worldwide are ageing, increasing the risk of faults and outages. Reclosers help utilities manage these issues efficiently by quickly isolating faults and restoring power, thereby reducing the need for manual intervention and maintenance costs.
Rising Investments in Smart Grid Technologies - Governments and utility companies are investing in modernizing power grids with smart grid technologies to enhance efficiency, reliability, and resilience. Reclosers play a crucial role in smart grid deployments by enabling remote monitoring, control, and automation of distribution networks.
High Initial Investment Costs - The upfront costs of deploying recloser systems, especially for advanced models with integrated smart grid capabilities, can be significant. This factor may deter some utility companies, particularly those with limited budgets, from investing in recloser technology.
Complex Regulatory Environment - The regulatory landscape governing power distribution varies across regions and can be complex. Compliance with regulations related to grid reliability standards, safety requirements, and interoperability can pose challenges for recloser manufacturers and utility operators, potentially slowing down market growth.
Integration of Renewable Energy Sources - The evolution towards a more sustainable energy mix, including increased penetration of renewable energy/power sources like wind and solar, creates opportunities for reclosers. Reclosers help manage the intermittency and variability associated with renewable energy generation by quickly responding to grid disturbances and maintaining system stability.
Advancements in Recloser Technology - Ongoing advancements in recloser technology, which include integrating advanced sensors, communication capabilities, and predictive analytics, offer opportunities for market growth. Innovations such as self-diagnostic capabilities, adaptive protection schemes, and real-time data analytics enhance the functionality and performance of reclosers, driving their adoption.
Complexity of Grid Integration - Integrating recloser systems with existing grid infrastructure can be challenging, particularly in older or outdated systems. Compatibility issues, retrofitting requirements, and interoperability concerns may arise, requiring additional time and resources for deployment.
Limited Awareness and Education - Utility companies, grid operators, and end-users may need to be more aware of the benefits and applications of recloser technology. A limited understanding of reclosers' capabilities and potential may hinder market adoption and slow-down deployment.
The regions analyzed for the market include North America, Europe, South America, Asia Pacific, the Middle East, and Africa. Asia Pacific emerged as the most prominent global Recloser market, with a 52.19% market revenue share in 2023.
The Asia Pacific region is undergoing enormous urbanization and industrialization, leading to increased electricity demand. The need for reliable power distribution infrastructure to support urban growth and industrial development is driving the demand for reclosers in the region. Furthermore, governments in Asia Pacific countries are investing significantly in expanding and upgrading their power infrastructure to meet growing energy needs. This aspect includes investments in transmission and distribution networks, where reclosers are critical in improving grid reliability and minimizing downtime. Additionally, many Asian countries invest in renewable energy sources such as solar and wind power. Reclosers help manage the integration of renewable energy into the grid by quickly responding to fluctuations in generation and maintaining system stability, driving their adoption in the region. Besides, modernization initiatives to improve grid efficiency, reliability, and resilience are gaining traction in Asia Pacific. Reclosers with advanced features such as self-healing capabilities and remote monitoring/control are integral to these initiatives, contributing to their regional dominance.
Asia Pacific Region Recloser Market Share in 2023 - 52.19%
www.thebrainyinsights.com
Check the geographical analysis of this market by requesting a free sample
The type segment is divided into single phase recloser, three phase recloser and triple single recloser. The single phase recloser segment dominated the market, with a share of around 52.18% in 2023. Many distribution networks are predominantly single-phase, particularly in residential and rural areas. Single-phase reclosers are specifically designed to operate effectively in such environments, making them the preferred choice for utilities managing these networks. Most importantly, single-phase reclosers are often more cost-effective than their three-phase counterparts. Their simpler design and lower complexity translate to reduced manufacturing and installation costs, making them an attractive option for utilities looking to optimize their investments in grid modernization. Additionally, single-phase reclosers offer greater flexibility and scalability in deployment compared to three-phase reclosers. Utilities can deploy single-phase reclosers selectively, focusing on areas with higher reliability requirements or where faults are more frequent, without extensive infrastructure upgrades.
The control segment is classified into electronic, hydraulic and micro-processor. The electronic segment dominated the market, with a share of around 57.31% in 2023. Electronic control reclosers have advanced monitoring and control capabilities enabled by electronic sensors, communication modules, and microprocessor-based controllers. These characteristics allow utilities to remotely monitor, diagnose, and manage recloser operations in real-time, enhancing grid visibility and control. Furthermore, electronic control reclosers utilize sophisticated algorithms and sensors to accurately detect and localize distribution network faults. This factor lets utilities quickly isolate faulted sections and restore power to unaffected areas, minimizing outage durations and improving grid reliability. Moreover, electronic control reclosers can self-heal functionalities, where they automatically reconfigure the distribution network to bypass faulted sections and restore power to as many customers as possible. This proactive response to grid disturbances improves system resilience and minimizes the impact of outages on consumers.
The insulation segment includes epoxy-insulated recloser, gas-insulated recloser and oil-insulated recloser. The epoxy-insulated recloser segment dominated the market, with a share of around 46.13% in 2023. Epoxy-insulated reclosers offer enhanced safety features compared to reclosers insulated with oil or gas. Epoxy insulation eliminates the risk of oil leaks or gas emissions, reducing the potential for environmental contamination and fire hazards. Additionally, epoxy-insulated reclosers require minimal maintenance and pose lower operational risks to personnel. In addition, epoxy-insulated reclosers can be manufactured with a customizable design to meet specific application requirements and performance criteria. Manufacturers can tailor epoxy-insulated reclosers' insulation properties, dimensions, and configurations to suit different voltage levels, fault currents, and environmental conditions. In addition, epoxy insulation is considered environmentally friendly and complies with stringent environmental regulations and standards. Epoxy-insulated reclosers do not contain hazardous materials such as PCBs or SF6 gases, reducing their environmental impact and ensuring compliance with regulatory requirements.
The voltage segment is split into upto 15 kv, 16-27 kv and 28-38 kv. The 16-27 kv segment dominated the market, with a share of around 43.19% in 2023. The 16-27 kV voltage range is commonly used in medium-voltage distribution networks worldwide. This voltage range is well-suited for supplying power to residential, commercial, and industrial consumers, making it a standard choice for distribution infrastructure. The 16-27 kV voltage range also offers a balanced combination of performance and cost-effectiveness. It provides sufficient voltage levels to meet the needs of medium-voltage distribution networks while remaining economically viable for utilities and end-users. Besides, reclosers operating within the 16-27 kV voltage range find applications in various distribution network configurations, including urban, suburban, and rural areas. They protect feeder lines, lateral branches, and transformers, ensuring reliable power supply to consumers across diverse environments.
| Attribute | Description |
|---|---|
| Market Size | Revenue (USD Billion) |
| Market size value in 2023 | USD 1.27 Billion |
| Market size value in 2033 | USD 2.07 Billion |
| CAGR (2024 to 2033) | 5.03% |
| Historical data | 2020-2022 |
| Base Year | 2023 |
| Forecast | 2024-2033 |
| Region | The regions analyzed for the market are Asia Pacific, Europe, South America, North America, and Middle East & Africa. Furthermore, the regions are further analyzed at the country level. |
| Segments | Type, Control, Insulation and Voltage |
As per The Brainy Insights, the size of the recloser market was valued at USD 1.27 billion in 2023 to USD 2.07 billion by 2033.
The global recloser market is growing at a CAGR of 5.03% during the forecast period 2024-2033.
Asia Pacific became the largest market for recloser.
Increasing demand for reliable power supply and rising investments in smart grid technologies drive the market's growth.
1. Introduction
1.1. Objectives of the Study
1.2. Market Definition
1.3. Research Scope
1.4. Currency
1.5. Key Target Audience
2. Research Methodology and Assumptions
3. Executive Summary
4. Premium Insights
4.1. Porter’s Five Forces Analysis
4.2. Value Chain Analysis
4.3. Top Investment Pockets
4.3.1. Market Attractiveness Analysis By Type
4.3.2. Market Attractiveness Analysis By Control
4.3.3. Market Attractiveness Analysis By Insulation
4.3.4. Market Attractiveness Analysis By Voltage
4.3.5. Market Attractiveness Analysis By Region
4.4. Industry Trends
5. Market Dynamics
5.1. Market Evaluation
5.2. Drivers
5.2.1. Increasing Demand for Reliable Power Supply
5.2.2. Rising Investments in Smart Grid Technologies
5.3. Restraints
5.3.1. Complex Regulatory Environment
5.4. Opportunities
5.4.1. Advancements in Recloser Technology
5.5. Challenges
5.5.1. Complexity of Grid Integration
6. Global Recloser Market Analysis and Forecast, By Type
6.1. Segment Overview
6.2. Single Phase Recloser
6.3. Three Phase Recloser
6.4. Triple Single Recloser
7. Global Recloser Market Analysis and Forecast, By Control
7.1. Segment Overview
7.2. Electronic
7.3. Hydraulic
7.4. Micro-Processor
8. Global Recloser Market Analysis and Forecast, By Insulation
8.1. Segment Overview
8.2. Epoxy-Insulated Recloser
8.3. Gas-Insulated Recloser
8.4. Oil-Insulated Recloser
9. Global Recloser Market Analysis and Forecast, By Voltage
9.1. Segment Overview
9.2. Upto 15 Kv
9.3. 16-27 Kv
9.4. 28-38 Kv
10. Global Recloser Market Analysis and Forecast, By Regional Analysis
10.1. Segment Overview
10.2. North America
10.2.1. U.S.
10.2.2. Canada
10.2.3. Mexico
10.3. Europe
10.3.1. Germany
10.3.2. France
10.3.3. U.K.
10.3.4. Italy
10.3.5. Spain
10.4. Asia-Pacific
10.4.1. Japan
10.4.2. China
10.4.3. India
10.5. South America
10.5.1. Brazil
10.6. Middle East and Africa
10.6.1. UAE
10.6.2. South Africa
11. Global Recloser Market-Competitive Landscape
11.1. Overview
11.2. Market Share of Key Players in the Recloser Market
11.2.1. Global Company Market Share
11.2.2. North America Company Market Share
11.2.3. Europe Company Market Share
11.2.4. APAC Company Market Share
11.3. Competitive Situations and Trends
11.3.1. Product Launches and Developments
11.3.2. Partnerships, Collaborations, and Agreements
11.3.3. Mergers & Acquisitions
11.3.4. Expansions
12. Company Profiles
12.1. Arteche
12.1.1. Business Overview
12.1.2. Company Snapshot
12.1.3. Company Market Share Analysis
12.1.4. Company Product Portfolio
12.1.5. Recent Developments
12.1.6. SWOT Analysis
12.2. ABB
12.2.1. Business Overview
12.2.2. Company Snapshot
12.2.3. Company Market Share Analysis
12.2.4. Company Product Portfolio
12.2.5. Recent Developments
12.2.6. SWOT Analysis
12.3. Brush
12.3.1. Business Overview
12.3.2. Company Snapshot
12.3.3. Company Market Share Analysis
12.3.4. Company Product Portfolio
12.3.5. Recent Developments
12.3.6. SWOT Analysis
12.4. Eaton
12.4.1. Business Overview
12.4.2. Company Snapshot
12.4.3. Company Market Share Analysis
12.4.4. Company Product Portfolio
12.4.5. Recent Developments
12.4.6. SWOT Analysis
12.5. Entec Electric & Electronic
12.5.1. Business Overview
12.5.2. Company Snapshot
12.5.3. Company Market Share Analysis
12.5.4. Company Product Portfolio
12.5.5. Recent Developments
12.5.6. SWOT Analysis
12.6. G&W Electric
12.6.1. Business Overview
12.6.2. Company Snapshot
12.6.3. Company Market Share Analysis
12.6.4. Company Product Portfolio
12.6.5. Recent Developments
12.6.6. SWOT Analysis
12.7. GE
12.7.1. Business Overview
12.7.2. Company Snapshot
12.7.3. Company Market Share Analysis
12.7.4. Company Product Portfolio
12.7.5. Recent Developments
12.7.6. SWOT Analysis
12.8. Hubbell
12.8.1. Business Overview
12.8.2. Company Snapshot
12.8.3. Company Market Share Analysis
12.8.4. Company Product Portfolio
12.8.5. Recent Developments
12.8.6. SWOT Analysis
12.9. Hughes Power System
12.9.1. Business Overview
12.9.2. Company Snapshot
12.9.3. Company Market Share Analysis
12.9.4. Company Product Portfolio
12.9.5. Recent Developments
12.9.6. SWOT Analysis
12.10. ILJIN Group
12.10.1. Business Overview
12.10.2. Company Snapshot
12.10.3. Company Market Share Analysis
12.10.4. Company Product Portfolio
12.10.5. Recent Developments
12.10.6. SWOT Analysis
12.11. NOJA Power
12.11.1. Business Overview
12.11.2. Company Snapshot
12.11.3. Company Market Share Analysis
12.11.4. Company Product Portfolio
12.11.5. Recent Developments
12.11.6. SWOT Analysis
12.12. Schneider Electric
12.12.1. Business Overview
12.12.2. Company Snapshot
12.12.3. Company Market Share Analysis
12.12.4. Company Product Portfolio
12.12.5. Recent Developments
12.12.6. SWOT Analysis
12.13. Siemens
12.13.1. Business Overview
12.13.2. Company Snapshot
12.13.3. Company Market Share Analysis
12.13.4. Company Product Portfolio
12.13.5. Recent Developments
12.13.6. SWOT Analysis
12.14. S&C Electric Company
12.14.1. Business Overview
12.14.2. Company Snapshot
12.14.3. Company Market Share Analysis
12.14.4. Company Product Portfolio
12.14.5. Recent Developments
12.14.6. SWOT Analysis
12.15. Tavrida Electric
12.15.1. Business Overview
12.15.2. Company Snapshot
12.15.3. Company Market Share Analysis
12.15.4. Company Product Portfolio
12.15.5. Recent Developments
12.15.6. SWOT Analysis
List of Table
1. Global Recloser Market, By Type, 2020-2033 (USD Billion) (Units)
2. Global Single Phase Recloser Market, By Region, 2020-2033 (USD Billion) (Units)
3. Global Three Phase Recloser Market, By Region, 2020-2033 (USD Billion) (Units)
4. Global Triple Single Recloser Market, By Region, 2020-2033 (USD Billion) (Units)
5. Global Recloser Market, By Control, 2020-2033 (USD Billion) (Units)
6. Global Electronic Recloser Market, By Region, 2020-2033 (USD Billion) (Units)
7. Global Hydraulic Recloser Market, By Region, 2020-2033 (USD Billion) (Units)
8. Global Micro-Processor Recloser Market, By Region, 2020-2033 (USD Billion) (Units)
9. Global Recloser Market, By Insulation, 2020-2033 (USD Billion) (Units)
10. Global Epoxy-Insulated Recloser Market, By Region, 2020-2033 (USD Billion) (Units)
11. Global Gas-Insulated Recloser Market, By Region, 2020-2033 (USD Billion) (Units)
12. Global Oil-Insulated Recloser Market, By Region, 2020-2033 (USD Billion) (Units)
13. Global Recloser Market, By Voltage, 2020-2033 (USD Billion) (Units)
14. Global Upto 15 Kv Recloser Market, By Region, 2020-2033 (USD Billion) (Units)
15. Global 16-27 Kv Recloser Market, By Region, 2020-2033 (USD Billion) (Units)
16. Global 28-38 Kv Recloser Market, By Region, 2020-2033 (USD Billion) (Units)
17. Global Recloser Market, By Region, 2020-2033 (USD Billion) (Units)
18. North America Recloser Market, By Type, 2020-2033 (USD Billion) (Units)
19. North America Recloser Market, By Control, 2020-2033 (USD Billion) (Units)
20. North America Recloser Market, By Insulation, 2020-2033 (USD Billion) (Units)
21. North America Recloser Market, By Voltage, 2020-2033 (USD Billion) (Units)
22. U.S. Recloser Market, By Type, 2020-2033 (USD Billion) (Units)
23. U.S. Recloser Market, By Control, 2020-2033 (USD Billion) (Units)
24. U.S. Recloser Market, By Insulation, 2020-2033 (USD Billion) (Units)
25. U.S. Recloser Market, By Voltage, 2020-2033 (USD Billion) (Units)
26. Canada Recloser Market, By Type, 2020-2033 (USD Billion) (Units)
27. Canada Recloser Market, By Control, 2020-2033 (USD Billion) (Units)
28. Canada Recloser Market, By Insulation, 2020-2033 (USD Billion) (Units)
29. Canada Recloser Market, By Voltage, 2020-2033 (USD Billion) (Units)
30. Mexico Recloser Market, By Type, 2020-2033 (USD Billion) (Units)
31. Mexico Recloser Market, By Control, 2020-2033 (USD Billion) (Units)
32. Mexico Recloser Market, By Insulation, 2020-2033 (USD Billion) (Units)
33. Mexico Recloser Market, By Voltage, 2020-2033 (USD Billion) (Units)
34. Europe Recloser Market, By Type, 2020-2033 (USD Billion) (Units)
35. Europe Recloser Market, By Control, 2020-2033 (USD Billion) (Units)
36. Europe Recloser Market, By Insulation, 2020-2033 (USD Billion) (Units)
37. Europe Recloser Market, By Voltage, 2020-2033 (USD Billion) (Units)
38. Germany Recloser Market, By Type, 2020-2033 (USD Billion) (Units)
39. Germany Recloser Market, By Control, 2020-2033 (USD Billion) (Units)
40. Germany Recloser Market, By Insulation, 2020-2033 (USD Billion) (Units)
41. Germany Recloser Market, By Voltage, 2020-2033 (USD Billion) (Units)
42. France Recloser Market, By Type, 2020-2033 (USD Billion) (Units)
43. France Recloser Market, By Control, 2020-2033 (USD Billion) (Units)
44. France Recloser Market, By Insulation, 2020-2033 (USD Billion) (Units)
45. France Recloser Market, By Voltage, 2020-2033 (USD Billion) (Units)
46. U.K. Recloser Market, By Type, 2020-2033 (USD Billion) (Units)
47. U.K. Recloser Market, By Control, 2020-2033 (USD Billion) (Units)
48. U.K. Recloser Market, By Insulation, 2020-2033 (USD Billion) (Units)
49. U.K. Recloser Market, By Voltage, 2020-2033 (USD Billion) (Units)
50. Italy Recloser Market, By Type, 2020-2033 (USD Billion) (Units)
51. Italy Recloser Market, By Control, 2020-2033 (USD Billion) (Units)
52. Italy Recloser Market, By Insulation, 2020-2033 (USD Billion) (Units)
53. Italy Recloser Market, By Voltage, 2020-2033 (USD Billion) (Units)
54. Spain Recloser Market, By Type, 2020-2033 (USD Billion) (Units)
55. Spain Recloser Market, By Control, 2020-2033 (USD Billion) (Units)
56. Spain Recloser Market, By Insulation, 2020-2033 (USD Billion) (Units)
57. Spain Recloser Market, By Voltage, 2020-2033 (USD Billion) (Units)
58. Asia Pacific Recloser Market, By Type, 2020-2033 (USD Billion) (Units)
59. Asia Pacific Recloser Market, By Control, 2020-2033 (USD Billion) (Units)
60. Asia Pacific Recloser Market, By Insulation, 2020-2033 (USD Billion) (Units)
61. Asia Pacific Recloser Market, By Voltage, 2020-2033 (USD Billion) (Units)
62. Japan Recloser Market, By Type, 2020-2033 (USD Billion) (Units)
63. Japan Recloser Market, By Control, 2020-2033 (USD Billion) (Units)
64. Japan Recloser Market, By Insulation, 2020-2033 (USD Billion) (Units)
65. Japan Recloser Market, By Voltage, 2020-2033 (USD Billion) (Units)
66. China Recloser Market, By Type, 2020-2033 (USD Billion) (Units)
67. China Recloser Market, By Control, 2020-2033 (USD Billion) (Units)
68. China Recloser Market, By Insulation, 2020-2033 (USD Billion) (Units)
69. China Recloser Market, By Voltage, 2020-2033 (USD Billion) (Units)
70. India Recloser Market, By Type, 2020-2033 (USD Billion) (Units)
71. India Recloser Market, By Control, 2020-2033 (USD Billion) (Units)
72. India Recloser Market, By Insulation, 2020-2033 (USD Billion) (Units)
73. India Recloser Market, By Voltage, 2020-2033 (USD Billion) (Units)
74. South America Recloser Market, By Type, 2020-2033 (USD Billion) (Units)
75. South America Recloser Market, By Control, 2020-2033 (USD Billion) (Units)
76. South America Recloser Market, By Insulation, 2020-2033 (USD Billion) (Units)
77. South America Recloser Market, By Voltage, 2020-2033 (USD Billion) (Units)
78. Brazil Recloser Market, By Type, 2020-2033 (USD Billion) (Units)
79. Brazil Recloser Market, By Control, 2020-2033 (USD Billion) (Units)
80. Brazil Recloser Market, By Insulation, 2020-2033 (USD Billion) (Units)
81. Brazil Recloser Market, By Voltage, 2020-2033 (USD Billion) (Units)
82. Middle East and Africa Recloser Market, By Type, 2020-2033 (USD Billion) (Units)
83. Middle East and Africa Recloser Market, By Control, 2020-2033 (USD Billion) (Units)
84. Middle East and Africa Recloser Market, By Insulation, 2020-2033 (USD Billion) (Units)
85. Middle East and Africa Recloser Market, By Voltage, 2020-2033 (USD Billion) (Units)
86. UAE Recloser Market, By Type, 2020-2033 (USD Billion) (Units)
87. UAE Recloser Market, By Control, 2020-2033 (USD Billion) (Units)
88. UAE Recloser Market, By Insulation, 2020-2033 (USD Billion) (Units)
89. UAE Recloser Market, By Voltage, 2020-2033 (USD Billion) (Units)
90. South Africa Recloser Market, By Type, 2020-2033 (USD Billion) (Units)
91. South Africa Recloser Market, By Control, 2020-2033 (USD Billion) (Units)
92. South Africa Recloser Market, By Insulation, 2020-2033 (USD Billion) (Units)
93. South Africa Recloser Market, By Voltage, 2020-2033 (USD Billion) (Units)
List of Figures
1. Global Recloser Market Segmentation
2. Recloser Market: Research Methodology
3. Market Size Estimation Methodology: Bottom-Up Approach
4. Market Size Estimation Methodology: Top-Down Approach
5. Data Triangulation
6. Porter’s Five Forces Analysis
7. Value Chain Analysis
8. Global Recloser Market Attractiveness Analysis By Type
9. Global Recloser Market Attractiveness Analysis By Control
10. Global Recloser Market Attractiveness Analysis By Insulation
11. Global Recloser Market Attractiveness Analysis By Voltage
12. Global Recloser Market Attractiveness Analysis By Region
13. Global Recloser Market: Dynamics
14. Global Recloser Market Share By Type (2024 & 2033)
15. Global Recloser Market Share By Control (2024 & 2033)
16. Global Recloser Market Share By Insulation (2024 & 2033)
17. Global Recloser Market Share By Voltage (2024 & 2033)
18. Global Recloser Market Share By Regions (2024 & 2033)
19. Global Recloser Market Share by Company (2023)
This study forecasts revenue at global, regional, and country levels from 2020 to 2033. The Brainy Insights has segmented the global Recloser market based on below-mentioned segments:
Global Recloser Market by Type:
Global Recloser Market by Control:
Global Recloser Market by Insulation:
Global Recloser Market by Voltage:
Global Recloser Market by Region:
Research has its special purpose to undertake marketing efficiently. In this competitive scenario, businesses need information across all industry verticals; the information about customer wants, market demand, competition, industry trends, distribution channels etc. This information needs to be updated regularly because businesses operate in a dynamic environment. Our organization, The Brainy Insights incorporates scientific and systematic research procedures in order to get proper market insights and industry analysis for overall business success. The analysis consists of studying the market from a miniscule level wherein we implement statistical tools which helps us in examining the data with accuracy and precision.
Our research reports feature both; quantitative and qualitative aspects for any market. Qualitative information for any market research process are fundamental because they reveal the customer needs and wants, usage and consumption for any product/service related to a specific industry. This in turn aids the marketers/investors in knowing certain perceptions of the customers. Qualitative research can enlighten about the different product concepts and designs along with unique service offering that in turn, helps define marketing problems and generate opportunities. On the other hand, quantitative research engages with the data collection process through interviews, e-mail interactions, surveys and pilot studies. Quantitative aspects for the market research are useful to validate the hypotheses generated during qualitative research method, explore empirical patterns in the data with the help of statistical tools, and finally make the market estimations.
The Brainy Insights offers comprehensive research and analysis, based on a wide assortment of factual insights gained through interviews with CXOs and global experts and secondary data from reliable sources. Our analysts and industry specialist assume vital roles in building up statistical tools and analysis models, which are used to analyse the data and arrive at accurate insights with exceedingly informative research discoveries. The data provided by our organization have proven precious to a diverse range of companies, facilitating them to address issues such as determining which products/services are the most appealing, whether or not customers use the product in the manner anticipated, the purchasing intentions of the market and many others.
Our research methodology encompasses an idyllic combination of primary and secondary initiatives. Key phases involved in this process are listed below:

The phase involves the gathering and collecting of market data and its related information with the help of different sources & research procedures.

The data procurement stage involves in data gathering and collecting through various data sources.
This stage involves in extensive research. These data sources includes:
Purchased Database: Purchased databases play a crucial role in estimating the market sizes irrespective of the domain. Our purchased database includes:
Primary Research: The Brainy Insights interacts with leading companies and experts of the concerned domain to develop the analyst team’s market understanding and expertise. It improves and substantiates every single data presented in the market reports. Primary research mainly involves in telephonic interviews, E-mail interactions and face-to-face interviews with the raw material providers, manufacturers/producers, distributors, & independent consultants. The interviews that we conduct provides valuable data on market size and industry growth trends prevailing in the market. Our organization also conducts surveys with the various industry experts in order to gain overall insights of the industry/market. For instance, in healthcare industry we conduct surveys with the pharmacists, doctors, surgeons and nurses in order to gain insights and key information of a medical product/device/equipment which the customers are going to usage. Surveys are conducted in the form of questionnaire designed by our own analyst team. Surveys plays an important role in primary research because surveys helps us to identify the key target audiences of the market. Additionally, surveys helps to identify the key target audience engaged with the market. Our survey team conducts the survey by targeting the key audience, thus gaining insights from them. Based on the perspectives of the customers, this information is utilized to formulate market strategies. Moreover, market surveys helps us to understand the current competitive situation of the industry. To be precise, our survey process typically involve with the 360 analysis of the market. This analytical process begins by identifying the prospective customers for a product or service related to the market/industry to obtain data on how a product/service could fit into customers’ lives.

Secondary Research: The secondary data sources includes information published by the on-profit organizations such as World bank, WHO, company fillings, investor presentations, annual reports, national government documents, statistical databases, blogs, articles, white papers and others. From the annual report, we analyse a company’s revenue to understand the key segment and market share of that organization in a particular region. We analyse the company websites and adopt the product mapping technique which is important for deriving the segment revenue. In the product mapping method, we select and categorize the products offered by the companies catering to domain specific market, deduce the product revenue for each of the companies so as to get overall estimation of the market size. We also source data and analyses trends based on information received from supply side and demand side intermediaries in the value chain. The supply side denotes the data gathered from supplier, distributor, wholesaler and the demand side illustrates the data gathered from the end customers for respective market domain.

The supply side for a domain specific market is analysed by:
The demand side for the market is estimated through:
In-house Library: Apart from these third-party sources, we have our in-house library of qualitative and quantitative information. Our in-house database includes market data for various industry and domains. These data are updated on regular basis as per the changing market scenario. Our library includes, historic databases, internal audit reports and archives.
Sometimes there are instances where there is no metadata or raw data available for any domain specific market. For those cases, we use our expertise to forecast and estimate the market size in order to generate comprehensive data sets. Our analyst team adopt a robust research technique in order to produce the estimates:
Data Synthesis: This stage involves the analysis & mapping of all the information obtained from the previous step. It also involves in scrutinizing the data for any discrepancy observed while data gathering related to the market. The data is collected with consideration to the heterogeneity of sources. Robust scientific techniques are in place for synthesizing disparate data sets and provide the essential contextual information that can orient market strategies. The Brainy Insights has extensive experience in data synthesis where the data passes through various stages:


Market Deduction & Formulation: The final stage comprises of assigning data points at appropriate market spaces so as to deduce feasible conclusions. Analyst perspective & subject matter expert based holistic form of market sizing coupled with industry analysis also plays a crucial role in this stage.
This stage involves in finalization of the market size and numbers that we have collected from data integration step. With data interpolation, it is made sure that there is no gap in the market data. Successful trend analysis is done by our analysts using extrapolation techniques, which provide the best possible forecasts for the market.
Data Validation & Market Feedback: Validation is the most important step in the process. Validation & re-validation via an intricately designed process helps us finalize data-points to be used for final calculations.

The Brainy Insights interacts with leading companies and experts of the concerned domain to develop the analyst team’s market understanding and expertise. It improves and substantiates every single data presented in the market reports. The data validation interview and discussion panels are typically composed of the most experienced industry members. The participants include, however, are not limited to:
Moreover, we always validate our data and findings through primary respondents from all the major regions we are working on.


Free Customization
Fortune 500 Clients
Free Yearly Update On Purchase Of Multi/Corporate License
Companies Served Till Date