- +1-315-215-1633
- sales@thebrainyinsights.com

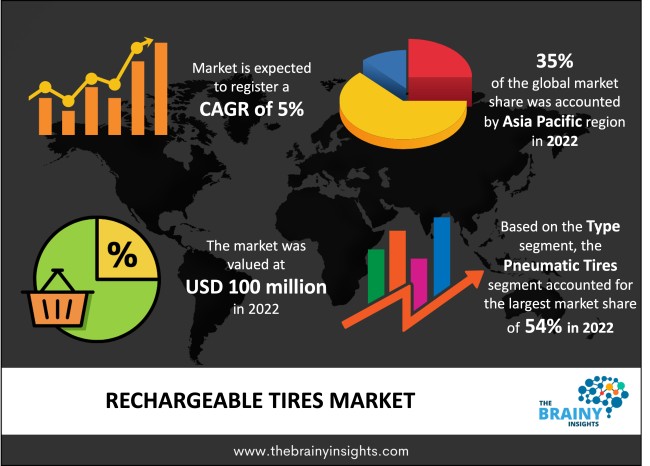
The global rechargeable tires market was valued at USD 100 million in 2022 and grew at a CAGR of 5% from 2023 to 2032. The market is expected to reach USD 162.88 million by 2032. The increasing demand for automobiles in developing nations will drive the global rechargeable tires market's growth.
The vehicles are assembled by putting together several automotive parts and components. Each component is designed for a specific function and integrated to create an efficient vehicle. The tires are one such component. They carry a vehicle's weight from the axle to the ground and provide grip on the surface. They are ring-shaped parts and surround the wheel's rim. A tire typically contains compressed air. A good tire can impact the vehicle's life span, fuel efficiency, and engine performance. A good tire promotes Fuel efficiency, offers an extended life span, and has enhanced durability, strength and stability. It should offer a comfortable ride to the users. With technological advancements and product innovations, advanced and enhanced tires are being developed by market players. Rechargeable tires are one such product innovation that is gaining traction worldwide. Rechargeable tires have a reloadable and biodegradable tread compound. This compound is recharged with individual capsules filled with a special liquid substance. The substance has chemical properties that enable the tread to renew. A rechargeable tire is flexible and adjusts according to the surrounding environment. It also promotes customization according to the needs and objectives of the consumer. They are environmentally friendly and sustainable as the composite is made from biological substances. The rechargeable tires are highly durable, lightweight and strong. They are easy to install and have low maintenance. They promote engine performance and better fuel efficiency.
Get an overview of this study by requesting a free sample
The increasing demand for fuel-efficient automobile technologies – The rising population and increasing disposable income in developing nations drive consumer demand. A significant portion of the rising consumer demand is in the automobile sector. However, the growing concerns about carbon emissions from fossil-fuel-based cars have promoted the development of eco-friendly, sustainable and fuel-efficient mobility solutions. The market players, consumers and government institutions are encouraging and promoting sustainable mobility solutions like rechargeable tires. These tires are eco-friendly, sustainable, lightweight and durable. They improve engine performance and fuel efficiency. They also reduce the need for regular tire maintenance, reducing recurring costs. Given the rising climate change concerns, the increasing demand and production of electric vehicles will also augment the global rechargeable tires market as they are ideal for EVs and electric-hybrid vehicles. Therefore, the increasing demand for fuel-efficient technologies in the automotive sector will drive the global rechargeable tires market demand.
Very few market players are engaged in the rechargeable tires market – The concept of rechargeable tires is new. Very few players are engaged in the research and development of new tires. The technology is still being tested to identify kinks and rectify them for wider application in the global market. Fewer original equipment manufacturers are producing rechargeable tires. Therefore, the dearth of rechargeable tire manufacturers, producers and developers will restrict the market's growth.
The increasing research and development – the growing emphasis on developing sustainable and eco-friendly mobility solutions has garnered pace in the past few years, given the accelerating pace of climate change. Therefore, the market players are investing heavily in developing fuel-efficient and sustainable mobility solutions. The governments are also encouraging the development and production of such technologies. Consumer awareness about climate change is rising among consumers, which is also increasing the demand for fuel-efficient technologies in the automotive sector. Therefore, the increasing research and development in the global rechargeable tires market will offer lucrative opportunities to the industry participants in the forecast period.
The regions analyzed for the market include North America, Europe, South America, Asia Pacific, the Middle East, and Africa. Asia Pacific emerged as the largest global rechargeable tires market, with a 35% market revenue share in 2022.
Asia Pacific region will account for the largest market share with revenue growth. The growing population with rising per capita income is increasing the demand for automobiles in the region. The presence of key players in the market is fulfilling the regional consumer demand. The growing emphasis on adopting sustainable mobility solutions will benefit the market. Increasing electric vehicle demand will also promote the regional rechargeable tires market's growth. The Chinese market dominates the space with the highest production and consumption of electric vehicles. The regional market has a significantly high potential of adopting rechargeable tires and letting the market expand.
Asia Pacific Region Rechargeable Tires Market Share in 2022 - 35%
www.thebrainyinsights.com
Check the geographical analysis of this market by requesting a free sample
The type segment is divided into pneumatic tires, run-flat tires and non-pneumatic tires. The pneumatic tires segment dominated the market, with a market share of around 54% in 2022. a rubber tire with air inflated inside is called a pneumatic tire. It is primarily used in automobiles. A good pneumatic tire has great support strength, durability, shock absorption capacity, and flexibility for steady traction for steering and braking. They enable stable heading and steering control. They offer greater absorption capacity on uneven ground. They have thicker treads. They form the majority of automobiles on the road or in use, dominating the global rechargeable tires market.
The application segment is divided into passenger cars and commercial vehicles. The passenger segment dominated the market, with a market share of around 58% in 2022. A passenger automobile is a multi-track vehicle. It generally has four wheels and two axles. It is primarily designed to move people. The majority of passenger cars are employed in public transportation. The dominance of this market segment has been attributed to the rising demand for passenger vehicles in developing nations because of the increase in passengers' disposable income. Innovation and an increasing number of automobile manufacturers and suppliers are also contributing to the rising dominance of this segment in the global rechargeable tires market. Furthermore, the application of rechargeable tires in passenger cars is greater than in commercial vehicles.
| Attribute | Description |
|---|---|
| Market Size | Revenue (USD Million) |
| Market size value in 2022 | USD 100 Million |
| Market size value in 2032 | USD 162.88 Million |
| CAGR (2023 to 2032) | 5% |
| Historical data | 2019-2021 |
| Base Year | 2022 |
| Forecast | 2023-2032 |
| Region | The regions analyzed for the market are Asia Pacific, Europe, South America, North America, and Middle East & Africa. Furthermore, the regions are further analyzed at the country level. |
| Segments | Type and Application |
As per The Brainy Insights, the size of the global rechargeable tires market was valued at USD 100 million in 2022 to USD 162.88 million by 2032.
Global rechargeable tires market is growing at a CAGR of 5% during the forecast period 2023-2032.
The market's growth will be influenced by the increasing demand for fuel-efficient automobile technologies.
Very few market players are engaged in the rechargeable tires market and that could hamper the market growth.
1. Introduction
1.1. Objectives of the Study
1.2. Market Definition
1.3. Research Scope
1.4. Currency
1.5. Key Target Audience
2. Research Methodology and Assumptions
3. Executive Summary
4. Premium Insights
4.1. Porter’s Five Forces Analysis
4.2. Value Chain Analysis
4.3. Top Investment Pockets
4.3.1. Market Attractiveness Analysis By Type
4.3.2. Market Attractiveness Analysis By Application
4.3.3. Market Attractiveness Analysis By Region
4.4. Industry Trends
5. Market Dynamics
5.1. Market Evaluation
5.2. Drivers
5.2.1. The increasing demand for fuel-efficient automobile technologies
5.3. Restraints
5.3.1. Very few market players are engaged in the rechargeable tires market
5.4. Opportunities
5.4.1. The increasing research and development
5.5. Challenges
5.5.1. Presence of competing fuel-efficient technologies
6. Global Rechargeable Tires Market Analysis and Forecast, By Type
6.1. Segment Overview
6.2. Pneumatic Tires
6.3. Run-Flat Tires
6.4. Non-Pneumatic Tires
7. Global Rechargeable Tires Market Analysis and Forecast, By Application
7.1. Segment Overview
7.2. Passenger Cars
7.3. Commercial Vehicles
8. Global Rechargeable Tires Market Analysis and Forecast, By Regional Analysis
8.1. Segment Overview
8.2. North America
8.2.1. U.S.
8.2.2. Canada
8.2.3. Mexico
8.3. Europe
8.3.1. Germany
8.3.2. France
8.3.3. U.K.
8.3.4. Italy
8.3.5. Spain
8.4. Asia-Pacific
8.4.1. Japan
8.4.2. China
8.4.3. India
8.5. South America
8.5.1. Brazil
8.6. Middle East and Africa
8.6.1. UAE
8.6.2. South Africa
9. Global Rechargeable Tires Market-Competitive Landscape
9.1. Overview
9.2. Market Share of Key Players in the Rechargeable Tires Market
9.2.1. Global Company Market Share
9.2.2. North America Company Market Share
9.2.3. Europe Company Market Share
9.2.4. APAC Company Market Share
9.3. Competitive Situations and Trends
9.3.1. Product Launches and Developments
9.3.2. Partnerships, Collaborations, and Agreements
9.3.3. Mergers & Acquisitions
9.3.4. Expansions
10. Company Profiles
10.1. Bridgestone Corporation
10.1.1. Business Overview
10.1.2. Company Snapshot
10.1.3. Company Market Share Analysis
10.1.4. Company Product Portfolio
10.1.5. Recent Developments
10.1.6. SWOT Analysis
10.2. Continental AG
10.2.1. Business Overview
10.2.2. Company Snapshot
10.2.3. Company Market Share Analysis
10.2.4. Company Product Portfolio
10.2.5. Recent Developments
10.2.6. SWOT Analysis
10.3. Goodyear Tire and Rubber Company
10.3.1. Business Overview
10.3.2. Company Snapshot
10.3.3. Company Market Share Analysis
10.3.4. Company Product Portfolio
10.3.5. Recent Developments
10.3.6. SWOT Analysis
10.4. Hankook Tire Technology Co. Ltd.
10.4.1. Business Overview
10.4.2. Company Snapshot
10.4.3. Company Market Share Analysis
10.4.4. Company Product Portfolio
10.4.5. Recent Developments
10.4.6. SWOT Analysis
10.5. Michelin
10.5.1. Business Overview
10.5.2. Company Snapshot
10.5.3. Company Market Share Analysis
10.5.4. Company Product Portfolio
10.5.5. Recent Developments
10.5.6. SWOT Analysis
10.6. Nexen Tire Corporation
10.6.1. Business Overview
10.6.2. Company Snapshot
10.6.3. Company Market Share Analysis
10.6.4. Company Product Portfolio
10.6.5. Recent Developments
10.6.6. SWOT Analysis
10.7. Pirelli
10.7.1. Business Overview
10.7.2. Company Snapshot
10.7.3. Company Market Share Analysis
10.7.4. Company Product Portfolio
10.7.5. Recent Developments
10.7.6. SWOT Analysis
10.8. Sumitomo Rubber Industries Ltd.
10.8.1. Business Overview
10.8.2. Company Snapshot
10.8.3. Company Market Share Analysis
10.8.4. Company Product Portfolio
10.8.5. Recent Developments
10.8.6. SWOT Analysis
10.9. Toyo Tire and Rubber Co. Ltd.
10.9.1. Business Overview
10.9.2. Company Snapshot
10.9.3. Company Market Share Analysis
10.9.4. Company Product Portfolio
10.9.5. Recent Developments
10.9.6. SWOT Analysis
10.10. Yokohama Rubber Company
10.10.1. Business Overview
10.10.2. Company Snapshot
10.10.3. Company Market Share Analysis
10.10.4. Company Component Portfolio
10.10.5. Recent Developments
10.10.6. SWOT Analysis
List of Table
1. Global Rechargeable Tires Market, By Type, 2019-2032 (USD Million)
2. Global Pneumatic Tires Rechargeable Tires Market, By Region, 2019-2032 (USD Million)
3. Global Run-Flat Tires Rechargeable Tires Market, By Region, 2019-2032 (USD Million)
4. Global Non-Pneumatic Tires Rechargeable Tires Market, By Region, 2019-2032 (USD Million)
5. Global Rechargeable Tires Market, By Application, 2019-2032 (USD Million)
6. Global Passenger Cars Rechargeable Tires Market, By Region, 2019-2032 (USD Million)
7. Global Commercial Vehicles Rechargeable Tires Market, By Region, 2019-2032 (USD Million)
8. Global Rechargeable Tires Market, By Region, 2019-2032 (USD Million)
9. North America Rechargeable Tires Market, By Type, 2019-2032 (USD Million)
10. North America Rechargeable Tires Market, By Application, 2019-2032 (USD Million)
11. U.S. Rechargeable Tires Market, By Type, 2019-2032 (USD Million)
12. U.S. Rechargeable Tires Market, By Application, 2019-2032 (USD Million)
13. Canada Rechargeable Tires Market, By Type, 2019-2032 (USD Million)
14. Canada Rechargeable Tires Market, By Application, 2019-2032 (USD Million)
15. Mexico Rechargeable Tires Market, By Type, 2019-2032 (USD Million)
16. Mexico Rechargeable Tires Market, By Application, 2019-2032 (USD Million)
17. Europe Rechargeable Tires Market, By Type, 2019-2032 (USD Million)
18. Europe Rechargeable Tires Market, By Application, 2019-2032 (USD Million)
19. Germany Rechargeable Tires Market, By Type, 2019-2032 (USD Million)
20. Germany Rechargeable Tires Market, By Application, 2019-2032 (USD Million)
21. France Rechargeable Tires Market, By Type, 2019-2032 (USD Million)
22. France Rechargeable Tires Market, By Application, 2019-2032 (USD Million)
23. U.K. Rechargeable Tires Market, By Type, 2019-2032 (USD Million)
24. U.K. Rechargeable Tires Market, By Application, 2019-2032 (USD Million)
25. Italy Rechargeable Tires Market, By Type, 2019-2032 (USD Million)
26. Italy Rechargeable Tires Market, By Application, 2019-2032 (USD Million)
27. Spain Rechargeable Tires Market, By Type, 2019-2032 (USD Million)
28. Spain Rechargeable Tires Market, By Application, 2019-2032 (USD Million)
29. Asia Pacific Rechargeable Tires Market, By Type, 2019-2032 (USD Million)
30. Asia Pacific Rechargeable Tires Market, By Application, 2019-2032 (USD Million)
31. Japan Rechargeable Tires Market, By Type, 2019-2032 (USD Million)
32. Japan Rechargeable Tires Market, By Application, 2019-2032 (USD Million)
33. China Rechargeable Tires Market, By Type, 2019-2032 (USD Million)
34. China Rechargeable Tires Market, By Application, 2019-2032 (USD Million)
35. India Rechargeable Tires Market, By Type, 2019-2032 (USD Million)
36. India Rechargeable Tires Market, By Application, 2019-2032 (USD Million)
37. South America Rechargeable Tires Market, By Type, 2019-2032 (USD Million)
38. South America Rechargeable Tires Market, By Application, 2019-2032 (USD Million)
39. Brazil Rechargeable Tires Market, By Type, 2019-2032 (USD Million)
40. Brazil Rechargeable Tires Market, By Application, 2019-2032 (USD Million)
41. Middle East and Africa Rechargeable Tires Market, By Type, 2019-2032 (USD Million)
42. Middle East and Africa Rechargeable Tires Market, By Application, 2019-2032 (USD Million)
43. UAE Rechargeable Tires Market, By Type, 2019-2032 (USD Million)
44. UAE Rechargeable Tires Market, By Application, 2019-2032 (USD Million)
45. South Africa Rechargeable Tires Market, By Type, 2019-2032 (USD Million)
46. South Africa Rechargeable Tires Market, By Application, 2019-2032 (USD Million)
List of Figures
1. Global Rechargeable Tires Market Segmentation
2. Rechargeable Tires Market: Research Methodology
3. Market Size Estimation Methodology: Bottom-Up Approach
4. Market Size Estimation Methodology: Top-Down Approach
5. Data Triangulation
6. Porter’s Five Forces Analysis
7. Value Chain Analysis
8. Global Rechargeable Tires Market Attractiveness Analysis By Type
9. Global Rechargeable Tires Market Attractiveness Analysis By Application
10. Global Rechargeable Tires Market Attractiveness Analysis By Region
11. Global Rechargeable Tires Market: Dynamics
12. Global Rechargeable Tires Market Share by Type (2022 & 2032)
13. Global Rechargeable Tires Market Share by Application (2022 & 2032)
14. Global Rechargeable Tires Market Share by Regions (2022 & 2032)
15. Global Rechargeable Tires Market Share by Company (2022)
This study forecasts revenue at global, regional, and country levels from 2019 to 2032. The Brainy Insights has segmented the global rechargeable tires market based on below mentioned segments:
Global Rechargeable Tires Market by Type:
Global Rechargeable Tires Market by Application:
Global Rechargeable Tires Market by Region:
Research has its special purpose to undertake marketing efficiently. In this competitive scenario, businesses need information across all industry verticals; the information about customer wants, market demand, competition, industry trends, distribution channels etc. This information needs to be updated regularly because businesses operate in a dynamic environment. Our organization, The Brainy Insights incorporates scientific and systematic research procedures in order to get proper market insights and industry analysis for overall business success. The analysis consists of studying the market from a miniscule level wherein we implement statistical tools which helps us in examining the data with accuracy and precision.
Our research reports feature both; quantitative and qualitative aspects for any market. Qualitative information for any market research process are fundamental because they reveal the customer needs and wants, usage and consumption for any product/service related to a specific industry. This in turn aids the marketers/investors in knowing certain perceptions of the customers. Qualitative research can enlighten about the different product concepts and designs along with unique service offering that in turn, helps define marketing problems and generate opportunities. On the other hand, quantitative research engages with the data collection process through interviews, e-mail interactions, surveys and pilot studies. Quantitative aspects for the market research are useful to validate the hypotheses generated during qualitative research method, explore empirical patterns in the data with the help of statistical tools, and finally make the market estimations.
The Brainy Insights offers comprehensive research and analysis, based on a wide assortment of factual insights gained through interviews with CXOs and global experts and secondary data from reliable sources. Our analysts and industry specialist assume vital roles in building up statistical tools and analysis models, which are used to analyse the data and arrive at accurate insights with exceedingly informative research discoveries. The data provided by our organization have proven precious to a diverse range of companies, facilitating them to address issues such as determining which products/services are the most appealing, whether or not customers use the product in the manner anticipated, the purchasing intentions of the market and many others.
Our research methodology encompasses an idyllic combination of primary and secondary initiatives. Key phases involved in this process are listed below:

The phase involves the gathering and collecting of market data and its related information with the help of different sources & research procedures.

The data procurement stage involves in data gathering and collecting through various data sources.
This stage involves in extensive research. These data sources includes:
Purchased Database: Purchased databases play a crucial role in estimating the market sizes irrespective of the domain. Our purchased database includes:
Primary Research: The Brainy Insights interacts with leading companies and experts of the concerned domain to develop the analyst team’s market understanding and expertise. It improves and substantiates every single data presented in the market reports. Primary research mainly involves in telephonic interviews, E-mail interactions and face-to-face interviews with the raw material providers, manufacturers/producers, distributors, & independent consultants. The interviews that we conduct provides valuable data on market size and industry growth trends prevailing in the market. Our organization also conducts surveys with the various industry experts in order to gain overall insights of the industry/market. For instance, in healthcare industry we conduct surveys with the pharmacists, doctors, surgeons and nurses in order to gain insights and key information of a medical product/device/equipment which the customers are going to usage. Surveys are conducted in the form of questionnaire designed by our own analyst team. Surveys plays an important role in primary research because surveys helps us to identify the key target audiences of the market. Additionally, surveys helps to identify the key target audience engaged with the market. Our survey team conducts the survey by targeting the key audience, thus gaining insights from them. Based on the perspectives of the customers, this information is utilized to formulate market strategies. Moreover, market surveys helps us to understand the current competitive situation of the industry. To be precise, our survey process typically involve with the 360 analysis of the market. This analytical process begins by identifying the prospective customers for a product or service related to the market/industry to obtain data on how a product/service could fit into customers’ lives.

Secondary Research: The secondary data sources includes information published by the on-profit organizations such as World bank, WHO, company fillings, investor presentations, annual reports, national government documents, statistical databases, blogs, articles, white papers and others. From the annual report, we analyse a company’s revenue to understand the key segment and market share of that organization in a particular region. We analyse the company websites and adopt the product mapping technique which is important for deriving the segment revenue. In the product mapping method, we select and categorize the products offered by the companies catering to domain specific market, deduce the product revenue for each of the companies so as to get overall estimation of the market size. We also source data and analyses trends based on information received from supply side and demand side intermediaries in the value chain. The supply side denotes the data gathered from supplier, distributor, wholesaler and the demand side illustrates the data gathered from the end customers for respective market domain.

The supply side for a domain specific market is analysed by:
The demand side for the market is estimated through:
In-house Library: Apart from these third-party sources, we have our in-house library of qualitative and quantitative information. Our in-house database includes market data for various industry and domains. These data are updated on regular basis as per the changing market scenario. Our library includes, historic databases, internal audit reports and archives.
Sometimes there are instances where there is no metadata or raw data available for any domain specific market. For those cases, we use our expertise to forecast and estimate the market size in order to generate comprehensive data sets. Our analyst team adopt a robust research technique in order to produce the estimates:
Data Synthesis: This stage involves the analysis & mapping of all the information obtained from the previous step. It also involves in scrutinizing the data for any discrepancy observed while data gathering related to the market. The data is collected with consideration to the heterogeneity of sources. Robust scientific techniques are in place for synthesizing disparate data sets and provide the essential contextual information that can orient market strategies. The Brainy Insights has extensive experience in data synthesis where the data passes through various stages:


Market Deduction & Formulation: The final stage comprises of assigning data points at appropriate market spaces so as to deduce feasible conclusions. Analyst perspective & subject matter expert based holistic form of market sizing coupled with industry analysis also plays a crucial role in this stage.
This stage involves in finalization of the market size and numbers that we have collected from data integration step. With data interpolation, it is made sure that there is no gap in the market data. Successful trend analysis is done by our analysts using extrapolation techniques, which provide the best possible forecasts for the market.
Data Validation & Market Feedback: Validation is the most important step in the process. Validation & re-validation via an intricately designed process helps us finalize data-points to be used for final calculations.

The Brainy Insights interacts with leading companies and experts of the concerned domain to develop the analyst team’s market understanding and expertise. It improves and substantiates every single data presented in the market reports. The data validation interview and discussion panels are typically composed of the most experienced industry members. The participants include, however, are not limited to:
Moreover, we always validate our data and findings through primary respondents from all the major regions we are working on.


Free Customization
Fortune 500 Clients
Free Yearly Update On Purchase Of Multi/Corporate License
Companies Served Till Date