- +1-315-215-1633
- sales@thebrainyinsights.com

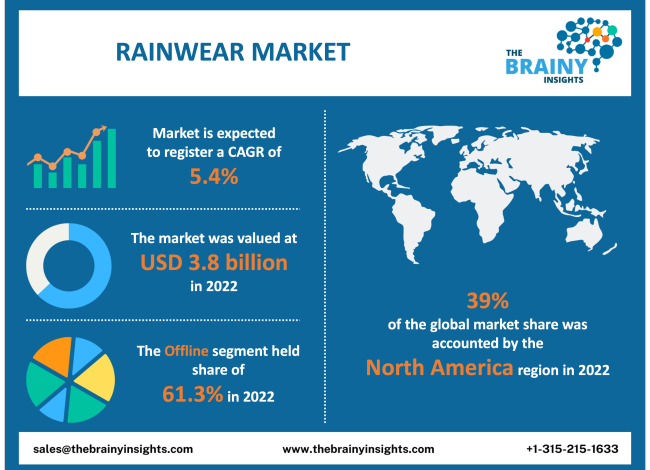
The global Rainwear market is expected to reach USD 6.4 billion by 2032, at a CAGR of 5.4% during the forecast period 2022 to 2032. Asia Pacific is expected to grow the fastest during the forecast period.
Rainwear is a type of clothing that protects both the user and their clothes from the effects of rain. Rain boots, raincoats, and rain jackets are the products that fall within the rainwear category. The type of fabric used in manufacturing rainwear and how it is cut are the two key elements that influence the quality and lifespan of rainwear clothes. Polyester, nylon, and vinyl are the principal materials used to manufacture rainwear. Customers can get their hands on rainwear from online and offline stores. Rainwear goods are relatively inexpensive, which has increased the market's appeal to customers in terms of both affordability and demand. Another element contributing to the market's growth is the availability of various rainwear clothes from prominent and local manufacturers. Several companies in the rainwear industry are investing considerably in intensive research and development operations to manufacture environmentally friendly and long-lasting products.
Get an overview of this study by requesting a free sample
Rising employment- Public transportation is typically time-consuming for city commuters. As a result, many people prefer to drive their own vehicles, motorcycles, or autos to work rather than using public transportation. As a result, people who travel through densely populated areas frequently purchase protective clothing to protect themselves from the negative impacts of natural factors such as pollution, wind, dust, and heat. As a result, commuters in every corner of the world are increasingly wearing rainwear, such as motorcycle rainwear.
Bulky Material- The oilcloth material used for manufacturing rainwear is heavier, making the final product cumbersome and making it difficult to participate in outdoor events wearing these clothes. Thus, many users refrain from wearing this rainwear while playing outdoor sports, thus restraining the market's growth.
Rising Millennial Population- An increasing trend of outdoor and fun events such as mountaineering, trekking, and cross-country riding among millennials is expected to provide growth opportunities during the forecast period. Furthermore, the massive growth in people's disposable income and changing lifestyles is also expected to add impetus to the market's growth during the forecast period.
Price Fluctuation- Rain wears are not useful in areas that are less likely to experience significant rains, which is projected to affect the market's expansion in various countries and regions. Additionally, changes in raw material prices will probably make it difficult for the market to expand during the forecast period.
The regions analyzed for the market include North America, Europe, South America, Asia Pacific, the Middle East, and Africa. North America emerged as the largest market for the global rainwear market, with a 39% share of the market revenue in 2022.
The increased involvement of people in outdoor events such as motorbiking, hiking, running, and others are driving the market in the region. The 2021 Outdoor Participation Trends Report, commissioned by the Outdoor Foundation, found that the percentage of Americans aged six and up who participated in outdoor sports at least once in 2020 was at an all-time high. As per the survey, the highly popular sports in the United States are running, jogging, trail running, and hiking, followed by fishing, road biking, and cycling. This adds impetus to the market's growth in the region.
Asia Pacific is expected to witness the fastest growth during the forecast period. A significant working population in China and India aided regional market expansion. Furthermore, the region's increased outdoor participation drives up rainwear demand. According to Sports Australia's Emerging Sports Participation Trends Report 2021, 62.1% of Australians aged 15 to 55 engaged in outdoor sports in 2020. Walking, running, and jogging was the most liked outdoor events in Australia, followed by fishing, cycling, and mountain biking.
North America Region Rainwear Market Share in 2022 - 39%
www.thebrainyinsights.com
Check the geographical analysis of this market by requesting a free sample
The product segment is divided into suits, pants, and jackets. The jackets segment dominated the market, with a market share of around 40.2% in 2022. The market is primarily driven because of the high requirement for jackets among young people, athletes, bikers and working professionals. Rain jacket demand is increasing due to advancements in product patterns, availability, and ease to wear. Furthermore, a crucial component driving the segment is the expanding need for raincoats and jackets among working-class people worldwide.
The end-user segment is divided into kids, women, and men. Over the forecast period, the men segment is expected to grow at the fastest CAGR of 5.9%. The segment is primarily driven by the vast majority of men who engage in enjoyable events, the vast majority of men who work as professionals, and the vast majority of men who use rainwear globally. The primary rainwear category's availability of several product styles and categories has also impacted the segment's expansion.
The distribution channel segment is divided into online and offline. The offline segment dominated, with a market share of around 61.3% in 2022. One of the most accepted distribution channels is retailers that sell rainwear in various styles and brands. Before making a purchase, customers at these shops can pick from various brands. Supermarkets provide discounts and other comparable benefits to draw customers and enhance product sales. They serve as distribution centres for parent organizations, providing a variety of brands at one location. Offline distribution had the major market share since it offered a wide variety of products and was convenient.
| Attribute | Description |
|---|---|
| Market Size | Revenue (USD Billion) |
| Market size value in 2022 | USD 3.8 billion |
| Market size value in 2032 | USD 6.4 billion |
| CAGR (2023 to 2032) | 5.4% |
| Historical data | 2019-2021 |
| Base Year | 2022 |
| Forecast | 2023-2032 |
| Regional Segments | North America, Asia Pacific, Europe, Latin America, Middle East and Africa |
| Segments | Product, End-User, Distribution Channel |
As per The Brainy Insights, the size of the rainwear market was valued at USD 3.8 billion in 2022 to USD 6.4 billion by 2032.
The global rainwear market is growing at a CAGR of 5.4% during the forecast period 2023-2032.
North America emerged as the largest market for rainwear.
1. Introduction
1.1. Objectives of the Study
1.2. Market Definition
1.3. Research Scope
1.4. Currency
1.5. Key Target Audience
2. Research Methodology and Assumptions
3. Executive Summary
4. Premium Insights
4.1. Porter’s Five Forces Analysis
4.2. Value Chain Analysis
4.3. Top Investment Pockets
4.3.1. Market Attractiveness Analysis by Product
4.3.2. Market Attractiveness Analysis by End-User
4.3.3. Market Attractiveness Analysis by Distribution Channel
4.3.4. Market Attractiveness Analysis by Region
1.1. Industry Trends
2. Market Dynamics
2.1. Market Evaluation
2.2. Drivers
2.2.1. Rising Labor Force
2.3. Restraints
2.3.1. Bulky Material
2.4. Opportunities
2.4.1. Rising Millennial Population
2.5. Challenges
2.5.1. Price Fluctuation
3. Global Rainwear Market Analysis and Forecast, By Product
3.1. Segment Overview
3.2. Suits
3.3. Pants
3.4. Jackets
4. Global Rainwear Market Analysis and Forecast, By End-User
4.1. Segment Overview
4.2. Kids
4.3. Women
4.4. Men
5. Global Rainwear Market Analysis and Forecast, By Distribution Channel
5.1. Segment Overview
5.2. Online
5.3. Offline
6. Global Rainwear Market Analysis and Forecast, By Regional Analysis
6.1. Segment Overview
6.2. North America
6.2.1. U.S.
6.2.2. Canada
6.2.3. Mexico
6.3. Europe
6.3.1. Germany
6.3.2. France
6.3.3. U.K.
6.3.4. Italy
6.3.5. Spain
6.4. Asia-Pacific
6.4.1. Japan
6.4.2. China
6.4.3. India
6.5. South America
6.5.1. Brazil
6.6. Middle East and Africa
6.6.1. UAE
6.6.2. South Africa
7. Global Rainwear Market-Competitive Landscape
7.1. Overview
7.2. Market Share of Key Players in the Global Rainwear Market
7.2.1. Global Company Market Share
7.2.2. North America Company Market Share
7.2.3. Europe Company Market Share
7.2.4. APAC Company Market Share
7.3. Competitive Situations and Trends
7.3.1. Product Launches and Developments
7.3.2. Partnerships, Collaborations, and Agreements
7.3.3. Mergers & Acquisitions
7.3.4. Expansions
8. Company Profiles
8.1. Patagonia, Inc.
8.1.1. Business Overview
8.1.2. Company Snapshot
8.1.3. Company Market Share Analysis
8.1.4. Company Product Portfolio
8.1.5. Recent Developments
8.1.6. SWOT Analysis
8.2. The North Face (VF Outdoor LLC)
8.2.1. Business Overview
8.2.2. Company Snapshot
8.2.3. Company Market Share Analysis
8.2.4. Company Product Portfolio
8.2.5. Recent Developments
8.2.6. SWOT Analysis
8.3. Columbia Sportswear Company
8.3.1. Business Overview
8.3.2. Company Snapshot
8.3.3. Company Market Share Analysis
8.3.4. Company Product Portfolio
8.3.5. Recent Developments
8.3.6. SWOT Analysis
8.4. NZ Seasonalwear Pvt Ltd
8.4.1. Business Overview
8.4.2. Company Snapshot
8.4.3. Company Market Share Analysis
8.4.4. Company Product Portfolio
8.4.5. Recent Developments
8.4.6. SWOT Analysis
8.5. Wildcraft India Private Limited
8.5.1. Business Overview
8.5.2. Company Snapshot
8.5.3. Company Market Share Analysis
8.5.4. Company Product Portfolio
8.5.5. Recent Developments
8.5.6. SWOT Analysis
8.6. Ducktail Rainwear
8.6.1. Business Overview
8.6.2. Company Snapshot
8.6.3. Company Market Share Analysis
8.6.4. Company Product Portfolio
8.6.5. Recent Developments
8.6.6. SWOT Analysis
8.7. Stutterheim
8.7.1. Business Overview
8.7.2. Company Snapshot
8.7.3. Company Market Share Analysis
8.7.4. Company Product Portfolio
8.7.5. Recent Developments
8.7.6. SWOT Analysis
8.8. Arc’teryx(Amer Sports Corporation)
8.8.1. Business Overview
8.8.2. Company Snapshot
8.8.3. Company Market Share Analysis
8.8.4. Company Product Portfolio
8.8.5. Recent Developments
8.8.6. SWOT Analysis
8.9. Marmot Mountain, LLC
8.9.1. Business Overview
8.9.2. Company Snapshot
8.9.3. Company Market Share Analysis
8.9.4. Company Product Portfolio
8.9.5. Recent Developments
8.9.6. SWOT Analysis
8.10. Outdoor Research
8.10.1. Business Overview
8.10.2. Company Snapshot
8.10.3. Company Market Share Analysis
8.10.4. Company Product Portfolio
8.10.5. Recent Developments
8.10.6. SWOT Analysis
List of Table
1. Global Rainwear Market, By Product, 2019-2032 (USD Billion)
2. Global Suits, Rainwear Market, By Region, 2019-2032 (USD Billion)
3. Global Pants, Rainwear Market, By Region, 2019-2032 (USD Billion)
4. Global Jackets, Rainwear Market, By Region, 2019-2032 (USD Billion)
5. Global Rainwear Market, By End-User, 2019-2032 (USD Billion)
6. Global Kids, Rainwear Market, By Region, 2019-2032 (USD Billion)
7. Global Women, Rainwear Market, By Region, 2019-2032 (USD Billion)
8. Global Men, Rainwear Market, By Region, 2019-2032 (USD Billion)
9. Global Rainwear Market, By Distribution Channel, 2019-2032 (USD Billion)
10. Global Online, Rainwear Market, By Region, 2019-2032 (USD Billion)
11. Global Offline, Rainwear Market, By Region, 2019-2032 (USD Billion)
12. North America Rainwear Market, By Product, 2019-2032 (USD Billion)
13. North America Rainwear Market, By End-User, 2019-2032 (USD Billion)
14. North America Rainwear Market, By Distribution Channel, 2019-2032 (USD Billion)
15. U.S. Rainwear Market, By Product, 2019-2032 (USD Billion)
16. U.S. Rainwear Market, By End-User, 2019-2032 (USD Billion)
17. U.S. Rainwear Market, By Distribution Channel, 2019-2032 (USD Billion)
18. Canada Rainwear Market, By Product, 2019-2032 (USD Billion)
19. Canada Rainwear Market, By End-User, 2019-2032 (USD Billion)
20. Canada Rainwear Market, By Distribution Channel, 2019-2032 (USD Billion)
21. Mexico Rainwear Market, By Product, 2019-2032 (USD Billion)
22. Mexico Rainwear Market, By End-User, 2019-2032 (USD Billion)
23. Mexico Rainwear Market, By Distribution Channel, 2019-2032 (USD Billion)
24. Europe Rainwear Market, By Product, 2019-2032 (USD Billion)
25. Europe Rainwear Market, By End-User, 2019-2032 (USD Billion)
26. Europe Rainwear Market, By Distribution Channel, 2019-2032 (USD Billion)
27. Germany Rainwear Market, By Product, 2019-2032 (USD Billion)
28. Germany Rainwear Market, By End-User, 2019-2032 (USD Billion)
29. Germany Rainwear Market, By Distribution Channel, 2019-2032 (USD Billion)
30. France Rainwear Market, By Product, 2019-2032 (USD Billion)
31. France Rainwear Market, By End-User, 2019-2032 (USD Billion)
32. France Rainwear Market, By Distribution Channel, 2019-2032 (USD Billion)
33. U.K. Rainwear Market, By Product, 2019-2032 (USD Billion)
34. U.K. Rainwear Market, By End-User, 2019-2032 (USD Billion)
35. U.K. Rainwear Market, By Distribution Channel, 2019-2032 (USD Billion)
36. Italy Rainwear Market, By Product, 2019-2032 (USD Billion)
37. Italy Rainwear Market, By End-User, 2019-2032 (USD Billion)
38. Italy Rainwear Market, By Distribution Channel, 2019-2032 (USD Billion)
39. Spain Rainwear Market, By Product, 2019-2032 (USD Billion)
40. Spain Rainwear Market, By End-User, 2019-2032 (USD Billion)
41. Spain Rainwear Market, By Distribution Channel, 2019-2032 (USD Billion)
42. Asia Pacific Rainwear Market, By Product, 2019-2032 (USD Billion)
43. Asia Pacific Rainwear Market, By End-User, 2019-2032 (USD Billion)
44. Asia Pacific Rainwear Market, By Distribution Channel, 2019-2032 (USD Billion)
45. Japan Rainwear Market, By Product, 2019-2032 (USD Billion)
46. Japan Rainwear Market, By End-User, 2019-2032 (USD Billion)
47. Japan Rainwear Market, By Distribution Channel, 2019-2032 (USD Billion)
48. China Rainwear Market, By Product, 2019-2032 (USD Billion)
49. China Rainwear Market, By End-User, 2019-2032 (USD Billion)
50. China Rainwear Market, By Distribution Channel, 2019-2032 (USD Billion)
51. India Rainwear Market, By Product, 2019-2032 (USD Billion)
52. India Rainwear Market, By End-User, 2019-2032 (USD Billion)
53. India Rainwear Market, By Distribution Channel, 2019-2032 (USD Billion)
54. South America Rainwear Market, By Product, 2019-2032 (USD Billion)
55. South America Rainwear Market, By End-User, 2019-2032 (USD Billion)
56. South America Rainwear Market, By Distribution Channel, 2019-2032 (USD Billion)
57. Brazil Rainwear Market, By Product, 2019-2032 (USD Billion)
58. Brazil Rainwear Market, By End-User, 2019-2032 (USD Billion)
59. Brazil Rainwear Market, By Distribution Channel, 2019-2032 (USD Billion)
60. Middle East and Africa Rainwear Market, By Product, 2019-2032 (USD Billion)
61. Middle East and Africa Rainwear Market, By End-User, 2019-2032 (USD Billion)
62. Middle East and Africa Rainwear Market, By Distribution Channel, 2019-2032 (USD Billion)
63. UAE Rainwear Market, By Product, 2019-2032 (USD Billion)
64. UAE Rainwear Market, By End-User, 2019-2032 (USD Billion)
65. UAE Rainwear Market, By Distribution Channel, 2019-2032 (USD Billion)
66. South Africa Rainwear Market, By Product, 2019-2032 (USD Billion)
67. South Africa Rainwear Market, By End-User, 2019-2032 (USD Billion)
68. South Africa Rainwear Market, By Distribution Channel, 2019-2032 (USD Billion)
List of Figures
1. Global Rainwear Market Segmentation
2. Global Rainwear Market: Research Methodology
3. Market Size Estimation Methodology: Bottom-Up Approach
4. Market Size Estimation Methodology: Top-Down Approach
5. Data Triangulation
6. Porter’s Five Forces Analysis
7. Value Chain Analysis
8. Global Rainwear Market Attractiveness Analysis by Product
9. Global Rainwear Market Attractiveness Analysis by End-User
10. Global Rainwear Market Attractiveness Analysis by Distribution Channel
11. Global Rainwear Market Attractiveness Analysis by Region
12. Global Rainwear Market: Dynamics
13. Global Rainwear Market Share by Product (2023 & 2032)
14. Global Rainwear Market Share by End-User (2023 & 2032)
15. Global Rainwear Market Share by Distribution Channel (2023 & 2032)
16. Global Rainwear Market Share by Regions (2023 & 2032)
17. Global Rainwear Market Share by Company (2022)
This study forecasts global, regional, and country revenue from 2019 to 2032. Brainy Insights has segmented the global rainwear market based on the below-mentioned segments:
Global Rainwear Market by Product:
Global Rainwear Market by End-User:
Global Rainwear Market by Distribution Channel:
Global Rainwear Market by Region:
Research has its special purpose to undertake marketing efficiently. In this competitive scenario, businesses need information across all industry verticals; the information about customer wants, market demand, competition, industry trends, distribution channels etc. This information needs to be updated regularly because businesses operate in a dynamic environment. Our organization, The Brainy Insights incorporates scientific and systematic research procedures in order to get proper market insights and industry analysis for overall business success. The analysis consists of studying the market from a miniscule level wherein we implement statistical tools which helps us in examining the data with accuracy and precision.
Our research reports feature both; quantitative and qualitative aspects for any market. Qualitative information for any market research process are fundamental because they reveal the customer needs and wants, usage and consumption for any product/service related to a specific industry. This in turn aids the marketers/investors in knowing certain perceptions of the customers. Qualitative research can enlighten about the different product concepts and designs along with unique service offering that in turn, helps define marketing problems and generate opportunities. On the other hand, quantitative research engages with the data collection process through interviews, e-mail interactions, surveys and pilot studies. Quantitative aspects for the market research are useful to validate the hypotheses generated during qualitative research method, explore empirical patterns in the data with the help of statistical tools, and finally make the market estimations.
The Brainy Insights offers comprehensive research and analysis, based on a wide assortment of factual insights gained through interviews with CXOs and global experts and secondary data from reliable sources. Our analysts and industry specialist assume vital roles in building up statistical tools and analysis models, which are used to analyse the data and arrive at accurate insights with exceedingly informative research discoveries. The data provided by our organization have proven precious to a diverse range of companies, facilitating them to address issues such as determining which products/services are the most appealing, whether or not customers use the product in the manner anticipated, the purchasing intentions of the market and many others.
Our research methodology encompasses an idyllic combination of primary and secondary initiatives. Key phases involved in this process are listed below:

The phase involves the gathering and collecting of market data and its related information with the help of different sources & research procedures.

The data procurement stage involves in data gathering and collecting through various data sources.
This stage involves in extensive research. These data sources includes:
Purchased Database: Purchased databases play a crucial role in estimating the market sizes irrespective of the domain. Our purchased database includes:
Primary Research: The Brainy Insights interacts with leading companies and experts of the concerned domain to develop the analyst team’s market understanding and expertise. It improves and substantiates every single data presented in the market reports. Primary research mainly involves in telephonic interviews, E-mail interactions and face-to-face interviews with the raw material providers, manufacturers/producers, distributors, & independent consultants. The interviews that we conduct provides valuable data on market size and industry growth trends prevailing in the market. Our organization also conducts surveys with the various industry experts in order to gain overall insights of the industry/market. For instance, in healthcare industry we conduct surveys with the pharmacists, doctors, surgeons and nurses in order to gain insights and key information of a medical product/device/equipment which the customers are going to usage. Surveys are conducted in the form of questionnaire designed by our own analyst team. Surveys plays an important role in primary research because surveys helps us to identify the key target audiences of the market. Additionally, surveys helps to identify the key target audience engaged with the market. Our survey team conducts the survey by targeting the key audience, thus gaining insights from them. Based on the perspectives of the customers, this information is utilized to formulate market strategies. Moreover, market surveys helps us to understand the current competitive situation of the industry. To be precise, our survey process typically involve with the 360 analysis of the market. This analytical process begins by identifying the prospective customers for a product or service related to the market/industry to obtain data on how a product/service could fit into customers’ lives.

Secondary Research: The secondary data sources includes information published by the on-profit organizations such as World bank, WHO, company fillings, investor presentations, annual reports, national government documents, statistical databases, blogs, articles, white papers and others. From the annual report, we analyse a company’s revenue to understand the key segment and market share of that organization in a particular region. We analyse the company websites and adopt the product mapping technique which is important for deriving the segment revenue. In the product mapping method, we select and categorize the products offered by the companies catering to domain specific market, deduce the product revenue for each of the companies so as to get overall estimation of the market size. We also source data and analyses trends based on information received from supply side and demand side intermediaries in the value chain. The supply side denotes the data gathered from supplier, distributor, wholesaler and the demand side illustrates the data gathered from the end customers for respective market domain.

The supply side for a domain specific market is analysed by:
The demand side for the market is estimated through:
In-house Library: Apart from these third-party sources, we have our in-house library of qualitative and quantitative information. Our in-house database includes market data for various industry and domains. These data are updated on regular basis as per the changing market scenario. Our library includes, historic databases, internal audit reports and archives.
Sometimes there are instances where there is no metadata or raw data available for any domain specific market. For those cases, we use our expertise to forecast and estimate the market size in order to generate comprehensive data sets. Our analyst team adopt a robust research technique in order to produce the estimates:
Data Synthesis: This stage involves the analysis & mapping of all the information obtained from the previous step. It also involves in scrutinizing the data for any discrepancy observed while data gathering related to the market. The data is collected with consideration to the heterogeneity of sources. Robust scientific techniques are in place for synthesizing disparate data sets and provide the essential contextual information that can orient market strategies. The Brainy Insights has extensive experience in data synthesis where the data passes through various stages:


Market Deduction & Formulation: The final stage comprises of assigning data points at appropriate market spaces so as to deduce feasible conclusions. Analyst perspective & subject matter expert based holistic form of market sizing coupled with industry analysis also plays a crucial role in this stage.
This stage involves in finalization of the market size and numbers that we have collected from data integration step. With data interpolation, it is made sure that there is no gap in the market data. Successful trend analysis is done by our analysts using extrapolation techniques, which provide the best possible forecasts for the market.
Data Validation & Market Feedback: Validation is the most important step in the process. Validation & re-validation via an intricately designed process helps us finalize data-points to be used for final calculations.

The Brainy Insights interacts with leading companies and experts of the concerned domain to develop the analyst team’s market understanding and expertise. It improves and substantiates every single data presented in the market reports. The data validation interview and discussion panels are typically composed of the most experienced industry members. The participants include, however, are not limited to:
Moreover, we always validate our data and findings through primary respondents from all the major regions we are working on.


Free Customization
Fortune 500 Clients
Free Yearly Update On Purchase Of Multi/Corporate License
Companies Served Till Date