- +1-315-215-1633
- sales@thebrainyinsights.com

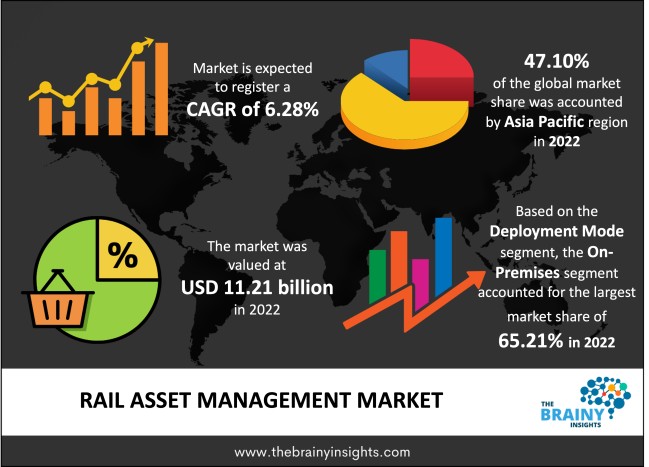
The global rail asset management market was valued at USD 11.21 Billion in 2022 and grew at a CAGR of 6.28% from 2023 to 2032. The market is expected to reach USD 20.61 Billion by 2032. The increasing demand for rail asset management can be attributed to the rising initiatives to maintain rolling stock. Further, the government authorities are increasing the investment in the railway industry, witnessing a growing population.
The choice of a rail asset management system is crucial, especially in the asset-intensive rail sector. The solution has grown more complex, and functionality now combines a wider range of skills with particular technological demands. Software, hardware, and consulting factors are all integrated into rail asset management. Rail asset management seeks to increase asset availability while reducing cost and risk throughout the asset's life. Instead of responding to maintenance issues, rail asset management assists in gathering and analyzing pertinent data for predictive and preventative maintenance. Achieving the best lifecycle value and guaranteeing passenger safety depends on such visibility. Traditional railway asset management systems are transformed by digitalization, enabling train companies to gather, store, and modify crucial asset data while generating substantial financial gains.
Get an overview of this study by requesting a free sample
The rise in railway infrastructure investment: For well-functioning economies and the growth of regions and cities, extensive and efficient transportation infrastructure is needed. When properly built, transportation networks can be a source of increased efficiency and a better quality of life for people. Effective modes of transportation, especially railroads, allow entrepreneurs to bring goods securely and promote worker movement to the most appropriate employment. Investing in transportation infrastructure has always been a key driver of economic growth. The importance of transportation infrastructure in promoting trade, for example, can be traced back through history. The most basic is that transportation infrastructure makes it easier to trade goods. Improved transportation system lowers the cost of doing business. Better domestic trade prospects enable regions to focus on the sectors where they are most competitive compared to others. Thus, to enhance the transportation experience, the infrastructure is developed to provide a smooth medium for the trains. This factor is the most promising driver for the railway asset management market.
High cost: The market for rail asset management is restrained by the high cost of maintenance equipment. These are erratic and expensive due to the equipment required to maintain rail assets. The high cost of such equipment may constrain the use of high-end machinery and software. Such substantial investments could put further financial strain on bankrupt states or local governments, jeopardizing upcoming general budgets.
Increase in adoption of IoT technology in the railway industry: Under the Internet of Things model, the railway industry can now take advantage of the opportunities provided by the IIoT and supporting communication technologies. Smart transportation networks that leverage technology over a vast rail network infrastructure to reduce lifecycle costs are expected to be the railway industry's future. New services like integrated security, asset management, and predictive maintenance are expected to help with protection, scheduling, and system performance issues. Smart railways comprise integrated technology solutions and parts and modern transportation infrastructures such as automated ticketing systems, digital signage, and smart meters. To meet the ever-growing demand for energy-efficient and safer services, these systems also need seamless high-data-rate wireless networking and integrated software solutions to maximize the use of properties, from tracks to trains. Thus, smart railway technology is expected to propel new opportunities for the rail asset management industry.
The regions analyzed for the market include North America, Europe, South America, Asia Pacific, the Middle East, and Africa. Asia-Pacific emerged as the most significant rail asset management market, with a 47.10% market revenue share in 2022.
Asia-Pacific region will account for the largest market share with revenue growth. Nations such as Japan, China, India and South Korea are investing in high-tech equipment and software that can be used for rail asset management. Due to the growth of the railway industry and rising investment in digital technology, innovative technologies are promoted for the maintenance of rolling stock and the existing railway infrastructure. The favourable government regulations and growing investment are promoting the use of rail asset management.
Asia Pacific region Rail Asset Management Market Share in 2022 - 47.10%
www.thebrainyinsights.com
Check the geographical analysis of this market by requesting a free sample
The deployment mode segment is divided into on-premises and cloud. The on-premises segment dominated the market, with a share of around 65.21% in 2022. Software installed and run on a customer's internal servers and computing infrastructure is known as on-premises software. The user needs a licenced or purchased copy of the software from an independent vendor and uses the organization's natural computer resources. On-premises software is one of the most popular and established ways in the railway business.
The offering segment is divided into services and solutions. The services segment further includes managed services and professional services. The solutions segment further includes asset planning and scheduling, asset performance management, workforce management, security, network management, etc. The solutions segment dominated the market, with a share of around 75.39% in 2022. The rail asset management solution covers all systems, practises, and tools to maximize asset availability. The foundation for most of the passenger service improvement is built on the data gathered by the intelligent asset management solution and the analytical tools.
The end-users segment is divided into railway infrastructure and rolling stock. The rolling stock segment dominated the market, with a share of around 62.17% in 2022. Management of the rolling stock during all stages of its life cycle is referred to as rolling stock asset management. This is done to meet the needs of rolling stock and reduce the overall management cost over an extended period.
| Attribute | Description |
|---|---|
| Market Size | Revenue (USD Billion) |
| Market size value in 2022 | USD 11.21 Billion |
| Market size value in 2032 | USD 20.61 Billion |
| CAGR (2023 to 2032) | 6.28% |
| Historical data | 2019-2021 |
| Base Year | 2022 |
| Forecast | 2023-2032 |
| Region | The regions analyzed for the market are Asia Pacific, Europe, South America, North America, and Middle East & Africa. Furthermore, the regions are further analyzed at the country level. |
| Segments | Deployment Mode, Offering and End-users |
As per The Brainy Insights, the size of the rail asset management market was valued USD 11.21 billion in 2022 to USD 20.61 billion by 2032.
Global rail asset management market is growing at a CAGR of 6.28% during the forecast period 2023-2032.
Asia-Pacific region emerged as the largest market for the rail asset management.
The market's growth will be influenced by the rising investment in railway assets.
The high cost of machinery and software used for asset management can hamper the market growth.
The rising investment in railway industry is providing huge opportunities to the market.
1. Introduction
1.1. Objectives of the Study
1.2. Market Definition
1.3. Research Scope
1.4. Currency
1.5. Key Target Audience
2. Research Methodology and Assumptions
3. Executive Summary
4. Premium Insights
4.1. Porter’s Five Forces Analysis
4.2. Value Chain Analysis
4.3. Top Investment Pockets
4.3.1. Market Attractiveness Analysis by Deployment Mode
4.3.2. Market Attractiveness Analysis by Offering
4.3.3. Market Attractiveness Analysis by End-users
4.3.4. Market Attractiveness Analysis by Region
4.4. Industry Trends
5. Market Dynamics
5.1. Market Evaluation
5.2. Drivers
5.2.1. Increasing use of rail asset management for rolling stock and infrastructure maintenance
5.3. Restraints
5.3.1. High cost of machinery
5.4. Opportunities
5.4.1. Increasing investment in railway industry
5.5. Challenges
5.5.1. Rising complexity
6. Global Rail Asset Management Market Analysis and Forecast, By Deployment Mode
6.1. Segment Overview
6.2. On-Premises
6.3. Cloud
7. Global Rail Asset Management Market Analysis and Forecast, By Offering
7.1. Segment Overview
7.2. Services
7.2.1. Managed Services
7.2.2. Professional Services
7.3. Solutions
7.3.1. Asset Planning and Scheduling
7.3.2. Asset Performance Management
7.3.3. Workforce Management
7.3.4. Security
7.3.5. Network Management
7.3.6. Others
8. Global Rail Asset Management Market Analysis and Forecast, By End-users
8.1. Segment Overview
8.2. Railway Infrastructure
8.3. Rolling Stocks
9. Global Rail Asset Management Market Analysis and Forecast, By Regional Analysis
9.1. Segment Overview
9.2. North America
9.2.1. U.S.
9.2.2. Canada
9.2.3. Mexico
9.3. Europe
9.3.1. Germany
9.3.2. France
9.3.3. U.K.
9.3.4. Italy
9.3.5. Spain
9.4. Asia-Pacific
9.4.1. Japan
9.4.2. China
9.4.3. India
9.5. South America
9.5.1. Brazil
9.6. Middle East and Africa
9.6.1. UAE
9.6.2. South Africa
10. Global Rail Asset Management Market-Competitive Landscape
10.1. Overview
10.2. Market Share of Key Players in the Rail Asset Management Market
10.2.1. Global Company Market Share
10.2.2. North America Company Market Share
10.2.3. Europe Company Market Share
10.2.4. APAC Company Market Share
10.3. Competitive Situations and Trends
10.3.1. Product Launches and Developments
10.3.2. Partnerships, Collaborations, and Agreements
10.3.3. Mergers & Acquisitions
10.3.4. Expansions
11. Company Profiles
11.1. Siemens
11.1.1. Business Overview
11.1.2. Company Snapshot
11.1.3. Company Market Share Analysis
11.1.4. Company Product Portfolio
11.1.5. Recent Developments
11.1.6. SWOT Analysis
11.2. Hitachi
11.2.1. Business Overview
11.2.2. Company Snapshot
11.2.3. Company Market Share Analysis
11.2.4. Company Product Portfolio
11.2.5. Recent Developments
11.2.6. SWOT Analysis
11.3. IBM
11.3.1. Business Overview
11.3.2. Company Snapshot
11.3.3. Company Market Share Analysis
11.3.4. Company Product Portfolio
11.3.5. Recent Developments
11.3.6. SWOT Analysis
11.4. Wabtec
11.4.1. Business Overview
11.4.2. Company Snapshot
11.4.3. Company Market Share Analysis
11.4.4. Company Product Portfolio
11.4.5. Recent Developments
11.4.6. SWOT Analysis
11.5. Trimble
11.5.1. Business Overview
11.5.2. Company Snapshot
11.5.3. Company Market Share Analysis
11.5.4. Company Product Portfolio
11.5.5. Recent Developments
11.5.6. SWOT Analysis
11.6. SAP
11.6.1. Business Overview
11.6.2. Company Snapshot
11.6.3. Company Market Share Analysis
11.6.4. Company Product Portfolio
11.6.5. Recent Developments
11.6.6. SWOT Analysis
11.7. Bentley Systems
11.7.1. Business Overview
11.7.2. Company Snapshot
11.7.3. Company Market Share Analysis
11.7.4. Company Product Portfolio
11.7.5. Recent Developments
11.7.6. SWOT Analysis
11.8. Atkins
11.8.1. Business Overview
11.8.2. Company Snapshot
11.8.3. Company Market Share Analysis
11.8.4. Company Product Portfolio
11.8.5. Recent Developments
11.8.6. SWOT Analysis
11.9. Bombardier
11.9.1. Business Overview
11.9.2. Company Snapshot
11.9.3. Company Market Share Analysis
11.9.4. Company Product Portfolio
11.9.5. Recent Developments
11.9.6. SWOT Analysis
11.10. DXC Technology
11.10.1. Business Overview
11.10.2. Company Snapshot
11.10.3. Company Market Share Analysis
11.10.4. Company Product Portfolio
11.10.5. Recent Developments
11.10.6. SWOT Analysis
11.11. Tego
11.11.1. Business Overview
11.11.2. Company Snapshot
11.11.3. Company Market Share Analysis
11.11.4. Company Product Portfolio
11.11.5. Recent Developments
11.11.6. SWOT Analysis
11.12. Trapeze
11.12.1. Business Overview
11.12.2. Company Snapshot
11.12.3. Company Market Share Analysis
11.12.4. Company Product Portfolio
11.12.5. Recent Developments
11.12.6. SWOT Analysis
11.13. Konux
11.13.1. Business Overview
11.13.2. Company Snapshot
11.13.3. Company Market Share Analysis
11.13.4. Company Product Portfolio
11.13.5. Recent Developments
11.13.6. SWOT Analysis
11.14. Trapeze
11.14.1. Business Overview
11.14.2. Company Snapshot
11.14.3. Company Market Share Analysis
11.14.4. Company Product Portfolio
11.14.5. Recent Developments
11.14.6. SWOT Analysis
11.15. L&T Technology Services Limited
11.15.1. Business Overview
11.15.2. Company Snapshot
11.15.3. Company Market Share Analysis
11.15.4. Company Product Portfolio
11.15.5. Recent Developments
11.15.6. SWOT Analysis
11.16. Capgemini
11.16.1. Business Overview
11.16.2. Company Snapshot
11.16.3. Company Market Share Analysis
11.16.4. Company Product Portfolio
11.16.5. Recent Developments
11.16.6. SWOT Analysis
11.17. Huawei Technologies
11.17.1. Business Overview
11.17.2. Company Snapshot
11.17.3. Company Market Share Analysis
11.17.4. Company Product Portfolio
11.17.5. Recent Developments
11.17.6. SWOT Analysis
11.18. Accenture
11.18.1. Business Overview
11.18.2. Company Snapshot
11.18.3. Company Market Share Analysis
11.18.4. Company Product Portfolio
11.18.5. Recent Developments
11.18.6. SWOT Analysis
11.19. Cyient
11.19.1. Business Overview
11.19.2. Company Snapshot
11.19.3. Company Market Share Analysis
11.19.4. Company Product Portfolio
11.19.5. Recent Developments
11.19.6. SWOT Analysis
List of Table
1. Global Rail Asset Management Market, By Deployment Mode, 2019-2032 (USD Billion)
2. Global On-Premises, Rail Asset Management Market, By Region, 2019-2032 (USD Billion)
3. Global Cloud, Rail Asset Management Market, By Region, 2019-2032 (USD Billion)
4. Global Rail Asset Management Market, By Offering , 2019-2032 (USD Billion)
5. Global Services, Rail Asset Management Market, By Region, 2019-2032 (USD Billion)
6. Global Solutions, Rail Asset Management Market, By Region, 2019-2032 (USD Billion)
7. Global Rail Asset Management Market, By End-users, 2019-2032 (USD Billion)
8. Global Railway Infrastructure, Rail Asset Management Market, By Region, 2019-2032 (USD Billion)
9. Global Rolling Stocks, Rail Asset Management Market, By Region, 2019-2032 (USD Billion)
10. Global Rail Asset Management Market, By Region, 2019-2032 (USD Billion)
11. North America Rail Asset Management Market, By Deployment Mode, 2019-2032 (USD Billion)
12. North America Rail Asset Management Market, By Offering , 2019-2032 (USD Billion)
13. North America Rail Asset Management Market, By End-users, 2019-2032 (USD Billion)
14. U.S. Rail Asset Management Market, By Deployment Mode, 2019-2032 (USD Billion)
15. U.S. Rail Asset Management Market, By Offering , 2019-2032 (USD Billion)
16. U.S. Rail Asset Management Market, By End-users, 2019-2032 (USD Billion)
17. Canada Rail Asset Management Market, By Deployment Mode, 2019-2032 (USD Billion)
18. Canada Rail Asset Management Market, By Offering , 2019-2032 (USD Billion)
19. Canada Rail Asset Management Market, By End-users, 2019-2032 (USD Billion)
20. Mexico Rail Asset Management Market, By Deployment Mode, 2019-2032 (USD Billion)
21. Mexico Rail Asset Management Market, By Offering , 2019-2032 (USD Billion)
22. Mexico Rail Asset Management Market, By End-users, 2019-2032 (USD Billion)
23. Europe Rail Asset Management Market, By Deployment Mode, 2019-2032 (USD Billion)
24. Europe Rail Asset Management Market, By Offering , 2019-2032 (USD Billion)
25. Europe Rail Asset Management Market, By End-users, 2019-2032 (USD Billion)
26. Germany Rail Asset Management Market, By Deployment Mode, 2019-2032 (USD Billion)
27. Germany Rail Asset Management Market, By Offering , 2019-2032 (USD Billion)
28. Germany Rail Asset Management Market, By End-users, 2019-2032 (USD Billion)
29. France Rail Asset Management Market, By Deployment Mode, 2019-2032 (USD Billion)
30. France Rail Asset Management Market, By Offering , 2019-2032 (USD Billion)
31. France Rail Asset Management Market, By End-users, 2019-2032 (USD Billion)
32. U.K. Rail Asset Management Market, By Deployment Mode, 2019-2032 (USD Billion)
33. U.K. Rail Asset Management Market, By Offering , 2019-2032 (USD Billion)
34. U.K. Rail Asset Management Market, By End-users, 2019-2032 (USD Billion)
35. Italy Rail Asset Management Market, By Deployment Mode, 2019-2032 (USD Billion)
36. Italy Rail Asset Management Market, By Offering , 2019-2032 (USD Billion)
37. Italy Rail Asset Management Market, By End-users, 2019-2032 (USD Billion)
38. Spain Rail Asset Management Market, By Deployment Mode, 2019-2032 (USD Billion)
39. Spain Rail Asset Management Market, By Offering , 2019-2032 (USD Billion)
40. Spain Rail Asset Management Market, By End-users, 2019-2032 (USD Billion)
41. Asia Pacific Rail Asset Management Market, By Deployment Mode, 2019-2032 (USD Billion)
42. Asia Pacific Rail Asset Management Market, By Offering , 2019-2032 (USD Billion)
43. Asia Pacific Rail Asset Management Market, By End-users, 2019-2032 (USD Billion)
44. Japan Rail Asset Management Market, By Deployment Mode, 2019-2032 (USD Billion)
45. Japan Rail Asset Management Market, By Offering , 2019-2032 (USD Billion)
46. Japan Rail Asset Management Market, By End-users, 2019-2032 (USD Billion)
47. China Rail Asset Management Market, By Deployment Mode, 2019-2032 (USD Billion)
48. China Rail Asset Management Market, By Offering , 2019-2032 (USD Billion)
49. China Rail Asset Management Market, By End-users, 2019-2032 (USD Billion)
50. India Rail Asset Management Market, By Deployment Mode, 2019-2032 (USD Billion)
51. India Rail Asset Management Market, By Offering , 2019-2032 (USD Billion)
52. India Rail Asset Management Market, By End-users, 2019-2032 (USD Billion)
53. South America Rail Asset Management Market, By Deployment Mode, 2019-2032 (USD Billion)
54. South America Rail Asset Management Market, By Offering , 2019-2032 (USD Billion)
55. South America Rail Asset Management Market, By End-users, 2019-2032 (USD Billion)
56. Brazil Rail Asset Management Market, By Deployment Mode, 2019-2032 (USD Billion)
57. Brazil Rail Asset Management Market, By Offering , 2019-2032 (USD Billion)
58. Brazil Rail Asset Management Market, By End-users, 2019-2032 (USD Billion)
59. Middle East and Africa Rail Asset Management Market, By Deployment Mode, 2019-2032 (USD Billion)
60. Middle East and Africa Rail Asset Management Market, By Offering , 2019-2032 (USD Billion)
61. Middle East and Africa Rail Asset Management Market, By End-users, 2019-2032 (USD Billion)
62. UAE Rail Asset Management Market, By Deployment Mode, 2019-2032 (USD Billion)
63. UAE Rail Asset Management Market, By Offering , 2019-2032 (USD Billion)
64. UAE Rail Asset Management Market, By End-users, 2019-2032 (USD Billion)
65. South Africa Rail Asset Management Market, By Deployment Mode, 2019-2032 (USD Billion)
66. South Africa Rail Asset Management Market, By Offering , 2019-2032 (USD Billion)
67. South Africa Rail Asset Management Market, By End-users, 2019-2032 (USD Billion)
List of Figures
1. Global Rail Asset Management Market Segmentation
2. Rail Asset Management Market: Research Methodology
3. Market Size Estimation Methodology: Bottom-Up Approach
4. Market Size Estimation Methodology: Top-Down Approach
5. Data Triangulation
6. Porter’s Five Forces Analysis
7. Value Chain Analysis
8. Global Rail Asset Management Market Attractiveness Analysis by Deployment Mode
9. Global Rail Asset Management Market Attractiveness Analysis by Offering
10. Global Rail Asset Management Market Attractiveness Analysis by End-users
11. Global Rail Asset Management Market Attractiveness Analysis by Region
12. Global Rail Asset Management Market: Dynamics
13. Global Rail Asset Management Market Share by Deployment Mode (2022 & 2032)
14. Global Rail Asset Management Market Share by Offering (2022 & 2032)
15. Global Rail Asset Management Market Share by End-users (2022 & 2032)
16. Global Rail Asset Management Market Share by Regions (2022 & 2032)
17. Global Rail Asset Management Market Share by Company (2022)
This study forecasts revenue at global, regional, and country levels from 2019 to 2032. The Brainy Insights has segmented the global rail asset management market based on below mentioned segments:
Global Rail Asset Management Market by Deployment Mode:
Global Rail Asset Management Market by Offering:
Global Rail Asset Management Market by End-users:
Global Rail Asset Management Market by Region:
Research has its special purpose to undertake marketing efficiently. In this competitive scenario, businesses need information across all industry verticals; the information about customer wants, market demand, competition, industry trends, distribution channels etc. This information needs to be updated regularly because businesses operate in a dynamic environment. Our organization, The Brainy Insights incorporates scientific and systematic research procedures in order to get proper market insights and industry analysis for overall business success. The analysis consists of studying the market from a miniscule level wherein we implement statistical tools which helps us in examining the data with accuracy and precision.
Our research reports feature both; quantitative and qualitative aspects for any market. Qualitative information for any market research process are fundamental because they reveal the customer needs and wants, usage and consumption for any product/service related to a specific industry. This in turn aids the marketers/investors in knowing certain perceptions of the customers. Qualitative research can enlighten about the different product concepts and designs along with unique service offering that in turn, helps define marketing problems and generate opportunities. On the other hand, quantitative research engages with the data collection process through interviews, e-mail interactions, surveys and pilot studies. Quantitative aspects for the market research are useful to validate the hypotheses generated during qualitative research method, explore empirical patterns in the data with the help of statistical tools, and finally make the market estimations.
The Brainy Insights offers comprehensive research and analysis, based on a wide assortment of factual insights gained through interviews with CXOs and global experts and secondary data from reliable sources. Our analysts and industry specialist assume vital roles in building up statistical tools and analysis models, which are used to analyse the data and arrive at accurate insights with exceedingly informative research discoveries. The data provided by our organization have proven precious to a diverse range of companies, facilitating them to address issues such as determining which products/services are the most appealing, whether or not customers use the product in the manner anticipated, the purchasing intentions of the market and many others.
Our research methodology encompasses an idyllic combination of primary and secondary initiatives. Key phases involved in this process are listed below:

The phase involves the gathering and collecting of market data and its related information with the help of different sources & research procedures.

The data procurement stage involves in data gathering and collecting through various data sources.
This stage involves in extensive research. These data sources includes:
Purchased Database: Purchased databases play a crucial role in estimating the market sizes irrespective of the domain. Our purchased database includes:
Primary Research: The Brainy Insights interacts with leading companies and experts of the concerned domain to develop the analyst team’s market understanding and expertise. It improves and substantiates every single data presented in the market reports. Primary research mainly involves in telephonic interviews, E-mail interactions and face-to-face interviews with the raw material providers, manufacturers/producers, distributors, & independent consultants. The interviews that we conduct provides valuable data on market size and industry growth trends prevailing in the market. Our organization also conducts surveys with the various industry experts in order to gain overall insights of the industry/market. For instance, in healthcare industry we conduct surveys with the pharmacists, doctors, surgeons and nurses in order to gain insights and key information of a medical product/device/equipment which the customers are going to usage. Surveys are conducted in the form of questionnaire designed by our own analyst team. Surveys plays an important role in primary research because surveys helps us to identify the key target audiences of the market. Additionally, surveys helps to identify the key target audience engaged with the market. Our survey team conducts the survey by targeting the key audience, thus gaining insights from them. Based on the perspectives of the customers, this information is utilized to formulate market strategies. Moreover, market surveys helps us to understand the current competitive situation of the industry. To be precise, our survey process typically involve with the 360 analysis of the market. This analytical process begins by identifying the prospective customers for a product or service related to the market/industry to obtain data on how a product/service could fit into customers’ lives.

Secondary Research: The secondary data sources includes information published by the on-profit organizations such as World bank, WHO, company fillings, investor presentations, annual reports, national government documents, statistical databases, blogs, articles, white papers and others. From the annual report, we analyse a company’s revenue to understand the key segment and market share of that organization in a particular region. We analyse the company websites and adopt the product mapping technique which is important for deriving the segment revenue. In the product mapping method, we select and categorize the products offered by the companies catering to domain specific market, deduce the product revenue for each of the companies so as to get overall estimation of the market size. We also source data and analyses trends based on information received from supply side and demand side intermediaries in the value chain. The supply side denotes the data gathered from supplier, distributor, wholesaler and the demand side illustrates the data gathered from the end customers for respective market domain.

The supply side for a domain specific market is analysed by:
The demand side for the market is estimated through:
In-house Library: Apart from these third-party sources, we have our in-house library of qualitative and quantitative information. Our in-house database includes market data for various industry and domains. These data are updated on regular basis as per the changing market scenario. Our library includes, historic databases, internal audit reports and archives.
Sometimes there are instances where there is no metadata or raw data available for any domain specific market. For those cases, we use our expertise to forecast and estimate the market size in order to generate comprehensive data sets. Our analyst team adopt a robust research technique in order to produce the estimates:
Data Synthesis: This stage involves the analysis & mapping of all the information obtained from the previous step. It also involves in scrutinizing the data for any discrepancy observed while data gathering related to the market. The data is collected with consideration to the heterogeneity of sources. Robust scientific techniques are in place for synthesizing disparate data sets and provide the essential contextual information that can orient market strategies. The Brainy Insights has extensive experience in data synthesis where the data passes through various stages:


Market Deduction & Formulation: The final stage comprises of assigning data points at appropriate market spaces so as to deduce feasible conclusions. Analyst perspective & subject matter expert based holistic form of market sizing coupled with industry analysis also plays a crucial role in this stage.
This stage involves in finalization of the market size and numbers that we have collected from data integration step. With data interpolation, it is made sure that there is no gap in the market data. Successful trend analysis is done by our analysts using extrapolation techniques, which provide the best possible forecasts for the market.
Data Validation & Market Feedback: Validation is the most important step in the process. Validation & re-validation via an intricately designed process helps us finalize data-points to be used for final calculations.

The Brainy Insights interacts with leading companies and experts of the concerned domain to develop the analyst team’s market understanding and expertise. It improves and substantiates every single data presented in the market reports. The data validation interview and discussion panels are typically composed of the most experienced industry members. The participants include, however, are not limited to:
Moreover, we always validate our data and findings through primary respondents from all the major regions we are working on.


Free Customization
Fortune 500 Clients
Free Yearly Update On Purchase Of Multi/Corporate License
Companies Served Till Date