- +1-315-215-1633
- sales@thebrainyinsights.com

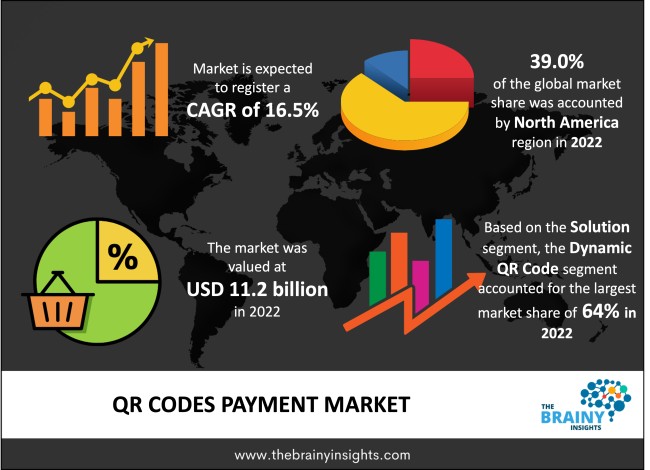
The global QR codes payment market was valued at USD 11.2 billion in 2022 and is anticipated to grow at a CAGR of 16.5% from 2023 to 2032. With the development of QR code payment systems in recent years, financial transactions have undergone a drastic change over the years. QR code payments have increased in many aspects of daily life, including bill payments, retail shopping and other areas. This technology has become popular due to its widespread acceptance across industries. The features of QR codes include scalability, improved security, ease of use, and seamless user experience. QR code payments have become a disruptive force in the banking industry owing to their ability to simplify transactions, provide еnhancеd security measures, and offer a seamless user еxpеriеncе. The applications of QR codes can be found in various industries, and their utilization is growing exponentially. The future of financial transactions is assumable to witness huge growth owing to the increasing acceptance of QR code payments.
The digital revolution has created an innovation, connectivity, and connectivity era. Quick Response codes, or QR codes, were first created in Japan by Denso Wavе, a Toyota Group company, in the mid-1990s. These two-dimensional barcodes were developed to make tracking car parts during production more efficient. Their productive applications, however, go far beyond this original purpose. QR codes have become widely used for storing and retrieving information because they incorporate various data, including alphanumeric labels, binary data, and URLs. With the advent of mobile banking and digital wallets, the functionality of QR codes in financial transactions started to take shape. The simplicity of using smartphones to read QR codes has created new opportunities for streamlining payments. The birth and the widespread acceptance of QR codes have marked a new era of technological revolution.
The functionality of the QR codes works on a completely different level. A QR code with the necessary transaction details is created to initiate the payment process. A QR code is created using various methods, for instance, a payment solution app, a web-based platform or a mobile banking app. The payer gives the QR code, which the payee scans using a device. Typically, scanning happens with the aid of a smartphone. The payment information and subsequent details generally get encrypted within the QR code. Depending on the security requirements and payment system, the payee might be asked to authenticate themselves before consenting to the transaction. PIN verification, biometric authentication, and device-based confirmation are just a few of the different authentication methods implemented.
The payee examines the transaction specifics on their device after a successful QR code scan and any required authentication. This confirmation phase frequently includes checking the recipient's information and the transaction amount. The payer confirms the transaction and indicates their approval by authorizing it. Afterwards, the appropriate financial institution or payment service provider authorizes and processes the payment. Real-time alerts confirming the transaction's successful execution are sent to the payer and the payee. These actors act as electronic receptors, enhancing the payment process's security and transparency.
Get an overview of this study by requesting a free sample
Increasing Adoption of QR Code Payment - The increasing adoption of QR code payment across various industry verticals is a key driving force in the global QR codes payment market. Payment processing using a QR code is a practical business payment option in the present situation. Traditional point-of-sale (POS) systems are frequently used to set up, maintain, and process transactions. Using QR code payment options could be more effective. Without needing expensive gear or software installs, businesses can easily create QR codes and display them at checkout counters or on their invoices. Because they are so affordable, QR code payments have become popular for small and large enterprises, allowing them to save costs and boost profits. This primary factor is boosting the market growth and development.
Low Literacy and Technological Proficiency - Low literacy and technological competence levels among particular demographic segments can be a substantial barrier in some regions. Users are frequently required to read and complete instructions, access mobile apps, and carry out tasks like scanning QR codes to use QR code payments. The successful use of QR code payment systems may be difficult for people with low reading or digital literacy levels, resulting in a digital gap that prevents them from taking advantage of this technology. Adopting new technology, including QR code payments, is influenced by human behavior and the desire to change. Due to familiarity, perceived complexity, or security concerns, many customers may be reluctant to switch from traditional payment methods like cash and credit cards to QR-coded payments. These factors are limiting the market growth and development.
Surge in Adoption of Contactless Payments - The rise of contactless payments is one of the most obvious trends in the global QR code payment industry. Consumers and businesses began to place a higher priority on safety and cleanliness as a result of the COVID-19 epidemic, which quickened the shift away from cash and physical cards. Due to their inherent contactless nature, QR code payments have become the preferred method for in-person transactions in restaurants, retail establishments, and transportation hubs. Beyond the pandemic, this trend is anticipated to continue, with many people adopting contactless payments as the norm. Applications for digital wallets are predominantly integrating QR code payments. Several well-known digital companies, including Apple Pay, Google Pay, and Samsung Pay, have included QR code payment support for their wall apps. This connection allows users to easily make QR code payments and save on payment cards, loyalty cards, and other crucial information in one location. This factor is expected to provide lucrative growth opportunities in the upcoming years.
The regions analyzed for the market include North America, Europe, South America, Asia Pacific, the Middle East, and Africa. North America region emerged as the most prominent global QR codes payment market, with a 39.0% market revenue share in 2022. The region is considered the early adopter of QR codes payment due to the presence of the key players. Early QR code payment acceptance was seen in North America, where technologically advanced customers and companies embraced the innovation. The widespread utilization of digital wallets and the popularity of smartphones with high-resolution cameras have boosted the growth and acceptance of QR code payments.
Additionally, North America's thriving financial environment has significantly accelerated the adoption of QR code payments. Users may now easily make payments using QR codes owing to the integration of QR code payment functions into digital wallet programs by major companies like Apple, Google, and PayPal. The regional market players also use various market strategies such as product innovation, product differentiation, mergers, acquisitions, partnerships, and strategic alliances to maintain their competitive edge.
North America Region QR Codes Payment Market Share in 2022- 39.0%
www.thebrainyinsights.com
Check the geographical analysis of this market by requesting a free sample
The solution segment includes static QR code and dynamic QR code. The dynamic QR code segment accounted for the largest market share of around 64% in 2022. Dynamic QR codes can be generated in real-time and contain various information depending on the transaction. Due to the flexibility, business enterprises can design personalized customer payment experiences, such as discounts or special offers based on past purchases or customer information. In addition, dynamic QR codes can be encrypted with specific transaction information, making them more secure than static QR codes and reducing the risk of fraudulent purchases. Consequently, security has made dynamic QR codes a preferred option for companies, especially in sectors like e-commerce and banking.
The payment type segment is bifurcated into push payment and pull payment. The push payment segment dominated, with a market share of around 59% in 2022. Customers can use push payments to start a transaction by scanning a QR code and giving permission; the money is transferred from the customer's account to the merchant's account. As a result, the threat of fraudulent or unauthorized transactions rises daily; introducing push payment systems can significantly lower the risk, improving the transaction process seamlessly. Additionally, push payments are frequently used for on-time purchases like online shopping or in-person retail transactions, which can help improve security and fuel market growth and development.
The transaction type segment is divided into remote and face-to-face. The face-to-face segment dominated the market, with a market share of around 60% in 2022. The face-to-face transaction channel's familiarity with clients is one of its key benefits. Scanning a QR code during a transaction is simple and natural because many customers are already used to utilizing it for various purposes, like accessing materials or promotions. Due to the customer's and the merchant's physical presence, face-to-face transactions are also quite secure. As a result, it reduces the possibility of fraudulent transactions and unauthorized charges, giving customers and retailers more peace of mind. This is the primary factor for the segment growth.
The end-user segment is classified into restaurant, retail & E-commerce, E-ticket booking and others. The restaurant segment dominated the market, with a share of around 43% in 2022. Restaurants that execute many small-level transactions, such as those using QR Code payment methods, can cut their transaction expenses to avoid lengthy credit card processing fees. It makes it possible for businesses to become more profitable and competitive. Additionally, QR Code payments give restaurants extra advantages during the COVID-19 outbreak because they can lower the danger of infection by minimizing direct contact between patrons and staff. Additionally, by providing tailored promotions and loyalty rewards to consumers who use QR code payments, restaurants may increase customer engagement and loyalty.
| Attribute | Description |
|---|---|
| Market Size | Revenue (USD Billion) |
| Market size value in 2022 | USD 11.2 Billion |
| Market size value in 2032 | USD 51.58 Billion |
| CAGR (2023 to 2032) | 16.5% |
| Historical data | 2019-2021 |
| Base Year | 2022 |
| Forecast | 2023-2032 |
| Region | The regions analyzed for the market are Asia Pacific, Europe, South America, North America, and Middle East & Africa. Furthermore, the regions are further analyzed at the country level. |
| Segments | Payment Type, Transaction Type, End-user and Solution |
As per The Brainy Insights, the size of the QR codes payment market was valued at USD 11.2 billion in 2022 to USD 51.58 billion by 2032.
The global QR codes payment market is growing at a CAGR of 16.5% during the forecast period 2023-2032.
North America region became the largest market for QR codes payment.
The growing adoption of contactless payment is influencing the market's growth.
1. Introduction
1.1. Objectives of the Study
1.2. Market Definition
1.3. Research Scope
1.4. Currency
1.5. Key Target Audience
2. Research Methodology and Assumptions
3. Executive Summary
4. Premium Insights
4.1. Porter’s Five Forces Analysis
4.2. Value Chain Analysis
4.3. Top Investment Pockets
4.3.1. Market Attractiveness Analysis by Solution
4.3.2. Market Attractiveness Analysis by Industry
4.3.3. Market Attractiveness Analysis by Payment Type
4.3.4. Market Attractiveness Analysis by Transaction Type
4.3.5. Market Attractiveness Analysis by Region
4.4. Industry Trends
5. Market Dynamics
5.1. Market Evaluation
5.2. Drivers
5.2.1. Increasing Adoption of QR Code Payment
5.3. Restraints
5.3.1. Low Literacy and Technological Proficiency
5.4. Opportunities
5.4.1. Surge in Adoption of Contactless Payments
6. Global QR Codes Payment Market Analysis and Forecast, By Solution
6.1. Segment Overview
6.2. Static QR code
6.3. Dynamic QR Code
7. Global QR Codes Payment Market Analysis and Forecast, By Industry
7.1. Segment Overview
7.2. Restaurant
7.3. E-ticket Booking
7.4. Retail & E-commerce
7.5. Transportation
7.6. Others
8. Global QR Codes Payment Market Analysis and Forecast, By Payment Type
8.1. Segment Overview
8.2. Push Payment
8.3. Pull Payment
9. Global QR Codes Payment Market Analysis and Forecast, By Transaction Type
9.1. Segment Overview
9.2. Remote
9.3. Face-to-face
10. Global QR Codes Payment Market Analysis and Forecast, By Regional Analysis
10.1. Segment Overview
10.2. North America
10.2.1. U.S.
10.2.2. Canada
10.2.3. Mexico
10.3. Europe
10.3.1. Germany
10.3.2. France
10.3.3. U.K.
10.3.4. Italy
10.3.5. Spain
10.4. Asia-Pacific
10.4.1. Japan
10.4.2. China
10.4.3. India
10.5. South America
10.5.1. Brazil
10.6. Middle East and Africa
10.6.1. UAE
10.6.2. South Africa
11. Global QR Codes Payment Market-Competitive Landscape
11.1. Overview
11.2. Market Share of Key Players in the QR Codes Payment Market
11.2.1. Global Company Market Share
11.2.2. North America Company Market Share
11.2.3. Europe Company Market Share
11.2.4. APAC Company Market Share
11.3. Competitive Situations and Trends
11.3.1. Product Launches and Developments
11.3.2. Partnerships, Collaborations, and Agreements
11.3.3. Mergers & Acquisitions
11.3.4. Expansions
12. Company Profiles
12.1. NEarex
12.1.1. Business Overview
12.1.2. Company Snapshot
12.1.3. Company Market Share Analysis
12.1.4. Company Product Portfolio
12.1.5. Recent Developments
12.1.6. SWOT Analysis
12.2. PaymentCloud
12.2.1. Business Overview
12.2.2. Company Snapshot
12.2.3. Company Market Share Analysis
12.2.4. Company Product Portfolio
12.2.5. Recent Developments
12.2.6. SWOT Analysis
12.3. Clover Network, LLC
12.3.1. Business Overview
12.3.2. Company Snapshot
12.3.3. Company Market Share Analysis
12.3.4. Company Product Portfolio
12.3.5. Recent Developments
12.3.6. SWOT Analysis
12.4. PayPal, Inc.
12.4.1. Business Overview
12.4.2. Company Snapshot
12.4.3. Company Market Share Analysis
12.4.4. Company Product Portfolio
12.4.5. Recent Developments
12.4.6. SWOT Analysis
12.5. UnionPay International
12.5.1. Business Overview
12.5.2. Company Snapshot
12.5.3. Company Market Share Analysis
12.5.4. Company Product Portfolio
12.5.5. Recent Developments
12.5.6. SWOT Analysis
12.6. LINE Pay Corporation
12.6.1. Business Overview
12.6.2. Company Snapshot
12.6.3. Company Market Share Analysis
12.6.4. Company Product Portfolio
12.6.5. Recent Developments
12.6.6. SWOT Analysis
12.7. Ecentric Payment Systems
12.7.1. Business Overview
12.7.2. Company Snapshot
12.7.3. Company Market Share Analysis
12.7.4. Company Product Portfolio
12.7.5. Recent Developments
12.7.6. SWOT Analysis
12.8. ACI Worldwide
12.8.1. Business Overview
12.8.2. Company Snapshot
12.8.3. Company Market Share Analysis
12.8.4. Company Product Portfolio
12.8.5. Recent Developments
12.8.6. SWOT Analysis
12.9. Revolut Technologies Inc.
12.9.1. Business Overview
12.9.2. Company Snapshot
12.9.3. Company Market Share Analysis
12.9.4. Company Product Portfolio
12.9.5. Recent Developments
12.9.6. SWOT Analysis
12.10. Block, Inc. (Square)
12.10.1. Business Overview
12.10.2. Company Snapshot
12.10.3. Company Market Share Analysis
12.10.4. Company Product Portfolio
12.10.5. Recent Developments
12.10.6. SWOT Analysis
List of Table
1. Global QR Codes Payment Market, By Solution, 2019-2032 (USD Billion)
2. Global Static QR Code, QR Codes Payment Market, By Region, 2019-2032 (USD Billion)
3. Global Dynamic QR Code, QR Codes Payment Market, By Region, 2019-2032 (USD Billion)
4. Global QR Codes Payment Market, By Industry, 2019-2032 (USD Billion)
5. Global Restaurant QR Codes Payment Market, By Region, 2019-2032 (USD Billion)
6. Global E-ticket Booking QR Codes Payment Market, By Region, 2019-2032 (USD Billion)
7. Global Retail & E-commerce, QR Codes Payment Market, By Region, 2019-2032 (USD Billion)
8. Global Others QR Codes Payment Market, By Region, 2019-2032 (USD Billion)
9. Global QR Codes Payment Market, By Payment Type, 2019-2032 (USD Billion)
10. Global Push Payment QR Codes Payment Market, By Region, 2019-2032 (USD Billion)
11. Global Pull Payment QR Codes Payment Market, By Region, 2019-2032 (USD Billion)
12. Global QR Codes Payment Market, By Transaction Type, 2019-2032 (USD Billion)
13. Global Remote QR Codes Payment Market, By Region, 2019-2032 (USD Billion)
14. Global Face-to-face QR Codes Payment Market, By Region, 2019-2032 (USD Billion)
15. Global QR Codes Payment Market, By Region, 2019-2032 (USD Billion)
16. North America QR Codes Payment Market, By Solution, 2019-2032 (USD Billion)
17. North America QR Codes Payment Market, By Industry, 2019-2032 (USD Billion)
18. North America QR Codes Payment Market, By Payment Type, 2019-2032 (USD Billion)
19. North America QR Codes Payment Market, By Transaction Type, 2019-2032 (USD Billion)
20. U.S. QR Codes Payment Market, By Solution, 2019-2032 (USD Billion)
21. U.S. QR Codes Payment Market, By Industry, 2019-2032 (USD Billion)
22. U.S. QR Codes Payment Market, By Payment Type, 2019-2032 (USD Billion)
23. U.S. QR Codes Payment Market, By Transaction Type, 2019-2032 (USD Billion)
24. Canada QR Codes Payment Market, By Solution, 2019-2032 (USD Billion)
25. Canada QR Codes Payment Market, By Industry, 2019-2032 (USD Billion)
26. Canada QR Codes Payment Market, By Payment Type, 2019-2032 (USD Billion)
27. Canada QR Codes Payment Market, By Transaction Type, 2019-2032 (USD Billion)
28. Mexico QR Codes Payment Market, By Solution, 2019-2032 (USD Billion)
29. Mexico QR Codes Payment Market, By Industry, 2019-2032 (USD Billion)
30. Mexico QR Codes Payment Market, By Payment Type, 2019-2032 (USD Billion)
31. Mexico QR Codes Payment Market, By Transaction Type, 2019-2032 (USD Billion)
32. Europe QR Codes Payment Market, By Solution, 2019-2032 (USD Billion)
33. Europe QR Codes Payment Market, By Industry, 2019-2032 (USD Billion)
34. Europe QR Codes Payment Market, By Payment Type, 2019-2032 (USD Billion)
35. Europe QR Codes Payment Market, By Transaction Type, 2019-2032 (USD Billion)
36. Germany QR Codes Payment Market, By Solution, 2019-2032 (USD Billion)
37. Germany QR Codes Payment Market, By Industry, 2019-2032 (USD Billion)
38. Germany QR Codes Payment Market, By Payment Type, 2019-2032 (USD Billion)
39. Germany QR Codes Payment Market, By Transaction Type, 2019-2032 (USD Billion)
40. France QR Codes Payment Market, By Solution, 2019-2032 (USD Billion)
41. France QR Codes Payment Market, By Industry, 2019-2032 (USD Billion)
42. France QR Codes Payment Market, By Payment Type, 2019-2032 (USD Billion)
43. France QR Codes Payment Market, By Transaction Type, 2019-2032 (USD Billion)
44. U.K. QR Codes Payment Market, By Solution, 2019-2032 (USD Billion)
45. U.K. QR Codes Payment Market, By Industry, 2019-2032 (USD Billion)
46. U.K. QR Codes Payment Market, By Payment Type, 2019-2032 (USD Billion)
47. U.K. QR Codes Payment Market, By Transaction Type, 2019-2032 (USD Billion)
48. Italy QR Codes Payment Market, By Solution, 2019-2032 (USD Billion)
49. Italy QR Codes Payment Market, By Industry, 2019-2032 (USD Billion)
50. Italy QR Codes Payment Market, By Payment Type, 2019-2032 (USD Billion)
51. Italy QR Codes Payment Market, By Transaction Type, 2019-2032 (USD Billion)
52. Spain QR Codes Payment Market, By Solution, 2019-2032 (USD Billion)
53. Spain QR Codes Payment Market, By Industry, 2019-2032 (USD Billion)
54. Spain QR Codes Payment Market, By Payment Type, 2019-2032 (USD Billion)
55. Spain QR Codes Payment Market, By Transaction Type, 2019-2032 (USD Billion)
56. Asia Pacific QR Codes Payment Market, By Solution, 2019-2032 (USD Billion)
57. Asia Pacific QR Codes Payment Market, By Industry, 2019-2032 (USD Billion)
58. Asia Pacific QR Codes Payment Market, By Payment Type, 2019-2032 (USD Billion)
59. Asia Pacific QR Codes Payment Market, By Transaction Type, 2019-2032 (USD Billion)
60. Japan QR Codes Payment Market, By Solution, 2019-2032 (USD Billion)
61. Japan QR Codes Payment Market, By Industry, 2019-2032 (USD Billion)
62. Japan QR Codes Payment Market, By Payment Type, 2019-2032 (USD Billion)
63. Japan QR Codes Payment Market, By Transaction Type, 2019-2032 (USD Billion)
64. China QR Codes Payment Market, By Solution, 2019-2032 (USD Billion)
65. China QR Codes Payment Market, By Industry, 2019-2032 (USD Billion)
66. China QR Codes Payment Market, By Payment Type, 2019-2032 (USD Billion)
67. China QR Codes Payment Market, By Transaction Type, 2019-2032 (USD Billion)
68. India QR Codes Payment Market, By Solution, 2019-2032 (USD Billion)
69. India QR Codes Payment Market, By Industry, 2019-2032 (USD Billion)
70. India QR Codes Payment Market, By Payment Type, 2019-2032 (USD Billion)
71. India QR Codes Payment Market, By Transaction Type, 2019-2032 (USD Billion)
72. South America QR Codes Payment Market, By Solution, 2019-2032 (USD Billion)
73. South America QR Codes Payment Market, By Industry, 2019-2032 (USD Billion)
74. South America QR Codes Payment Market, By Payment Type, 2019-2032 (USD Billion)
75. South America QR Codes Payment Market, By Transaction Type, 2019-2032 (USD Billion)
76. Brazil QR Codes Payment Market, By Solution, 2019-2032 (USD Billion)
77. Brazil QR Codes Payment Market, By Industry, 2019-2032 (USD Billion)
78. Brazil QR Codes Payment Market, By Payment Type, 2019-2032 (USD Billion)
79. Brazil QR Codes Payment Market, By Transaction Type, 2019-2032 (USD Billion)
80. Middle East and Africa QR Codes Payment Market, By Solution, 2019-2032 (USD Billion)
81. Middle East and Africa QR Codes Payment Market, By Industry, 2019-2032 (USD Billion)
82. Middle East and Africa QR Codes Payment Market, By Payment Type, 2019-2032 (USD Billion)
83. Middle East and Africa QR Codes Payment Market, By Transaction Type, 2019-2032 (USD Billion)
84. UAE QR Codes Payment Market, By Solution, 2019-2032 (USD Billion)
85. UAE QR Codes Payment Market, By Industry, 2019-2032 (USD Billion)
86. UAE QR Codes Payment Market, By Payment Type, 2019-2032 (USD Billion)
87. UAE QR Codes Payment Market, By Transaction Type, 2019-2032 (USD Billion)
88. South Africa QR Codes Payment Market, By Solution, 2019-2032 (USD Billion)
89. South Africa QR Codes Payment Market, By Industry, 2019-2032 (USD Billion)
90. South Africa QR Codes Payment Market, By Payment Type, 2019-2032 (USD Billion)
91. South Africa QR Codes Payment Market, By Transaction Type, 2019-2032 (USD Billion)
List of Figures
1. Global QR Codes Payment Market Segmentation
2. QR Codes Payment Market: Research Methodology
3. Market Size Estimation Methodology: Bottom-Up Approach
4. Market Size Estimation Methodology: Top-Down Approach
5. Data Triangulation
6. Porter’s Five Forces Analysis
7. Value Chain Analysis
8. Global QR Codes Payment Market Attractiveness Analysis by Solution
9. Global QR Codes Payment Market Attractiveness Analysis by Industry
10. Global QR Codes Payment Market Attractiveness Analysis by Payment Type
11. Global QR Codes Payment Market Attractiveness Analysis by Transaction Type
12. Global QR Codes Payment Market Attractiveness Analysis by Region
13. Global QR Codes Payment Market: Dynamics
14. Global QR Codes Payment Market Share by Solution (2023 & 2032)
15. Global QR Codes Payment Market Share by Industry (2023 & 2032)
16. Global QR Codes Payment Market Share by Payment Type (2023 & 2032)
17. Global QR Codes Payment Market Share by Transaction Type (2023 & 2032)
18. Global QR Codes Payment Market Share by Regions (2023 & 2032)
19. Global QR Codes Payment Market Share by Company (2022)
This study forecasts revenue at global, regional, and country levels from 2019 to 2032. The Brainy Insights has segmented the global QR codes payment market based on below-mentioned segments:
Global QR Codes Payment Market by Solution:
Global QR Codes Payment Market by Payment Type:
Global QR Codes Payment Market by Industry:
Global QR Codes Payment Market by Transaction Type:
Global QR Codes Payment Market by Region:
Research has its special purpose to undertake marketing efficiently. In this competitive scenario, businesses need information across all industry verticals; the information about customer wants, market demand, competition, industry trends, distribution channels etc. This information needs to be updated regularly because businesses operate in a dynamic environment. Our organization, The Brainy Insights incorporates scientific and systematic research procedures in order to get proper market insights and industry analysis for overall business success. The analysis consists of studying the market from a miniscule level wherein we implement statistical tools which helps us in examining the data with accuracy and precision.
Our research reports feature both; quantitative and qualitative aspects for any market. Qualitative information for any market research process are fundamental because they reveal the customer needs and wants, usage and consumption for any product/service related to a specific industry. This in turn aids the marketers/investors in knowing certain perceptions of the customers. Qualitative research can enlighten about the different product concepts and designs along with unique service offering that in turn, helps define marketing problems and generate opportunities. On the other hand, quantitative research engages with the data collection process through interviews, e-mail interactions, surveys and pilot studies. Quantitative aspects for the market research are useful to validate the hypotheses generated during qualitative research method, explore empirical patterns in the data with the help of statistical tools, and finally make the market estimations.
The Brainy Insights offers comprehensive research and analysis, based on a wide assortment of factual insights gained through interviews with CXOs and global experts and secondary data from reliable sources. Our analysts and industry specialist assume vital roles in building up statistical tools and analysis models, which are used to analyse the data and arrive at accurate insights with exceedingly informative research discoveries. The data provided by our organization have proven precious to a diverse range of companies, facilitating them to address issues such as determining which products/services are the most appealing, whether or not customers use the product in the manner anticipated, the purchasing intentions of the market and many others.
Our research methodology encompasses an idyllic combination of primary and secondary initiatives. Key phases involved in this process are listed below:

The phase involves the gathering and collecting of market data and its related information with the help of different sources & research procedures.

The data procurement stage involves in data gathering and collecting through various data sources.
This stage involves in extensive research. These data sources includes:
Purchased Database: Purchased databases play a crucial role in estimating the market sizes irrespective of the domain. Our purchased database includes:
Primary Research: The Brainy Insights interacts with leading companies and experts of the concerned domain to develop the analyst team’s market understanding and expertise. It improves and substantiates every single data presented in the market reports. Primary research mainly involves in telephonic interviews, E-mail interactions and face-to-face interviews with the raw material providers, manufacturers/producers, distributors, & independent consultants. The interviews that we conduct provides valuable data on market size and industry growth trends prevailing in the market. Our organization also conducts surveys with the various industry experts in order to gain overall insights of the industry/market. For instance, in healthcare industry we conduct surveys with the pharmacists, doctors, surgeons and nurses in order to gain insights and key information of a medical product/device/equipment which the customers are going to usage. Surveys are conducted in the form of questionnaire designed by our own analyst team. Surveys plays an important role in primary research because surveys helps us to identify the key target audiences of the market. Additionally, surveys helps to identify the key target audience engaged with the market. Our survey team conducts the survey by targeting the key audience, thus gaining insights from them. Based on the perspectives of the customers, this information is utilized to formulate market strategies. Moreover, market surveys helps us to understand the current competitive situation of the industry. To be precise, our survey process typically involve with the 360 analysis of the market. This analytical process begins by identifying the prospective customers for a product or service related to the market/industry to obtain data on how a product/service could fit into customers’ lives.

Secondary Research: The secondary data sources includes information published by the on-profit organizations such as World bank, WHO, company fillings, investor presentations, annual reports, national government documents, statistical databases, blogs, articles, white papers and others. From the annual report, we analyse a company’s revenue to understand the key segment and market share of that organization in a particular region. We analyse the company websites and adopt the product mapping technique which is important for deriving the segment revenue. In the product mapping method, we select and categorize the products offered by the companies catering to domain specific market, deduce the product revenue for each of the companies so as to get overall estimation of the market size. We also source data and analyses trends based on information received from supply side and demand side intermediaries in the value chain. The supply side denotes the data gathered from supplier, distributor, wholesaler and the demand side illustrates the data gathered from the end customers for respective market domain.

The supply side for a domain specific market is analysed by:
The demand side for the market is estimated through:
In-house Library: Apart from these third-party sources, we have our in-house library of qualitative and quantitative information. Our in-house database includes market data for various industry and domains. These data are updated on regular basis as per the changing market scenario. Our library includes, historic databases, internal audit reports and archives.
Sometimes there are instances where there is no metadata or raw data available for any domain specific market. For those cases, we use our expertise to forecast and estimate the market size in order to generate comprehensive data sets. Our analyst team adopt a robust research technique in order to produce the estimates:
Data Synthesis: This stage involves the analysis & mapping of all the information obtained from the previous step. It also involves in scrutinizing the data for any discrepancy observed while data gathering related to the market. The data is collected with consideration to the heterogeneity of sources. Robust scientific techniques are in place for synthesizing disparate data sets and provide the essential contextual information that can orient market strategies. The Brainy Insights has extensive experience in data synthesis where the data passes through various stages:


Market Deduction & Formulation: The final stage comprises of assigning data points at appropriate market spaces so as to deduce feasible conclusions. Analyst perspective & subject matter expert based holistic form of market sizing coupled with industry analysis also plays a crucial role in this stage.
This stage involves in finalization of the market size and numbers that we have collected from data integration step. With data interpolation, it is made sure that there is no gap in the market data. Successful trend analysis is done by our analysts using extrapolation techniques, which provide the best possible forecasts for the market.
Data Validation & Market Feedback: Validation is the most important step in the process. Validation & re-validation via an intricately designed process helps us finalize data-points to be used for final calculations.

The Brainy Insights interacts with leading companies and experts of the concerned domain to develop the analyst team’s market understanding and expertise. It improves and substantiates every single data presented in the market reports. The data validation interview and discussion panels are typically composed of the most experienced industry members. The participants include, however, are not limited to:
Moreover, we always validate our data and findings through primary respondents from all the major regions we are working on.


Free Customization
Fortune 500 Clients
Free Yearly Update On Purchase Of Multi/Corporate License
Companies Served Till Date