- +1-315-215-1633
- sales@thebrainyinsights.com

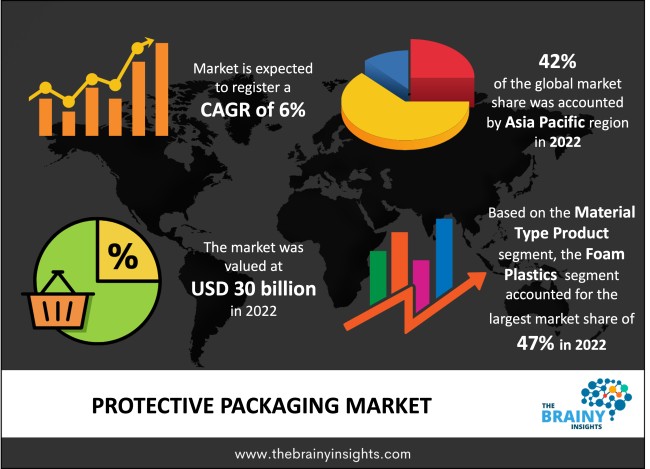
The global protective packaging market was valued at USD 30 billion in 2022 and grew at a CAGR of 6% from 2023 to 2032. The market is expected to reach USD 53.72 billion by 2032. The growing e-commerce industry will drive the growth of the global protective packaging market.
Protective packaging, as the term suggests, is the art and science of enclosing goods or commodities in sturdy, strong and flexible materials to preserve their quality and protect them from damage during transportation. The type of commodity, its nature, whether liquid, solid or semi-solid, its perishability, fluidity, compressibility, fragility etc., decides the kind of packaging they require to preserve its original contents, shape, size, design and quality. The materials used for packing the product differ from those used for storing and transporting it. The materials range from cardboard to plastics. Also, bubble wraps, foams and straws are used for extra cushioning. Protective packaging is designed keeping in mind the environmental and human elements that may cause damage to it. The materials used for protective packaging must withstand extreme temperatures, pressure, rough handling, and shocks. Furthermore, protective packaging must also be informative, convenient, and easy to handle for hassle-free storage and transport. It must also be environmentally friendly and sustainable in the modern climate-conscious world.
Get an overview of this study by requesting a free sample
The growing e-commerce industry – The covid-19 pandemic led to the closures of commercial centres. It also led to isolation and social distancing. The E-commerce industry and online home delivery rescued millions of customers and helped small businesses survive. The e-commerce industry thrived during the pandemic. The trend of online shopping for clothes, footwear, food, groceries, household appliances, personal care and beauty products, among many other things, has continued to grow even after the pandemic, given the convenience, wide variety of products from different brands, discounts, payment choices, home-delivery, offers and easy returns that e-commerce offers. The increasing internet penetration with the rising ownership of smart connected devices also contributed to the growth and development of the e-commerce industry. The shift of several businesses to online sales through their own websites or e-commerce partners also increased, augmenting the e-commerce market. The e-commerce industry focuses on delivering the exact products a customer orders in pristine condition, increasing the demand for high-quality protective packaging. Therefore, the expanding and growing e-commerce industry will drive the global protective packaging market's growth.
The stringent regulation restricting the use of plastic protective packaging – Plastic materials in the modern world meet most of the packaging needs. Plastic is a flexible, durable, strong, reliable and customizable material used for several years with effective results. However, the over-exploitation of plastic has led to several environmental problems. Therefore, government authorities have started addressing the growing menace of plastic by imposing restrictions on its use. Some countries have partial restrictions that define the plastic grade that can be used and one that will attract penalties. Such regulations will limit the market's growth as other eco-friendly materials are yet to be adopted on a large scale, given concerns over their affordability and functionality.
The introduction of eco-friendly and sustainable packaging materials – The growing concerns about plastic waste and its negative environmental impact have increased the demand for eco-friendly packaging materials. Plastics damage land, oceans, seas and marine and land animals. These materials eventually enter the food chain and reach humans causing several adverse health effects. Therefore, the government and other stakeholders are encouraging the development of eco-friendly, high-recyclable and sustainable packaging materials to reduce the use of plastics. Examples of such efforts include bioplastics, seaweed packaging, corrugated bubble wrap packaging, cornstarch, and mushroom packaging. Therefore, introducing eco-friendly and sustainable packaging materials will offer lucrative opportunities to the market players in the forecast period.
The regions analyzed for the market include North America, Europe, South America, Asia Pacific, the Middle East, and Africa. Asia Pacific emerged as the most significant global protective packaging market, with a 42% market revenue share in 2022.
The population of India and China alone offer a vast consumer market for food, beverages, household appliances, clothing and apparel, personal care products and other consumer goods. It is also a vast market for automotive, pharmaceuticals and healthcare, and industrial goods. Furthermore, the growing e-commerce market will also contribute to the regional market’s growth. Additionally, China is the manufacturing hub of the world and therefore dominates the consumer market for packaging products shipped worldwide. The growing trade in the Indo-Pacific region will also augment the market's growth.
Asia Pacific Region Protective Packaging Market Share in 2022 - 42%
www.thebrainyinsights.com
Check the geographical analysis of this market by requesting a free sample
The material type segment is divided into plastic, foam plastic, paper and paperboard, and others. The foam plastics segment dominated the market, with a share of around 47% in 2022. Foam plastics are synthetic materials that are flexible and can be hardened or softened according to the needs and requirements of the packaging. They offer a greater range of choices with their shape, size, design, rigidity, durability, flexibility and other properties compared to other material types. They are lightweight and highly desirable for storage, transportation and the environment. They offer excellent heat insulation, a high strength-to-weight ratio, and greater flexibility in moulding. The multiple advantages foam plastics offer make it ideal for various applications across various industries.
The product type segment is divided into rigid, flexible and foam. The flexible segment dominated the market, with a market share of around 48% in 2022. The fundamentally distinct feature of flexible packaging is that it can be modified to fit the needs of products of any kind. Flexible protective packaging can easily alter its shape and size to fit the product's needs. The packaging is manufactured from paper, foam, plastics, aluminium foil, or any combination. Flexible protective packaging offers excellent anti-scratch and tearing resistance. They protect the content quality and safeguard the products from light, heat, moisture and pressure. They are highly customizable, recyclable, easy to use and convenient. They can be designed to accommodate marketing needs. They are Lightweight and cost-effective, which makes them ideal for various applications.
The function segment is divided into cushioning, void fill, wrapping, blocking and bracing, insulation, and others. The cushioning segment dominated the market, with a market share of around 39% in 2022. Cushioning reduces the shock or other impact on the products or contents of goods during storage and shipment. It is the most effective way to ensure the original contents of the products arrive in the same state as they were stated during the purchase. Cushioning is used in all protective packaging. Foam fill, plastic-like PE, PU, PS, paper fill, straws, and bubble wraps are all used for cushioning.
The application segment is divided into food and beverages, healthcare, industrial goods, automotive, household appliances, and others. The food and beverages segment dominated the market, with a market share of around 33% in 2022. The food and beverages segment has perishable goods or goods with a short life cycle. They are also highly vulnerable to temperature, moisture and light. They can easily degrade in quality if not packed properly. Therefore, the food and beverages segment makes the most use of protective packaging, given the nature of the goods. Additionally, these goods are purchased frequently, increasing the demand for protective packaging. The industry's increasing demand for food and beverages or packaged goods will propel the segment's growth.
| Attribute | Description |
|---|---|
| Market Size | Revenue (USD Billion) |
| Market size value in 2022 | USD 30 Billion |
| Market size value in 2032 | USD 53.72 Billion |
| CAGR (2023 to 2032) | 6% |
| Historical data | 2019-2021 |
| Base Year | 2022 |
| Forecast | 2023-2032 |
| Region | The regions analyzed for the market are Asia Pacific, Europe, South America, North America, and Middle East & Africa. Furthermore, the regions are further analyzed at the country level. |
| Segments | Material Type, Product Type, Function and Application |
As per The Brainy Insights, the size of the global protective packaging market was valued at USD 30 billion in 2022 to USD 53.72 billion by 2032.
Global protective packaging market is growing at a CAGR of 6% during the forecast period 2023-2032.
The market's growth will be influenced by the growing e-commerce industry.
The stringent regulation restricting the use of plastic protective packaging could hamper the market growth.
1. Introduction
1.1. Objectives of the Study
1.2. Market Definition
1.3. Research Scope
1.4. Currency
1.5. Key Target Audience
2. Research Methodology and Assumptions
3. Executive Summary
4. Premium Insights
4.1. Porter’s Five Forces Analysis
4.2. Value Chain Analysis
4.3. Top Investment Pockets
4.3.1. Market Attractiveness Analysis by Material Type
4.3.2. Market Attractiveness Analysis by Product Type
4.3.3. Market Attractiveness Analysis by Function
4.3.4. Market Attractiveness Analysis by Application
4.3.5. Market Attractiveness Analysis by Region
4.4. Industry Trends
5. Market Dynamics
5.1. Market Evaluation
5.2. Drivers
5.2.1. The growing e-commerce industry
5.3. Restraints
5.3.1. The stringent regulation restricting the use of plastic protective packaging
5.4. Opportunities
5.4.1. The introduction of eco-friendly and sustainable packaging materials
5.5. Challenges
5.5.1. Inefficient packaging practices
6. Global Protective Packaging Market Analysis and Forecast, By Material Type
6.1. Segment Overview
6.2. Plastic
6.3. Foam Plastic
6.4. Paper and Paperboard
6.5. Others
7. Global Protective Packaging Market Analysis and Forecast, By Product Type
7.1. Segment Overview
7.2. Rigid
7.3. Flexible
7.4. Foam
8. Global Protective Packaging Market Analysis and Forecast, By Function
8.1. Segment Overview
8.2. Cushioning
8.3. Void Fill
8.4. Wrapping
8.5. Blocking and Bracing
8.6. Insulation
8.7. Others
9. Global Protective Packaging Market Analysis and Forecast, By Application
9.1. Segment Overview
9.2. Food and Beverages
9.3. Healthcare
9.4. Industrial Goods
9.5. Automotive
9.6. Household Appliances
9.7. Others
10. Global Protective Packaging Market Analysis and Forecast, By Regional Analysis
10.1. Segment Overview
10.2. North America
10.2.1. U.S.
10.2.2. Canada
10.2.3. Mexico
10.3. Europe
10.3.1. Germany
10.3.2. France
10.3.3. U.K.
10.3.4. Italy
10.3.5. Spain
10.4. Asia-Pacific
10.4.1. Japan
10.4.2. China
10.4.3. India
10.5. South America
10.5.1. Brazil
10.6. Middle East and Africa
10.6.1. UAE
10.6.2. South Africa
11. Global Protective Packaging Market-Competitive Landscape
11.1. Overview
11.2. Market Share of Key Players in the Protective Packaging Market
11.2.1. Global Company Market Share
11.2.2. North America Company Market Share
11.2.3. Europe Company Market Share
11.2.4. APAC Company Market Share
11.3. Competitive Situations and Trends
11.3.1. Product Launches and Developments
11.3.2. Partnerships, Collaborations, and Agreements
11.3.3. Mergers & Acquisitions
11.3.4. Expansions
12. Company Profiles
12.1. Dow Chemical Company
12.1.1. Business Overview
12.1.2. Company Snapshot
12.1.3. Company Market Share Analysis
12.1.4. Company Product Portfolio
12.1.5. Recent Developments
12.1.6. SWOT Analysis
12.2. DS Smith Plc
12.2.1. Business Overview
12.2.2. Company Snapshot
12.2.3. Company Market Share Analysis
12.2.4. Company Product Portfolio
12.2.5. Recent Developments
12.2.6. SWOT Analysis
12.3. Huhtamaki OYJ
12.3.1. Business Overview
12.3.2. Company Snapshot
12.3.3. Company Market Share Analysis
12.3.4. Company Product Portfolio
12.3.5. Recent Developments
12.3.6. SWOT Analysis
12.4. Point Five Packaging
12.4.1. Business Overview
12.4.2. Company Snapshot
12.4.3. Company Market Share Analysis
12.4.4. Company Product Portfolio
12.4.5. Recent Developments
12.4.6. SWOT Analysis
12.5. Pro-Pac Packaging Limited
12.5.1. Business Overview
12.5.2. Company Snapshot
12.5.3. Company Market Share Analysis
12.5.4. Company Product Portfolio
12.5.5. Recent Developments
12.5.6. SWOT Analysis
12.6. Sealed Air Corporation
12.6.1. Business Overview
12.6.2. Company Snapshot
12.6.3. Company Market Share Analysis
12.6.4. Company Product Portfolio
12.6.5. Recent Developments
12.6.6. SWOT Analysis
12.7. Smurfit Kappa Group Plc.
12.7.1. Business Overview
12.7.2. Company Snapshot
12.7.3. Company Market Share Analysis
12.7.4. Company Product Portfolio
12.7.5. Recent Developments
12.7.6. SWOT Analysis
12.8. Sonoco Products Company
12.8.1. Business Overview
12.8.2. Company Snapshot
12.8.3. Company Market Share Analysis
12.8.4. Company Product Portfolio
12.8.5. Recent Developments
12.8.6. SWOT Analysis
12.9. Storopack Hans Reichenecker Gmbh
12.9.1. Business Overview
12.9.2. Company Snapshot
12.9.3. Company Market Share Analysis
12.9.4. Company Product Portfolio
12.9.5. Recent Developments
12.9.6. SWOT Analysis
12.10. Universal Protective Packaging Inc.
12.10.1. Business Overview
12.10.2. Company Snapshot
12.10.3. Company Market Share Analysis
12.10.4. Company Product Portfolio
12.10.5. Recent Developments
12.10.6. SWOT Analysis
List of Table
1. Global Protective Packaging Market, By Material Type, 2019-2032 (USD Billion)
2. Global Plastic Protective Packaging Market, By Region, 2019-2032 (USD Billion)
3. Global Foam Plastic Protective Packaging Market, By Region, 2019-2032 (USD Billion)
4. Global Paper and Paperboard Protective Packaging Market, By Region, 2019-2032 (USD Billion)
5. Global Others Protective Packaging Market, By Region, 2019-2032 (USD Billion)
6. Global Protective Packaging Market, By Product Type, 2019-2032 (USD Billion)
7. Global Rigid Protective Packaging Market, By Region, 2019-2032 (USD Billion)
8. Global Flexible Protective Packaging Market, By Region, 2019-2032 (USD Billion)
9. Global Foam Protective Packaging Market, By Region, 2019-2032 (USD Billion)
10. Global Protective Packaging Market, By Function, 2019-2032 (USD Billion)
11. Global Cushioning Protective Packaging Market, By Region, 2019-2032 (USD Billion)
12. Global Void Fill Protective Packaging Market, By Region, 2019-2032 (USD Billion)
13. Global Wrapping Protective Packaging Market, By Region, 2019-2032 (USD Billion)
14. Global Blocking and Bracing Protective Packaging Market, By Region, 2019-2032 (USD Billion)
15. Global Insulation Protective Packaging Market, By Region, 2019-2032 (USD Billion)
16. Global Others Protective Packaging Market, By Region, 2019-2032 (USD Billion)
17. Global Protective Packaging Market, By Application, 2019-2032 (USD Billion)
18. Global Food and Beverages Protective Packaging Market, By Region, 2019-2032 (USD Billion)
19. Global Healthcare Protective Packaging Market, By Region, 2019-2032 (USD Billion)
20. Global Industrial Goods Protective Packaging Market, By Region, 2019-2032 (USD Billion)
21. Global Automotive Protective Packaging Market, By Region, 2019-2032 (USD Billion)
22. Global Household Appliances Protective Packaging Market, By Region, 2019-2032 (USD Billion)
23. Global Others Protective Packaging Market, By Region, 2019-2032 (USD Billion)
24. Global Protective Packaging Market, By Region, 2019-2032 (USD Billion)
25. North America Protective Packaging Market, By Material Type, 2019-2032 (USD Billion)
26. North America Protective Packaging Market, By Product Type, 2019-2032 (USD Billion)
27. North America Protective Packaging Market, By Function, 2019-2032 (USD Billion)
28. North America Protective Packaging Market, By Application, 2019-2032 (USD Billion)
29. U.S. Protective Packaging Market, By Material Type, 2019-2032 (USD Billion)
30. U.S. Protective Packaging Market, By Product Type, 2019-2032 (USD Billion)
31. U.S. Protective Packaging Market, By Function, 2019-2032 (USD Billion)
32. U.S. Protective Packaging Market, By Application, 2019-2032 (USD Billion)
33. Canada Protective Packaging Market, By Material Type, 2019-2032 (USD Billion)
34. Canada Protective Packaging Market, By Product Type, 2019-2032 (USD Billion)
35. Canada Protective Packaging Market, By Function, 2019-2032 (USD Billion)
36. Canada Protective Packaging Market, By Application, 2019-2032 (USD Billion)
37. Mexico Protective Packaging Market, By Material Type, 2019-2032 (USD Billion)
38. Mexico Protective Packaging Market, By Product Type, 2019-2032 (USD Billion)
39. Mexico Protective Packaging Market, By Function, 2019-2032 (USD Billion)
40. Mexico Protective Packaging Market, By Application, 2019-2032 (USD Billion)
41. Europe Protective Packaging Market, By Material Type, 2019-2032 (USD Billion)
42. Europe Protective Packaging Market, By Product Type, 2019-2032 (USD Billion)
43. Europe Protective Packaging Market, By Function, 2019-2032 (USD Billion)
44. Europe Protective Packaging Market, By Application, 2019-2032 (USD Billion)
45. Germany Protective Packaging Market, By Material Type, 2019-2032 (USD Billion)
46. Germany Protective Packaging Market, By Product Type, 2019-2032 (USD Billion)
47. Germany Protective Packaging Market, By Function, 2019-2032 (USD Billion)
48. Germany Protective Packaging Market, By Application, 2019-2032 (USD Billion)
49. France Protective Packaging Market, By Material Type, 2019-2032 (USD Billion)
50. France Protective Packaging Market, By Product Type, 2019-2032 (USD Billion)
51. France Protective Packaging Market, By Function, 2019-2032 (USD Billion)
52. France Protective Packaging Market, By Application, 2019-2032 (USD Billion)
53. U.K. Protective Packaging Market, By Material Type, 2019-2032 (USD Billion)
54. U.K. Protective Packaging Market, By Product Type, 2019-2032 (USD Billion)
55. U.K. Protective Packaging Market, By Function, 2019-2032 (USD Billion)
56. U.K. Protective Packaging Market, By Application, 2019-2032 (USD Billion)
57. Italy Protective Packaging Market, By Material Type, 2019-2032 (USD Billion)
58. Italy Protective Packaging Market, By Product Type, 2019-2032 (USD Billion)
59. Italy Protective Packaging Market, By Function, 2019-2032 (USD Billion)
60. Italy Protective Packaging Market, By Application, 2019-2032 (USD Billion)
61. Spain Protective Packaging Market, By Material Type, 2019-2032 (USD Billion)
62. Spain Protective Packaging Market, By Product Type, 2019-2032 (USD Billion)
63. Spain Protective Packaging Market, By Function, 2019-2032 (USD Billion)
64. Spain Protective Packaging Market, By Application, 2019-2032 (USD Billion)
65. Asia Pacific Protective Packaging Market, By Material Type, 2019-2032 (USD Billion)
66. Asia Pacific Protective Packaging Market, By Product Type, 2019-2032 (USD Billion)
67. Asia Pacific Protective Packaging Market, By Function, 2019-2032 (USD Billion)
68. Asia Pacific Protective Packaging Market, By Application, 2019-2032 (USD Billion)
69. Japan Protective Packaging Market, By Material Type, 2019-2032 (USD Billion)
70. Japan Protective Packaging Market, By Product Type, 2019-2032 (USD Billion)
71. Japan Protective Packaging Market, By Function, 2019-2032 (USD Billion)
72. Japan Protective Packaging Market, By Application, 2019-2032 (USD Billion)
73. China Protective Packaging Market, By Material Type, 2019-2032 (USD Billion)
74. China Protective Packaging Market, By Product Type, 2019-2032 (USD Billion)
75. China Protective Packaging Market, By Function, 2019-2032 (USD Billion)
76. China Protective Packaging Market, By Application, 2019-2032 (USD Billion)
77. India Protective Packaging Market, By Material Type, 2019-2032 (USD Billion)
78. India Protective Packaging Market, By Product Type, 2019-2032 (USD Billion)
79. India Protective Packaging Market, By Function, 2019-2032 (USD Billion)
80. India Protective Packaging Market, By Application, 2019-2032 (USD Billion)
81. South America Protective Packaging Market, By Material Type, 2019-2032 (USD Billion)
82. South America Protective Packaging Market, By Product Type, 2019-2032 (USD Billion)
83. South America Protective Packaging Market, By Function, 2019-2032 (USD Billion)
84. South America Protective Packaging Market, By Application, 2019-2032 (USD Billion)
85. Brazil Protective Packaging Market, By Material Type, 2019-2032 (USD Billion)
86. Brazil Protective Packaging Market, By Product Type, 2019-2032 (USD Billion)
87. Brazil Protective Packaging Market, By Function, 2019-2032 (USD Billion)
88. Brazil Protective Packaging Market, By Application, 2019-2032 (USD Billion)
89. Middle East and Africa Protective Packaging Market, By Material Type, 2019-2032 (USD Billion)
90. Middle East and Africa Protective Packaging Market, By Product Type, 2019-2032 (USD Billion)
91. Middle East and Africa Protective Packaging Market, By Function, 2019-2032 (USD Billion)
92. Middle East and Africa Protective Packaging Market, By Application, 2019-2032 (USD Billion)
93. UAE Protective Packaging Market, By Material Type, 2019-2032 (USD Billion)
94. UAE Protective Packaging Market, By Product Type, 2019-2032 (USD Billion)
95. UAE Protective Packaging Market, By Function, 2019-2032 (USD Billion)
96. UAE Protective Packaging Market, By Application, 2019-2032 (USD Billion)
97. South Africa Protective Packaging Market, By Material Type, 2019-2032 (USD Billion)
98. South Africa Protective Packaging Market, By Product Type, 2019-2032 (USD Billion)
99. South Africa Protective Packaging Market, By Function, 2019-2032 (USD Billion)
100. South Africa Protective Packaging Market, By Application, 2019-2032 (USD Billion)
List of Figures
1. Global Protective Packaging Market Segmentation
2. Protective Packaging Market: Research Methodology
3. Market Size Estimation Methodology: Bottom-Up Approach
4. Market Size Estimation Methodology: Top-Down Approach
5. Data Triangulation
6. Porter’s Five Forces Analysis
7. Value Chain Analysis
8. Global Protective Packaging Market Attractiveness Analysis by Material Type
9. Global Protective Packaging Market Attractiveness Analysis by Product Type
10. Global Protective Packaging Market Attractiveness Analysis by Function
11. Global Protective Packaging Market Attractiveness Analysis by Application
12. Global Protective Packaging Market Attractiveness Analysis by Region
13. Global Protective Packaging Market: Dynamics
14. Global Protective Packaging Market Share by Material Type (2022 & 2032)
15. Global Protective Packaging Market Share by Product Type (2022 & 2032)
16. Global Protective Packaging Market Share by Function (2022 & 2032)
17. Global Protective Packaging Market Share by Application (2022 & 2032)
18. Global Protective Packaging Market Share by Regions (2022 & 2032)
19. Global Protective Packaging Market Share by Company (2022)
This study forecasts revenue at global, regional, and country levels from 2019 to 2032. The Brainy Insights has segmented the global protective packaging market based on below mentioned segments:
Global Protective Packaging Market by Material Type:
Global Protective Packaging Market by Product Type:
Global Protective Packaging Market by Function:
Global Protective Packaging Market by Application:
Global Protective Packaging Market by Region:
Research has its special purpose to undertake marketing efficiently. In this competitive scenario, businesses need information across all industry verticals; the information about customer wants, market demand, competition, industry trends, distribution channels etc. This information needs to be updated regularly because businesses operate in a dynamic environment. Our organization, The Brainy Insights incorporates scientific and systematic research procedures in order to get proper market insights and industry analysis for overall business success. The analysis consists of studying the market from a miniscule level wherein we implement statistical tools which helps us in examining the data with accuracy and precision.
Our research reports feature both; quantitative and qualitative aspects for any market. Qualitative information for any market research process are fundamental because they reveal the customer needs and wants, usage and consumption for any product/service related to a specific industry. This in turn aids the marketers/investors in knowing certain perceptions of the customers. Qualitative research can enlighten about the different product concepts and designs along with unique service offering that in turn, helps define marketing problems and generate opportunities. On the other hand, quantitative research engages with the data collection process through interviews, e-mail interactions, surveys and pilot studies. Quantitative aspects for the market research are useful to validate the hypotheses generated during qualitative research method, explore empirical patterns in the data with the help of statistical tools, and finally make the market estimations.
The Brainy Insights offers comprehensive research and analysis, based on a wide assortment of factual insights gained through interviews with CXOs and global experts and secondary data from reliable sources. Our analysts and industry specialist assume vital roles in building up statistical tools and analysis models, which are used to analyse the data and arrive at accurate insights with exceedingly informative research discoveries. The data provided by our organization have proven precious to a diverse range of companies, facilitating them to address issues such as determining which products/services are the most appealing, whether or not customers use the product in the manner anticipated, the purchasing intentions of the market and many others.
Our research methodology encompasses an idyllic combination of primary and secondary initiatives. Key phases involved in this process are listed below:

The phase involves the gathering and collecting of market data and its related information with the help of different sources & research procedures.

The data procurement stage involves in data gathering and collecting through various data sources.
This stage involves in extensive research. These data sources includes:
Purchased Database: Purchased databases play a crucial role in estimating the market sizes irrespective of the domain. Our purchased database includes:
Primary Research: The Brainy Insights interacts with leading companies and experts of the concerned domain to develop the analyst team’s market understanding and expertise. It improves and substantiates every single data presented in the market reports. Primary research mainly involves in telephonic interviews, E-mail interactions and face-to-face interviews with the raw material providers, manufacturers/producers, distributors, & independent consultants. The interviews that we conduct provides valuable data on market size and industry growth trends prevailing in the market. Our organization also conducts surveys with the various industry experts in order to gain overall insights of the industry/market. For instance, in healthcare industry we conduct surveys with the pharmacists, doctors, surgeons and nurses in order to gain insights and key information of a medical product/device/equipment which the customers are going to usage. Surveys are conducted in the form of questionnaire designed by our own analyst team. Surveys plays an important role in primary research because surveys helps us to identify the key target audiences of the market. Additionally, surveys helps to identify the key target audience engaged with the market. Our survey team conducts the survey by targeting the key audience, thus gaining insights from them. Based on the perspectives of the customers, this information is utilized to formulate market strategies. Moreover, market surveys helps us to understand the current competitive situation of the industry. To be precise, our survey process typically involve with the 360 analysis of the market. This analytical process begins by identifying the prospective customers for a product or service related to the market/industry to obtain data on how a product/service could fit into customers’ lives.

Secondary Research: The secondary data sources includes information published by the on-profit organizations such as World bank, WHO, company fillings, investor presentations, annual reports, national government documents, statistical databases, blogs, articles, white papers and others. From the annual report, we analyse a company’s revenue to understand the key segment and market share of that organization in a particular region. We analyse the company websites and adopt the product mapping technique which is important for deriving the segment revenue. In the product mapping method, we select and categorize the products offered by the companies catering to domain specific market, deduce the product revenue for each of the companies so as to get overall estimation of the market size. We also source data and analyses trends based on information received from supply side and demand side intermediaries in the value chain. The supply side denotes the data gathered from supplier, distributor, wholesaler and the demand side illustrates the data gathered from the end customers for respective market domain.

The supply side for a domain specific market is analysed by:
The demand side for the market is estimated through:
In-house Library: Apart from these third-party sources, we have our in-house library of qualitative and quantitative information. Our in-house database includes market data for various industry and domains. These data are updated on regular basis as per the changing market scenario. Our library includes, historic databases, internal audit reports and archives.
Sometimes there are instances where there is no metadata or raw data available for any domain specific market. For those cases, we use our expertise to forecast and estimate the market size in order to generate comprehensive data sets. Our analyst team adopt a robust research technique in order to produce the estimates:
Data Synthesis: This stage involves the analysis & mapping of all the information obtained from the previous step. It also involves in scrutinizing the data for any discrepancy observed while data gathering related to the market. The data is collected with consideration to the heterogeneity of sources. Robust scientific techniques are in place for synthesizing disparate data sets and provide the essential contextual information that can orient market strategies. The Brainy Insights has extensive experience in data synthesis where the data passes through various stages:


Market Deduction & Formulation: The final stage comprises of assigning data points at appropriate market spaces so as to deduce feasible conclusions. Analyst perspective & subject matter expert based holistic form of market sizing coupled with industry analysis also plays a crucial role in this stage.
This stage involves in finalization of the market size and numbers that we have collected from data integration step. With data interpolation, it is made sure that there is no gap in the market data. Successful trend analysis is done by our analysts using extrapolation techniques, which provide the best possible forecasts for the market.
Data Validation & Market Feedback: Validation is the most important step in the process. Validation & re-validation via an intricately designed process helps us finalize data-points to be used for final calculations.

The Brainy Insights interacts with leading companies and experts of the concerned domain to develop the analyst team’s market understanding and expertise. It improves and substantiates every single data presented in the market reports. The data validation interview and discussion panels are typically composed of the most experienced industry members. The participants include, however, are not limited to:
Moreover, we always validate our data and findings through primary respondents from all the major regions we are working on.


Free Customization
Fortune 500 Clients
Free Yearly Update On Purchase Of Multi/Corporate License
Companies Served Till Date