- +1-315-215-1633
- sales@thebrainyinsights.com

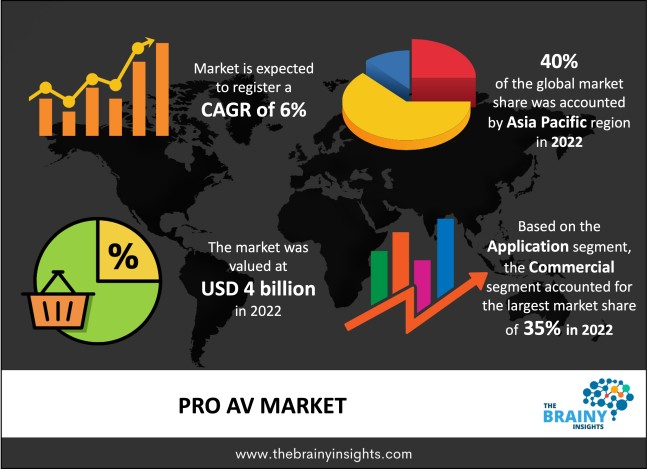
The global pro AV market was valued at USD 4 billion in 2022 and it is anticipated to grow at a CAGR of 6% from 2023 to 2032. The market is expected to reach USD 7.16 billion by 2032. The increasing emphasis on advancing the education sector by integrating e-learning solutions will drive the global pro AV market's growth.
The television sets or the LED/LCD in homes combined with a stereo system can be considered the most common example of an AV or audio-visual system. As the name suggests, the AV system offers both auditory and visual outputs. A pro AV system is a professional audio-visual, meaning it is the commercial hand of audio-visual systems. The most common example of pro AV would be its use in conference rooms or movie theatres, where there is a visual screen with a complimentary sound running to explain the visual contents. Digital food display menus for self-ordering at Mcdonald's are also a pro AV example. Concerts which display visual references on a big screen combined with an integrated sound system are also a pro AV example. They are used in various industries, including corporate, education, hospitality, government and communications. A wide variety of hardware, software and other components are used to broadcast and advertise products or services in commercial settings. Technological advancements, increasing automation and digitization have resulted in high-definition display technologies and the integration of AI and IoT, which has enhanced the pro AV market. Pro AV systems provide businesses several benefits, including enhanced cooperation, increased productivity, and greater communication.
Get an overview of this study by requesting a free sample
The increasing fiscal expenditure on advancing the education sector – Education for all is one of the primary sustainable goals of all countries under the United Nations Charter. Most nations strive to develop advanced systems, processes, products, services and technologies to deliver quality education for all. The popularity of smart boards has increased exponentially over the years with technological advancements, product innovations, cost reductions and greater accessibility to products. Additionally, the covid-19 pandemic offered a fillip to the e-learning sector, whose growth skyrocketed in the two years of the pandemic, given the lockdowns and school closures. Adults from all walks of life are enrolling in several courses on the e-learning platforms on cooking, art, literature, technology, lifestyle, food and health in addition to the conventional audience of school-going children. The demand for online learning facilitated an increase in the number of market players offering e-learning solutions, giving the consumer a wide variety of choices, along with reducing the prices. Therefore, the growing fiscal expenditure on advancing the education sector is focused on integrating technology in the classrooms, which will drive the pro AV markets. Furthermore, the growing popularity of e-learning will augment the market's growth.
The high capital investments – the pro AV solutions are meant for commercial applications. Significant initial capital investment is involved, given the various components used for the set-up. A high recurring cost includes employing skilled operators, regular upgrades, energy usage, and other maintenance needs. Given the unaffordable nature of the commodity, small and medium businesses are left out of the consumer market. Therefore, the high capital investments will hamper the market's growth.
The technological advancements – Virtual technology developments like augmented reality, virtual reality, and artificial intelligence have opened up new market prospects for pro AV applications in the corporate, education, government and hospitality sectors. As the use of these novel technologies garners pace, it is becoming increasingly possible to enhance virtual collaboration, e-learning solutions, digital signage and corporate conference room tools. The entrance of new market players will facilitate competition which will bode well for the market as it would encourage increased research and development expenditure on creating better goods, technology, and gadgets. The increased competition will also aid in lowering total operating expenses for businesses and making these solutions more affordable in the market. Market players are investing significantly to create new touch screens or surface acoustic web technologies. These technological advancements and product innovations will offer lucrative opportunities for the growth and development of the global pro AV market.
The regions analyzed for the market include North America, Europe, South America, Asia Pacific, the Middle East, and Africa. Asia Pacific emerged as the largest global pro AV market, with a 40% market revenue share in 2022.
Asia Pacific region will account for the largest market share with revenue growth. The increasing adoption of smart technologies in the education sector and the growing popularity of e-learning platforms will contribute to the region's growth. The growing popularity of smart offices, homes, and other commercial spaces will also bode well for the market. The automation and digitization of the Indian economy will offer several growth opportunities to the market players in the Asia Pacific region. The increasing innovation will also augment the market's growth.
Asia Pacific Region Pro AV Market Share in 2022 - 40%
www.thebrainyinsights.com
Check the geographical analysis of this market by requesting a free sample
The type segment is divided into products and services. The products segment dominated the market, with a market share of around 54% in 2022. The wide variety of products offered in the market, giving consumers the flexibility to choose the best-suited products that cater to their needs and requirements, contributes to the segment's dominance. The increased research and development expenditure also augments the segment's growth. Integrating AI, AR, and IoT will also offer greater opportunities for the segment's growth and development in the global pro AV market.
The application segment is divided into commercial, government, retail, home use, education, hospitality, and others. The commercial segment dominated the market, with a market share of around 35% in 2022. A key factor in the industry's expanding dominance in the application segment is the use of conferencing, communication, and coordination to enhance collaboration in the corporate market. It is also being widely utilized in other commercial settings with improved technologies.
The distribution channel segment is divided into direct sales and distributors. The distributors' segment dominated the market, with a market share of around 55% in 2022. A distributor connects a manufacturer and a later entity in the supply chain, typically a consumer. Distributors provide manufacturers with a wide customer base while allowing consumers access to all products. The distributor handles the logistics and other issues, giving manufacturers more time to concentrate on their core competencies or companies. The distributor handles the shipment, packing, and other related issues. They provide access to nearby markets.
| Attribute | Description |
|---|---|
| Market Size | Revenue (USD Billion) |
| Market size value in 2022 | USD 4 Billion |
| Market size value in 2032 | USD 7.16 Billion |
| CAGR (2023 to 2032) | 6% |
| Historical data | 2019-2021 |
| Base Year | 2022 |
| Forecast | 2023-2032 |
| Regional Segments | The regions analyzed for the market are Asia Pacific, Europe, South America, North America, and Middle East & Africa. Furthermore, the regions are further analyzed at the country level. |
| Segments | Type, Application, Distribution Channel |
As per The Brainy Insights, the size of the global pro AV market was valued at USD 4 billion in 2022 to USD 7.16 billion by 2032.
Global pro AV market is growing at a CAGR of 6% during the forecast period 2023-2032.
The market's growth will be influenced by the increasing fiscal expenditure on advancing the education sector.
The high capital investments could hamper the market growth.
1. Introduction
1.1. Objectives of the Study
1.2. Market Definition
1.3. Research Scope
1.4. Currency
1.5. Key Target Audience
2. Research Methodology and Assumptions
3. Executive Summary
4. Premium Insights
4.1. Porter’s Five Forces Analysis
4.2. Value Chain Analysis
4.3. Top Investment Pockets
4.3.1. Market Attractiveness Analysis by Type
4.3.2. Market Attractiveness Analysis by Application
4.3.3. Market Attractiveness Analysis by Distribution Channel
4.3.4. Market Attractiveness Analysis by Region
4.4. Industry Trends
5. Market Dynamics
5.1. Market Evaluation
5.2. Drivers
5.2.1. The increasing fiscal expenditure on advancing the education sector
5.3. Restraints
5.3.1. The high capital investments
5.4. Opportunities
5.4.1. The technological advancements
5.5. Challenges
5.5.1. The lack of skilled professionals
6. Global Pro AV Market Analysis and Forecast, By Type
6.1. Segment Overview
6.2. Products
6.3. Services
7. Global Pro AV Market Analysis and Forecast, By Application
7.1. Segment Overview
7.2. Commercial
7.3. Government
7.4. Retail
7.5. Home Use
7.6. Education
7.7. Hospitality
7.8. Others
8. Global Pro AV Market Analysis and Forecast, By Distribution Channel
8.1. Segment Overview
8.2. Direct Sales
8.3. Distributors
9. Global Pro AV Market Analysis and Forecast, By Regional Analysis
9.1. Segment Overview
9.2. North America
9.2.1. U.S.
9.2.2. Canada
9.2.3. Mexico
9.3. Europe
9.3.1. Germany
9.3.2. France
9.3.3. U.K.
9.3.4. Italy
9.3.5. Spain
9.4. Asia-Pacific
9.4.1. Japan
9.4.2. China
9.4.3. India
9.5. South America
9.5.1. Brazil
9.6. Middle East and Africa
9.6.1. UAE
9.6.2. South Africa
10. Global Pro AV Market-Competitive Landscape
10.1. Overview
10.2. Market Share of Key Players in the Pro AV Market
10.2.1. Global Company Market Share
10.2.2. North America Company Market Share
10.2.3. Europe Company Market Share
10.2.4. APAC Company Market Share
10.3. Competitive Situations and Trends
10.3.1. Product Launches and Developments
10.3.2. Partnerships, Collaborations, and Agreements
10.3.3. Mergers & Acquisitions
10.3.4. Expansions
11. Company Profiles
11.1. Vistacom Inc.
11.1.1. Business Overview
11.1.2. Company Snapshot
11.1.3. Company Market Share Analysis
11.1.4. Company Product Portfolio
11.1.5. Recent Developments
11.1.6. SWOT Analysis
11.2. Telerent Leasing Corp.
11.2.1. Business Overview
11.2.2. Company Snapshot
11.2.3. Company Market Share Analysis
11.2.4. Company Product Portfolio
11.2.5. Recent Developments
11.2.6. SWOT Analysis
11.3. Solutionz Inc.
11.3.1. Business Overview
11.3.2. Company Snapshot
11.3.3. Company Market Share Analysis
11.3.4. Company Product Portfolio
11.3.5. Recent Developments
11.3.6. SWOT Analysis
11.4. New ERA Technology Inc.
11.4.1. Business Overview
11.4.2. Company Snapshot
11.4.3. Company Market Share Analysis
11.4.4. Company Product Portfolio
11.4.5. Recent Developments
11.4.6. SWOT Analysis
11.5. Microsoft Azure
11.5.1. Business Overview
11.5.2. Company Snapshot
11.5.3. Company Market Share Analysis
11.5.4. Company Product Portfolio
11.5.5. Recent Developments
11.5.6. SWOT Analysis
11.6. Ford Audio-Video Systems LLC
11.6.1. Business Overview
11.6.2. Company Snapshot
11.6.3. Company Market Share Analysis
11.6.4. Company Product Portfolio
11.6.5. Recent Developments
11.6.6. SWOT Analysis
11.7. CCS Presentation Systems LLC
11.7.1. Business Overview
11.7.2. Company Snapshot
11.7.3. Company Market Share Analysis
11.7.4. Company Product Portfolio
11.7.5. Recent Developments
11.7.6. SWOT Analysis
11.8. Biamp Systems LLC
11.8.1. Business Overview
11.8.2. Company Snapshot
11.8.3. Company Market Share Analysis
11.8.4. Company Product Portfolio
11.8.5. Recent Developments
11.8.6. SWOT Analysis
11.9. AVI Systems Inc.
11.9.1. Business Overview
11.9.2. Company Snapshot
11.9.3. Company Market Share Analysis
11.9.4. Company Product Portfolio
11.9.5. Recent Developments
11.9.6. SWOT Analysis
11.10. Anixter International Inc.
11.10.1. Business Overview
11.10.2. Company Snapshot
11.10.3. Company Market Share Analysis
11.10.4. Company Product Portfolio
11.10.5. Recent Developments
11.10.6. SWOT Analysis
List of Table
1. Global Pro AV Market, By Type, 2019-2032 (USD Billion)
2. Global Products Pro AV Market, By Region, 2019-2032 (USD Billion)
3. Global Services Pro AV Market, By Region, 2019-2032 (USD Billion)
4. Global Pro AV Market, By Application, 2019-2032 (USD Billion)
5. Global Commercial Pro AV Market, By Region, 2019-2032 (USD Billion)
6. Global Government Pro AV Market, By Region, 2019-2032 (USD Billion)
7. Global Retail Pro AV Market, By Region, 2019-2032 (USD Billion)
8. Global Home Use Pro AV Market, By Region, 2019-2032 (USD Billion)
9. Global Education Pro AV Market, By Region, 2019-2032 (USD Billion)
10. Global Hospitality Pro AV Market, By Region, 2019-2032 (USD Billion)
11. Global Others Pro AV Market, By Region, 2019-2032 (USD Billion)
12. Global Pro AV Market, By Distribution Channel, 2019-2032 (USD Billion)
13. Global Direct Sales Pro AV Market, By Region, 2019-2032 (USD Billion)
14. Global Distributors Pro AV Market, By Region, 2019-2032 (USD Billion)
15. Global Pro AV Market, By Region, 2019-2032 (USD Billion)
16. North America Pro AV Market, By Type, 2019-2032 (USD Billion)
17. North America Pro AV Market, By Application, 2019-2032 (USD Billion)
18. North America Pro AV Market, By Distribution Channel, 2019-2032 (USD Billion)
19. U.S. Pro AV Market, By Type, 2019-2032 (USD Billion)
20. U.S. Pro AV Market, By Application, 2019-2032 (USD Billion)
21. U.S. Pro AV Market, By Distribution Channel, 2019-2032 (USD Billion)
22. Canada Pro AV Market, By Type, 2019-2032 (USD Billion)
23. Canada Pro AV Market, By Application, 2019-2032 (USD Billion)
24. Canada Pro AV Market, By Distribution Channel, 2019-2032 (USD Billion)
25. Mexico Pro AV Market, By Type, 2019-2032 (USD Billion)
26. Mexico Pro AV Market, By Application, 2019-2032 (USD Billion)
27. Mexico Pro AV Market, By Distribution Channel, 2019-2032 (USD Billion)
28. Europe Pro AV Market, By Type, 2019-2032 (USD Billion)
29. Europe Pro AV Market, By Application, 2019-2032 (USD Billion)
30. Europe Pro AV Market, By Distribution Channel, 2019-2032 (USD Billion)
31. Germany Pro AV Market, By Type, 2019-2032 (USD Billion)
32. Germany Pro AV Market, By Application, 2019-2032 (USD Billion)
33. Germany Pro AV Market, By Distribution Channel, 2019-2032 (USD Billion)
34. France Pro AV Market, By Type, 2019-2032 (USD Billion)
35. France Pro AV Market, By Application, 2019-2032 (USD Billion)
36. France Pro AV Market, By Distribution Channel, 2019-2032 (USD Billion)
37. U.K. Pro AV Market, By Type, 2019-2032 (USD Billion)
38. U.K. Pro AV Market, By Application, 2019-2032 (USD Billion)
39. U.K. Pro AV Market, By Distribution Channel, 2019-2032 (USD Billion)
40. Italy Pro AV Market, By Type, 2019-2032 (USD Billion)
41. Italy Pro AV Market, By Application, 2019-2032 (USD Billion)
42. Italy Pro AV Market, By Distribution Channel, 2019-2032 (USD Billion)
43. Spain Pro AV Market, By Type, 2019-2032 (USD Billion)
44. Spain Pro AV Market, By Application, 2019-2032 (USD Billion)
45. Spain Pro AV Market, By Distribution Channel, 2019-2032 (USD Billion)
46. Asia Pacific Pro AV Market, By Type, 2019-2032 (USD Billion)
47. Asia Pacific Pro AV Market, By Application, 2019-2032 (USD Billion)
48. Asia Pacific Pro AV Market, By Distribution Channel, 2019-2032 (USD Billion)
49. Japan Pro AV Market, By Type, 2019-2032 (USD Billion)
50. Japan Pro AV Market, By Application, 2019-2032 (USD Billion)
51. Japan Pro AV Market, By Distribution Channel, 2019-2032 (USD Billion)
52. China Pro AV Market, By Type, 2019-2032 (USD Billion)
53. China Pro AV Market, By Application, 2019-2032 (USD Billion)
54. China Pro AV Market, By Distribution Channel, 2019-2032 (USD Billion)
55. India Pro AV Market, By Type, 2019-2032 (USD Billion)
56. India Pro AV Market, By Application, 2019-2032 (USD Billion)
57. India Pro AV Market, By Distribution Channel, 2019-2032 (USD Billion)
58. South America Pro AV Market, By Type, 2019-2032 (USD Billion)
59. South America Pro AV Market, By Application, 2019-2032 (USD Billion)
60. South America Pro AV Market, By Distribution Channel, 2019-2032 (USD Billion)
61. Brazil Pro AV Market, By Type, 2019-2032 (USD Billion)
62. Brazil Pro AV Market, By Application, 2019-2032 (USD Billion)
63. Brazil Pro AV Market, By Distribution Channel, 2019-2032 (USD Billion)
64. Middle East and Africa Pro AV Market, By Type, 2019-2032 (USD Billion)
65. Middle East and Africa Pro AV Market, By Application, 2019-2032 (USD Billion)
66. Middle East and Africa Pro AV Market, By Distribution Channel, 2019-2032 (USD Billion)
67. UAE Pro AV Market, By Type, 2019-2032 (USD Billion)
68. UAE Pro AV Market, By Application, 2019-2032 (USD Billion)
69. UAE Pro AV Market, By Distribution Channel, 2019-2032 (USD Billion)
70. South Africa Pro AV Market, By Type, 2019-2032 (USD Billion)
71. South Africa Pro AV Market, By Application, 2019-2032 (USD Billion)
72. South Africa Pro AV Market, By Distribution Channel, 2019-2032 (USD Billion)
List of Figures
1. Global Pro AV Market Segmentation
2. Pro AV Market: Research Methodology
3. Market Size Estimation Methodology: Bottom-Up Approach
4. Market Size Estimation Methodology: Top-Down Approach
5. Data Triangulation
6. Porter’s Five Forces Analysis
7. Value Chain Analysis
8. Global Pro AV Market Attractiveness Analysis by Type
9. Global Pro AV Market Attractiveness Analysis by Application
10. Global Pro AV Market Attractiveness Analysis by Distribution Channel
11. Global Pro AV Market Attractiveness Analysis by Region
12. Global Pro AV Market: Dynamics
13. Global Pro AV Market Share by Type (2022 & 2032)
14. Global Pro AV Market Share by Application (2022 & 2032)
15. Global Pro AV Market Share by Distribution Channel (2022 & 2032)
16. Global Pro AV Market Share by Regions (2022 & 2032)
17. Global Pro AV Market Share by Company (2022)
This study forecasts revenue at global, regional, and country levels from 2019 to 2032. The Brainy Insights has segmented the global pro AV market based on below mentioned segments:
Global Pro AV Market by Type:
Global Pro AV Market by Application:
Global Pro AV Market by Distribution Channel:
Global Pro AV Market by Region:
Research has its special purpose to undertake marketing efficiently. In this competitive scenario, businesses need information across all industry verticals; the information about customer wants, market demand, competition, industry trends, distribution channels etc. This information needs to be updated regularly because businesses operate in a dynamic environment. Our organization, The Brainy Insights incorporates scientific and systematic research procedures in order to get proper market insights and industry analysis for overall business success. The analysis consists of studying the market from a miniscule level wherein we implement statistical tools which helps us in examining the data with accuracy and precision.
Our research reports feature both; quantitative and qualitative aspects for any market. Qualitative information for any market research process are fundamental because they reveal the customer needs and wants, usage and consumption for any product/service related to a specific industry. This in turn aids the marketers/investors in knowing certain perceptions of the customers. Qualitative research can enlighten about the different product concepts and designs along with unique service offering that in turn, helps define marketing problems and generate opportunities. On the other hand, quantitative research engages with the data collection process through interviews, e-mail interactions, surveys and pilot studies. Quantitative aspects for the market research are useful to validate the hypotheses generated during qualitative research method, explore empirical patterns in the data with the help of statistical tools, and finally make the market estimations.
The Brainy Insights offers comprehensive research and analysis, based on a wide assortment of factual insights gained through interviews with CXOs and global experts and secondary data from reliable sources. Our analysts and industry specialist assume vital roles in building up statistical tools and analysis models, which are used to analyse the data and arrive at accurate insights with exceedingly informative research discoveries. The data provided by our organization have proven precious to a diverse range of companies, facilitating them to address issues such as determining which products/services are the most appealing, whether or not customers use the product in the manner anticipated, the purchasing intentions of the market and many others.
Our research methodology encompasses an idyllic combination of primary and secondary initiatives. Key phases involved in this process are listed below:

The phase involves the gathering and collecting of market data and its related information with the help of different sources & research procedures.

The data procurement stage involves in data gathering and collecting through various data sources.
This stage involves in extensive research. These data sources includes:
Purchased Database: Purchased databases play a crucial role in estimating the market sizes irrespective of the domain. Our purchased database includes:
Primary Research: The Brainy Insights interacts with leading companies and experts of the concerned domain to develop the analyst team’s market understanding and expertise. It improves and substantiates every single data presented in the market reports. Primary research mainly involves in telephonic interviews, E-mail interactions and face-to-face interviews with the raw material providers, manufacturers/producers, distributors, & independent consultants. The interviews that we conduct provides valuable data on market size and industry growth trends prevailing in the market. Our organization also conducts surveys with the various industry experts in order to gain overall insights of the industry/market. For instance, in healthcare industry we conduct surveys with the pharmacists, doctors, surgeons and nurses in order to gain insights and key information of a medical product/device/equipment which the customers are going to usage. Surveys are conducted in the form of questionnaire designed by our own analyst team. Surveys plays an important role in primary research because surveys helps us to identify the key target audiences of the market. Additionally, surveys helps to identify the key target audience engaged with the market. Our survey team conducts the survey by targeting the key audience, thus gaining insights from them. Based on the perspectives of the customers, this information is utilized to formulate market strategies. Moreover, market surveys helps us to understand the current competitive situation of the industry. To be precise, our survey process typically involve with the 360 analysis of the market. This analytical process begins by identifying the prospective customers for a product or service related to the market/industry to obtain data on how a product/service could fit into customers’ lives.

Secondary Research: The secondary data sources includes information published by the on-profit organizations such as World bank, WHO, company fillings, investor presentations, annual reports, national government documents, statistical databases, blogs, articles, white papers and others. From the annual report, we analyse a company’s revenue to understand the key segment and market share of that organization in a particular region. We analyse the company websites and adopt the product mapping technique which is important for deriving the segment revenue. In the product mapping method, we select and categorize the products offered by the companies catering to domain specific market, deduce the product revenue for each of the companies so as to get overall estimation of the market size. We also source data and analyses trends based on information received from supply side and demand side intermediaries in the value chain. The supply side denotes the data gathered from supplier, distributor, wholesaler and the demand side illustrates the data gathered from the end customers for respective market domain.

The supply side for a domain specific market is analysed by:
The demand side for the market is estimated through:
In-house Library: Apart from these third-party sources, we have our in-house library of qualitative and quantitative information. Our in-house database includes market data for various industry and domains. These data are updated on regular basis as per the changing market scenario. Our library includes, historic databases, internal audit reports and archives.
Sometimes there are instances where there is no metadata or raw data available for any domain specific market. For those cases, we use our expertise to forecast and estimate the market size in order to generate comprehensive data sets. Our analyst team adopt a robust research technique in order to produce the estimates:
Data Synthesis: This stage involves the analysis & mapping of all the information obtained from the previous step. It also involves in scrutinizing the data for any discrepancy observed while data gathering related to the market. The data is collected with consideration to the heterogeneity of sources. Robust scientific techniques are in place for synthesizing disparate data sets and provide the essential contextual information that can orient market strategies. The Brainy Insights has extensive experience in data synthesis where the data passes through various stages:


Market Deduction & Formulation: The final stage comprises of assigning data points at appropriate market spaces so as to deduce feasible conclusions. Analyst perspective & subject matter expert based holistic form of market sizing coupled with industry analysis also plays a crucial role in this stage.
This stage involves in finalization of the market size and numbers that we have collected from data integration step. With data interpolation, it is made sure that there is no gap in the market data. Successful trend analysis is done by our analysts using extrapolation techniques, which provide the best possible forecasts for the market.
Data Validation & Market Feedback: Validation is the most important step in the process. Validation & re-validation via an intricately designed process helps us finalize data-points to be used for final calculations.

The Brainy Insights interacts with leading companies and experts of the concerned domain to develop the analyst team’s market understanding and expertise. It improves and substantiates every single data presented in the market reports. The data validation interview and discussion panels are typically composed of the most experienced industry members. The participants include, however, are not limited to:
Moreover, we always validate our data and findings through primary respondents from all the major regions we are working on.


Free Customization
Fortune 500 Clients
Free Yearly Update On Purchase Of Multi/Corporate License
Companies Served Till Date