- +1-315-215-1633
- sales@thebrainyinsights.com

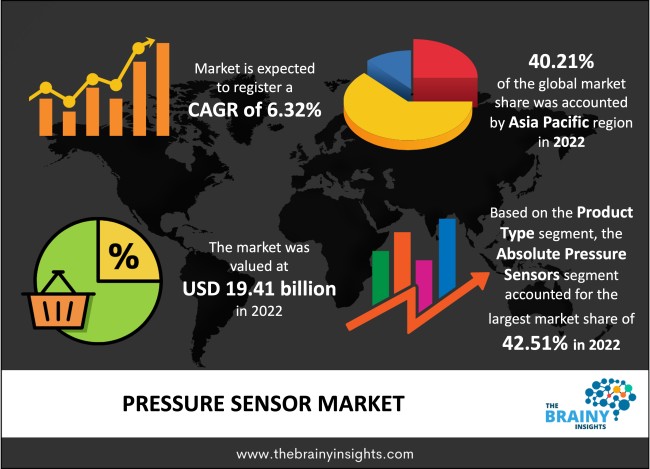
The global pressure sensor market was valued at USD 19.41 Billion in 2022 and grew at a CAGR of 6.32% from 2023 to 2032. The market is expected to reach USD 35.82 Billion by 2032. The increasing demand for pressure sensors can be attributed to the rising automation requirement among end-users. These pressure sensors enable efficient machinery, automotive, aerospace, defence and consumer goods operations.
Pressure sensors are devices that convert mechanical pressure into an electric output signal. These sensors consist of a pressure transducer, a pressure-sensitive component that can detect, measure, or monitor the applied pressure, and electronic components that convert the data into an electrical signal. A pressure sensor is built structurally of a metal body to which metal foil strain gauges are joined. The body of these force-measuring sensors is often made of aluminium or stainless steel, which gives the sensor the strength to handle heavy loads and the elasticity to deform slightly and recover to its original shape when the force is withdrawn.
Get an overview of this study by requesting a free sample
Increasing pressure sensors among end-users: Pressure sensors are utilized in various everyday applications, such as indirect measures of speed, gas/fluid flow, altitude, and water levels. Due to their diverse applications, they differ greatly in design, technology, stability, performance, and cost. The non-invasive sensing capabilities of pressure sensors have extended their application, particularly in medicine, such as monitoring and changing air pressure in respiratory apparatus, blood pressure measures, etc. Recently, MEMS devices have enabled these systems to be miniaturized, which has broadened their involvement in medical applications through catheter tip sensors and implantable device monitoring. Capacitive pressure sensors are commonly employed in automobile tyres, jet engines, the human body and other applications to measure gas/liquid pressures. Due to its robustness, high frequency, and quick response time, piezoelectric sensors can be employed in various aeronautical and industrial applications.
Incompatibility issues: Pressure sensors are incompatible with low-power or battery-powered systems. Scaling down pressure has limitations because it reduces sensitivity and increases power usage. Further, the sensors experience adhesive problems at high temperatures and under pressure; thus, the output varies with temperature.
Growing technical advancements: The technological advancements in pressure sensor production provide lucrative market opportunities, especially in developing regions like Asia-Pacific. Pressure sensors are a rapidly evolving technology, with advancements altering goods in various industries. A few major trends characterize pressure sensor technology. The desire for smaller, more portable devices and the necessity to preserve space in increasingly crowded environments is driving this trend. The need for more precise measurements, particularly in the medical and industrial domains, is driving this trend. Flexible pressure sensors are gaining popularity among researchers. They are being used in various new electronic devices due to their unique high flexibility, high sensitivity, and lightweight characteristics.
The regions analyzed for the market include North America, Europe, South America, Asia Pacific, the Middle East, and Africa. Asia-Pacific emerged as the most significant pressure sensor market, with a 40.21% market revenue share in 2022.
Asia-Pacific region will account for the largest market share with revenue growth. Nations such as China, India and Japan have a tremendous demand for pressure sensors due to growing automotive, oil and gas, and consumer electronics requirements. The increasing number of manufacturers developing pressure sensors suited for different applications will provide lucrative opportunities to the market.
Asia Pacific Region Pressure Sensor Market Share in 2022 - 40.21%
www.thebrainyinsights.com
Check the geographical analysis of this market by requesting a free sample
The product type segment is divided into differential pressure sensors, absolute pressure sensors, sealed pressure sensors, vacuum pressure sensors and gauge pressure sensors. The absolute pressure sensors segment dominated the market, with a share of around 42.51% in 2022. An absolute pressure sensor is a sealed system that uses a perfect vacuum, producing pressure measurements free of the effects of ambient pressure.
The sensor type segment is divided into wired and wireless. The wired segment dominated the market, with a share of around 77.19% in 2022. Wired pressure sensors are widely available in different technologies, such as capacitive, photoelectric and inductive. There are several wired pressure sensors used in automotive and industrial settings.
The technology segment is divided into resonant solid state, piezoresistive, electromagnetic, capacitive, optical and others. The piezoresistive segment dominated the market, with a share of around 28.03% in 2022. Piezoresistive pressure sensors measure against different zero points depending on the type of sensor. When mechanical strain is applied, a piezoresistive pressure sensor estimates a change in electrical resistance.
The end-users segment is divided into consumer electronics, automotive, medical, oil and gas, aerospace and defense, industrial and others. The automotive segment dominated the market, with a share of around 32.05% in 2022. An electronic pressure sensor is most commonly used to detect the pressure of a vehicle's vital fluids in the cooling, braking, and fuel systems, such as gearbox oil, engine oil, and hydraulic oil.
| Attribute | Description |
|---|---|
| Market Size | Revenue (USD Billion) |
| Market size value in 2022 | USD 19.41 Billion |
| Market size value in 2032 | USD 35.82 Billion |
| CAGR (2023 to 2032) | 6.32% |
| Historical data | 2019-2021 |
| Base Year | 2022 |
| Forecast | 2023-2032 |
| Region | The regions analyzed for the market are Asia Pacific, Europe, South America, North America, and Middle East & Africa. Furthermore, the regions are further analyzed at the country level. |
| Segments | Product Type, Sensor Type, Technology and End-users |
As per The Brainy Insights, the size of the pressure sensor market was valued USD 19.41 billion in 2022 to USD 35.82 billion by 2032.
Global pressure sensor market is growing at a CAGR of 6.32% during the forecast period 2023-2032.
Asia-Pacific region emerged as the largest market for the Pressure sensor.
The market's growth will be influenced by the rising deployment of pressure sensors in different applications.
The incompatibility at high temperatures can hamper the market growth.
The rising technological advancement is providing huge opportunities to the market.
1. Introduction
1.1. Objectives of the Study
1.2. Market Definition
1.3. Research Scope
1.4. Currency
1.5. Key Target Audience
2. Research Methodology and Assumptions
3. Executive Summary
4. Premium Insights
4.1. Porter’s Five Forces Analysis
4.2. Value Chain Analysis
4.3. Top Investment Pockets
4.3.1. Market Attractiveness Analysis by Product Type
4.3.2. Market Attractiveness Analysis by Sensor Type
4.3.3. Market Attractiveness Analysis by Technology
4.3.4. Market Attractiveness Analysis by End-users
4.3.5. Market Attractiveness Analysis by Region
4.4. Industry Trends
5. Market Dynamics
5.1. Market Evaluation
5.2. Drivers
5.2.1. Increasing use of pressure sensor in different applications
5.3. Restraints
5.3.1. Incompatible at higher temperatures
5.4. Opportunities
5.4.1. Increasing technological advancement
5.5. Challenges
5.5.1. Demand supply issues
6. Global Pressure Sensor Market Analysis and Forecast, By Product Type
6.1. Segment Overview
6.2. Differential Pressure Sensors
6.3. Absolute Pressure Sensors
6.4. Sealed Pressure Sensors
6.5. Vacuum Pressure Sensors
6.6. Gauge Pressure Sensors
7. Global Pressure Sensor Market Analysis and Forecast, By Sensor Type
7.1. Segment Overview
7.2. Wired
7.3. Wireless
8. Global Pressure Sensor Market Analysis and Forecast, By Technology
8.1. Segment Overview
8.2. Resonant Solid State
8.3. Piezoresistive
8.4. Electromagnetic
8.5. Capacitive
8.6. Optical
8.7. Others
9. Global Pressure Sensor Market Analysis and Forecast, By End-users
9.1. Segment Overview
9.2. Consumer Electronics
9.3. Automotive
9.4. Medical
9.5. Oil and Gas
9.6. Aerospace and Defense
9.7. Industrial
9.8. Others
10. Global Pressure Sensor Market Analysis and Forecast, By Regional Analysis
10.1. Segment Overview
10.2. North America
10.2.1. U.S.
10.2.2. Canada
10.2.3. Mexico
10.3. Europe
10.3.1. Germany
10.3.2. France
10.3.3. U.K.
10.3.4. Italy
10.3.5. Spain
10.4. Asia-Pacific
10.4.1. Japan
10.4.2. China
10.4.3. India
10.5. South America
10.5.1. Brazil
10.6. Middle East and Africa
10.6.1. UAE
10.6.2. South Africa
11. Global Pressure Sensor Market-Competitive Landscape
11.1. Overview
11.2. Market Share of Key Players in the Pressure Sensor Market
11.2.1. Global Company Market Share
11.2.2. North America Company Market Share
11.2.3. Europe Company Market Share
11.2.4. APAC Company Market Share
11.3. Competitive Situations and Trends
11.3.1. Product Launches and Developments
11.3.2. Partnerships, Collaborations, and Agreements
11.3.3. Mergers & Acquisitions
11.3.4. Expansions
12. Company Profiles
12.1. AlphaSense
12.1.1. Business Overview
12.1.2. Company Snapshot
12.1.3. Company Market Share Analysis
12.1.4. Company Product Portfolio
12.1.5. Recent Developments
12.1.6. SWOT Analysis
12.2. Dynament Ltd.
12.2.1. Business Overview
12.2.2. Company Snapshot
12.2.3. Company Market Share Analysis
12.2.4. Company Product Portfolio
12.2.5. Recent Developments
12.2.6. SWOT Analysis
12.3. City Technology Ltd.
12.3.1. Business Overview
12.3.2. Company Snapshot
12.3.3. Company Market Share Analysis
12.3.4. Company Product Portfolio
12.3.5. Recent Developments
12.3.6. SWOT Analysis
12.4. GfG Europe Ltd.
12.4.1. Business Overview
12.4.2. Company Snapshot
12.4.3. Company Market Share Analysis
12.4.4. Company Product Portfolio
12.4.5. Recent Developments
12.4.6. SWOT Analysis
12.5. Membrapor
12.5.1. Business Overview
12.5.2. Company Snapshot
12.5.3. Company Market Share Analysis
12.5.4. Company Product Portfolio
12.5.5. Recent Developments
12.5.6. SWOT Analysis
12.6. Figaro Engineering Inc.
12.6.1. Business Overview
12.6.2. Company Snapshot
12.6.3. Company Market Share Analysis
12.6.4. Company Product Portfolio
12.6.5. Recent Developments
12.6.6. SWOT Analysis
12.7. Nemoto Kyorindo Co., Ltd.
12.7.1. Business Overview
12.7.2. Company Snapshot
12.7.3. Company Market Share Analysis
12.7.4. Company Product Portfolio
12.7.5. Recent Developments
12.7.6. SWOT Analysis
12.8. ABB Ltd.
12.8.1. Business Overview
12.8.2. Company Snapshot
12.8.3. Company Market Share Analysis
12.8.4. Company Product Portfolio
12.8.5. Recent Developments
12.8.6. SWOT Analysis
12.9. Robert Bosch GmbH
12.9.1. Business Overview
12.9.2. Company Snapshot
12.9.3. Company Market Share Analysis
12.9.4. Company Product Portfolio
12.9.5. Recent Developments
12.9.6. SWOT Analysis
12.10. Honeywell International
12.10.1. Business Overview
12.10.2. Company Snapshot
12.10.3. Company Market Share Analysis
12.10.4. Company Product Portfolio
12.10.5. Recent Developments
12.10.6. SWOT Analysis
12.11. Emerson Electric
12.11.1. Business Overview
12.11.2. Company Snapshot
12.11.3. Company Market Share Analysis
12.11.4. Company Product Portfolio
12.11.5. Recent Developments
12.11.6. SWOT Analysis
12.12. Siemens
12.12.1. Business Overview
12.12.2. Company Snapshot
12.12.3. Company Market Share Analysis
12.12.4. Company Product Portfolio
12.12.5. Recent Developments
12.12.6. SWOT Analysis
12.13. TT Electronics
12.13.1. Business Overview
12.13.2. Company Snapshot
12.13.3. Company Market Share Analysis
12.13.4. Company Product Portfolio
12.13.5. Recent Developments
12.13.6. SWOT Analysis
12.14. TE Connectivity Ltd.
12.14.1. Business Overview
12.14.2. Company Snapshot
12.14.3. Company Market Share Analysis
12.14.4. Company Product Portfolio
12.14.5. Recent Developments
12.14.6. SWOT Analysis
12.15. Amphenol
12.15.1. Business Overview
12.15.2. Company Snapshot
12.15.3. Company Market Share Analysis
12.15.4. Company Product Portfolio
12.15.5. Recent Developments
12.15.6. SWOT Analysis
List of Table
1. Global Pressure Sensor Market, By Product Type, 2019-2032 (USD Billion)
2. Global Differential Pressure Sensors, Pressure Sensor Market, By Region, 2019-2032 (USD Billion)
3. Global Absolute Pressure Sensors, Pressure Sensor Market, By Region, 2019-2032 (USD Billion)
4. Global Sealed Pressure Sensors, Pressure Sensor Market, By Region, 2019-2032 (USD Billion)
5. Global Vacuum Pressure Sensors, Pressure Sensor Market, By Region, 2019-2032 (USD Billion)
6. Global Gauge Pressure Sensors, Pressure Sensor Market, By Region, 2019-2032 (USD Billion)
7. Global Pressure Sensor Market, By Sensor Type, 2019-2032 (USD Billion)
8. Global Wired, Pressure Sensor Market, By Region, 2019-2032 (USD Billion)
9. Global Wireless, Pressure Sensor Market, By Region, 2019-2032 (USD Billion)
10. Global Pressure Sensor Market, By Technology, 2019-2032 (USD Billion)
11. Global Resonant Solid State, Pressure Sensor Market, By Region, 2019-2032 (USD Billion)
12. Global Clinical Operations, Pressure Sensor Market, By Region, 2019-2032 (USD Billion)
13. Global Piezoresistive, Pressure Sensor Market, By Region, 2019-2032 (USD Billion)
14. Global Electromagnetic, Pressure Sensor Market, By Region, 2019-2032 (USD Billion)
15. Global Capacitive, Pressure Sensor Market, By Region, 2019-2032 (USD Billion)
16. Global Optical, Pressure Sensor Market, By Region, 2019-2032 (USD Billion)
17. Global Others, Pressure Sensor Market, By Region, 2019-2032 (USD Billion)
18. Global Pressure Sensor Market, By End-users, 2019-2032 (USD Billion)
19. Global Consumer Electronics, Pressure Sensor Market, By Region, 2019-2032 (USD Billion)
20. Global Automotive, Pressure Sensor Market, By Region, 2019-2032 (USD Billion)
21. Global Medical, Pressure Sensor Market, By Region, 2019-2032 (USD Billion)
22. Global Oil and Gas, Pressure Sensor Market, By Region, 2019-2032 (USD Billion)
23. Global Aerospace and Defense, Pressure Sensor Market, By Region, 2019-2032 (USD Billion)
24. Global Industrial, Pressure Sensor Market, By Region, 2019-2032 (USD Billion)
25. Global Others, Pressure Sensor Market, By Region, 2019-2032 (USD Billion)
26. Global Pressure Sensor Market, By Region, 2019-2032 (USD Billion)
27. North America Pressure Sensor Market, By Product Type, 2019-2032 (USD Billion)
28. North America Pressure Sensor Market, By Sensor Type, 2019-2032 (USD Billion)
29. North America Pressure Sensor Market, By Technology, 2019-2032 (USD Billion)
30. North America Pressure Sensor Market, By End-users, 2019-2032 (USD Billion)
31. U.S. Pressure Sensor Market, By Product Type, 2019-2032 (USD Billion)
32. U.S. Pressure Sensor Market, By Sensor Type, 2019-2032 (USD Billion)
33. U.S. Pressure Sensor Market, By Technology, 2019-2032 (USD Billion)
34. U.S. Pressure Sensor Market, By End-users, 2019-2032 (USD Billion)
35. Canada Pressure Sensor Market, By Product Type, 2019-2032 (USD Billion)
36. Canada Pressure Sensor Market, By Sensor Type, 2019-2032 (USD Billion)
37. Canada Pressure Sensor Market, By Technology, 2019-2032 (USD Billion)
38. Canada Pressure Sensor Market, By End-users, 2019-2032 (USD Billion)
39. Mexico Pressure Sensor Market, By Product Type, 2019-2032 (USD Billion)
40. Mexico Pressure Sensor Market, By Sensor Type, 2019-2032 (USD Billion)
41. Mexico Pressure Sensor Market, By Technology, 2019-2032 (USD Billion)
42. Mexico Pressure Sensor Market, By End-users, 2019-2032 (USD Billion)
43. Europe Pressure Sensor Market, By Product Type, 2019-2032 (USD Billion)
44. Europe Pressure Sensor Market, By Sensor Type, 2019-2032 (USD Billion)
45. Europe Pressure Sensor Market, By Technology, 2019-2032 (USD Billion)
46. Europe Pressure Sensor Market, By End-users, 2019-2032 (USD Billion)
47. Germany Pressure Sensor Market, By Product Type, 2019-2032 (USD Billion)
48. Germany Pressure Sensor Market, By Sensor Type, 2019-2032 (USD Billion)
49. Germany Pressure Sensor Market, By Technology, 2019-2032 (USD Billion)
50. Germany Pressure Sensor Market, By End-users, 2019-2032 (USD Billion)
51. France Pressure Sensor Market, By Product Type, 2019-2032 (USD Billion)
52. France Pressure Sensor Market, By Sensor Type, 2019-2032 (USD Billion)
53. France Pressure Sensor Market, By Technology, 2019-2032 (USD Billion)
54. France Pressure Sensor Market, By End-users, 2019-2032 (USD Billion)
55. U.K. Pressure Sensor Market, By Product Type, 2019-2032 (USD Billion)
56. U.K. Pressure Sensor Market, By Sensor Type, 2019-2032 (USD Billion)
57. U.K. Pressure Sensor Market, By Technology, 2019-2032 (USD Billion)
58. U.K. Pressure Sensor Market, By End-users, 2019-2032 (USD Billion)
59. Italy Pressure Sensor Market, By Product Type, 2019-2032 (USD Billion)
60. Italy Pressure Sensor Market, By Sensor Type, 2019-2032 (USD Billion)
61. Italy Pressure Sensor Market, By Technology, 2019-2032 (USD Billion)
62. Italy Pressure Sensor Market, By End-users, 2019-2032 (USD Billion)
63. Spain Pressure Sensor Market, By Product Type, 2019-2032 (USD Billion)
64. Spain Pressure Sensor Market, By Sensor Type, 2019-2032 (USD Billion)
65. Spain Pressure Sensor Market, By Technology, 2019-2032 (USD Billion)
66. Spain Pressure Sensor Market, By End-users, 2019-2032 (USD Billion)
67. Asia Pacific Pressure Sensor Market, By Product Type, 2019-2032 (USD Billion)
68. Asia Pacific Pressure Sensor Market, By Sensor Type, 2019-2032 (USD Billion)
69. Asia Pacific Pressure Sensor Market, By Technology, 2019-2032 (USD Billion)
70. Asia Pacific Pressure Sensor Market, By End-users, 2019-2032 (USD Billion)
71. Japan Pressure Sensor Market, By Product Type, 2019-2032 (USD Billion)
72. Japan Pressure Sensor Market, By Sensor Type, 2019-2032 (USD Billion)
73. Japan Pressure Sensor Market, By Technology, 2019-2032 (USD Billion)
74. Japan Pressure Sensor Market, By End-users, 2019-2032 (USD Billion)
75. China Pressure Sensor Market, By Product Type, 2019-2032 (USD Billion)
76. China Pressure Sensor Market, By Sensor Type, 2019-2032 (USD Billion)
77. China Pressure Sensor Market, By Technology, 2019-2032 (USD Billion)
78. China Pressure Sensor Market, By End-users, 2019-2032 (USD Billion)
79. India Pressure Sensor Market, By Product Type, 2019-2032 (USD Billion)
80. India Pressure Sensor Market, By Sensor Type, 2019-2032 (USD Billion)
81. India Pressure Sensor Market, By Technology, 2019-2032 (USD Billion)
82. India Pressure Sensor Market, By End-users, 2019-2032 (USD Billion)
83. South America Pressure Sensor Market, By Product Type, 2019-2032 (USD Billion)
84. South America Pressure Sensor Market, By Sensor Type, 2019-2032 (USD Billion)
85. South America Pressure Sensor Market, By Technology, 2019-2032 (USD Billion)
86. South America Pressure Sensor Market, By End-users, 2019-2032 (USD Billion)
87. Brazil Pressure Sensor Market, By Product Type, 2019-2032 (USD Billion)
88. Brazil Pressure Sensor Market, By Sensor Type, 2019-2032 (USD Billion)
89. Brazil Pressure Sensor Market, By Technology, 2019-2032 (USD Billion)
90. BrazilPressure Sensor Market, By End-users, 2019-2032 (USD Billion)
91. Middle East and Africa Pressure Sensor Market, By Product Type, 2019-2032 (USD Billion)
92. Middle East and Africa Pressure Sensor Market, By Sensor Type, 2019-2032 (USD Billion)
93. Middle East and Africa Pressure Sensor Market, By Technology, 2019-2032 (USD Billion)
94. Middle East and Africa Pressure Sensor Market, By End-users, 2019-2032 (USD Billion)
95. UAE Pressure Sensor Market, By Product Type, 2019-2032 (USD Billion)
96. UAE Pressure Sensor Market, By Sensor Type, 2019-2032 (USD Billion)
97. UAE Pressure Sensor Market, By Technology, 2019-2032 (USD Billion)
98. UAE Pressure Sensor Market, By End-users, 2019-2032 (USD Billion)
99. South Africa Pressure Sensor Market, By Product Type, 2019-2032 (USD Billion)
100. South Africa Pressure Sensor Market, By Sensor Type, 2019-2032 (USD Billion)
101. South Africa Pressure Sensor Market, By Technology, 2019-2032 (USD Billion)
102. South Africa Pressure Sensor Market, By End-users, 2019-2032 (USD Billion)
List of Figures
1. Global Pressure Sensor Market Segmentation
2. Pressure Sensor Market: Research Methodology
3. Market Size Estimation Methodology: Bottom-Up Approach
4. Market Size Estimation Methodology: Top-Down Approach
5. Data Triangulation
6. Porter’s Five Forces Analysis
7. Value Chain Analysis
8. Global Pressure Sensor Market Attractiveness Analysis by Product Type
9. Global Pressure Sensor Market Attractiveness Analysis by Sensor Type
10. Global Pressure Sensor Market Attractiveness Analysis by Technology
11. Global Pressure Sensor Market Attractiveness Analysis by End-users
12. Global Pressure Sensor Market Attractiveness Analysis by Region
13. Global Pressure Sensor Market: Dynamics
14. Global Pressure Sensor Market Share by Product Type (2022 & 2032)
15. Global Pressure Sensor Market Share by Sensor Type (2022 & 2032)
16. Global Pressure Sensor Market Share by Technology (2022 & 2032)
17. Global Pressure Sensor Market Share by End-users (2022 & 2032)
18. Global Pressure Sensor Market Share by Regions (2022 & 2032)
19. Global Pressure Sensor Market Share by Company (2022)
This study forecasts revenue at global, regional, and country levels from 2019 to 2032. The Brainy Insights has segmented the global pressure sensor market based on below mentioned segments:
Global Pressure Sensor Market by Product Type:
Global Pressure Sensor Market by Sensor Type:
Global Pressure Sensor Market by Technology:
Global Pressure Sensor Market by End-users:
Global Pressure Sensor Market by Region:
Research has its special purpose to undertake marketing efficiently. In this competitive scenario, businesses need information across all industry verticals; the information about customer wants, market demand, competition, industry trends, distribution channels etc. This information needs to be updated regularly because businesses operate in a dynamic environment. Our organization, The Brainy Insights incorporates scientific and systematic research procedures in order to get proper market insights and industry analysis for overall business success. The analysis consists of studying the market from a miniscule level wherein we implement statistical tools which helps us in examining the data with accuracy and precision.
Our research reports feature both; quantitative and qualitative aspects for any market. Qualitative information for any market research process are fundamental because they reveal the customer needs and wants, usage and consumption for any product/service related to a specific industry. This in turn aids the marketers/investors in knowing certain perceptions of the customers. Qualitative research can enlighten about the different product concepts and designs along with unique service offering that in turn, helps define marketing problems and generate opportunities. On the other hand, quantitative research engages with the data collection process through interviews, e-mail interactions, surveys and pilot studies. Quantitative aspects for the market research are useful to validate the hypotheses generated during qualitative research method, explore empirical patterns in the data with the help of statistical tools, and finally make the market estimations.
The Brainy Insights offers comprehensive research and analysis, based on a wide assortment of factual insights gained through interviews with CXOs and global experts and secondary data from reliable sources. Our analysts and industry specialist assume vital roles in building up statistical tools and analysis models, which are used to analyse the data and arrive at accurate insights with exceedingly informative research discoveries. The data provided by our organization have proven precious to a diverse range of companies, facilitating them to address issues such as determining which products/services are the most appealing, whether or not customers use the product in the manner anticipated, the purchasing intentions of the market and many others.
Our research methodology encompasses an idyllic combination of primary and secondary initiatives. Key phases involved in this process are listed below:

The phase involves the gathering and collecting of market data and its related information with the help of different sources & research procedures.

The data procurement stage involves in data gathering and collecting through various data sources.
This stage involves in extensive research. These data sources includes:
Purchased Database: Purchased databases play a crucial role in estimating the market sizes irrespective of the domain. Our purchased database includes:
Primary Research: The Brainy Insights interacts with leading companies and experts of the concerned domain to develop the analyst team’s market understanding and expertise. It improves and substantiates every single data presented in the market reports. Primary research mainly involves in telephonic interviews, E-mail interactions and face-to-face interviews with the raw material providers, manufacturers/producers, distributors, & independent consultants. The interviews that we conduct provides valuable data on market size and industry growth trends prevailing in the market. Our organization also conducts surveys with the various industry experts in order to gain overall insights of the industry/market. For instance, in healthcare industry we conduct surveys with the pharmacists, doctors, surgeons and nurses in order to gain insights and key information of a medical product/device/equipment which the customers are going to usage. Surveys are conducted in the form of questionnaire designed by our own analyst team. Surveys plays an important role in primary research because surveys helps us to identify the key target audiences of the market. Additionally, surveys helps to identify the key target audience engaged with the market. Our survey team conducts the survey by targeting the key audience, thus gaining insights from them. Based on the perspectives of the customers, this information is utilized to formulate market strategies. Moreover, market surveys helps us to understand the current competitive situation of the industry. To be precise, our survey process typically involve with the 360 analysis of the market. This analytical process begins by identifying the prospective customers for a product or service related to the market/industry to obtain data on how a product/service could fit into customers’ lives.

Secondary Research: The secondary data sources includes information published by the on-profit organizations such as World bank, WHO, company fillings, investor presentations, annual reports, national government documents, statistical databases, blogs, articles, white papers and others. From the annual report, we analyse a company’s revenue to understand the key segment and market share of that organization in a particular region. We analyse the company websites and adopt the product mapping technique which is important for deriving the segment revenue. In the product mapping method, we select and categorize the products offered by the companies catering to domain specific market, deduce the product revenue for each of the companies so as to get overall estimation of the market size. We also source data and analyses trends based on information received from supply side and demand side intermediaries in the value chain. The supply side denotes the data gathered from supplier, distributor, wholesaler and the demand side illustrates the data gathered from the end customers for respective market domain.

The supply side for a domain specific market is analysed by:
The demand side for the market is estimated through:
In-house Library: Apart from these third-party sources, we have our in-house library of qualitative and quantitative information. Our in-house database includes market data for various industry and domains. These data are updated on regular basis as per the changing market scenario. Our library includes, historic databases, internal audit reports and archives.
Sometimes there are instances where there is no metadata or raw data available for any domain specific market. For those cases, we use our expertise to forecast and estimate the market size in order to generate comprehensive data sets. Our analyst team adopt a robust research technique in order to produce the estimates:
Data Synthesis: This stage involves the analysis & mapping of all the information obtained from the previous step. It also involves in scrutinizing the data for any discrepancy observed while data gathering related to the market. The data is collected with consideration to the heterogeneity of sources. Robust scientific techniques are in place for synthesizing disparate data sets and provide the essential contextual information that can orient market strategies. The Brainy Insights has extensive experience in data synthesis where the data passes through various stages:


Market Deduction & Formulation: The final stage comprises of assigning data points at appropriate market spaces so as to deduce feasible conclusions. Analyst perspective & subject matter expert based holistic form of market sizing coupled with industry analysis also plays a crucial role in this stage.
This stage involves in finalization of the market size and numbers that we have collected from data integration step. With data interpolation, it is made sure that there is no gap in the market data. Successful trend analysis is done by our analysts using extrapolation techniques, which provide the best possible forecasts for the market.
Data Validation & Market Feedback: Validation is the most important step in the process. Validation & re-validation via an intricately designed process helps us finalize data-points to be used for final calculations.

The Brainy Insights interacts with leading companies and experts of the concerned domain to develop the analyst team’s market understanding and expertise. It improves and substantiates every single data presented in the market reports. The data validation interview and discussion panels are typically composed of the most experienced industry members. The participants include, however, are not limited to:
Moreover, we always validate our data and findings through primary respondents from all the major regions we are working on.


Free Customization
Fortune 500 Clients
Free Yearly Update On Purchase Of Multi/Corporate License
Companies Served Till Date