- +1-315-215-1633
- sales@thebrainyinsights.com

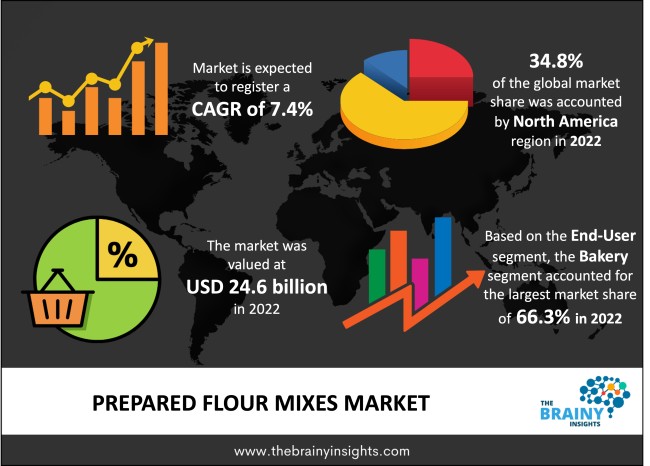
The global prepared flour mixes market was valued at USD 24.6 billion in 2022 and growing at a CAGR of 7.4% from 2023 to 2032. The market is expected to reach USD 50.2 billion by 2032. Over the forecast period, the industry's growth is anticipated to be significantly influenced by the increasing urban population and the demand for bakery products. The product's advantages over conventional formulae, such as simplicity of use, quick preparation, consistency of results, and longer shelf life, are fostering its expansion on a global scale. The demand for ready-to-cook flour mixes is growing due to the lengthening workdays and the time they save in the kitchen. This is a significant aspect that is likely to help in the industry's growth throughout the projected period.
The numerous elements that make up prepared flour mixes include wheat flour, liquid, leavening agents, shortening, salt, sugar, spices, and flavorings. These pre-made flour blends are designed to make a variety of items, including cakes, cookies, pasta, pastries, fast bread, yeast bread, and quick bread. The demand for the product is being fueled by the growing understanding of the significance of good eating practices. Because they are high in protein and fiber, whole grains and bread made from wheat are likely to see an increase in demand.
Get an overview of this study by requesting a free sample
Consumers who prefer to bake at home but don't want to measure and purchase several ingredients might benefit from prepared flour mixtures. Customers may save time and effort by using a prepackaged flour mix and just adding liquid and other ingredients as needed. Additionally, prepared flour mixes give consumers a variety of choices, including gluten-free, natural, and specialty blends. As a result, customers may select the mixture that best suits their dietary requirements and tastes.
Customers may be concerned about the freshness and quality of already prepared flour mixes, especially if they have been on shop shelves for an extended length of time. Furthermore, while many prepared flour mixes are marketed as healthier options, some consumers may still be concerned about the additives and preservatives used in these products or may have specific dietary constraints that prevent them from being consumed.
In many emerging regions, the prepared flour mix business is still relatively new, providing a chance for manufacturers to expand their goods into these areas and reach new customers. Furthermore, providing customizable and specific flour mixes can be a lucrative opportunity for manufacturers. This might involve allowing customers to build their own mixes as well as delivering mixes customized to certain dietary needs and tastes.
The North America region dominated the market in 2022 with the market share of 34.8%. Throughout the forecast period, the region is expected to continue to dominate. Due to an increase in the demand for bakery goods, the commercial baking industry mix market in North America is constantly expanding. The American Bakers Association (ABA) estimates that the baking sector in America employs close to 800,000 skilled workers, generates over 44 billion USD in direct compensation, and has a total economic effect of over 154 billion USD.
North America Region Prepared Flour Mixes Market Share in 2022 - 34.8%
www.thebrainyinsights.com
Check the geographical analysis of this market by requesting a free sample
Bakery segment dominated the global market in 2022 with the market share of 66.3%. Throughout the forecast period, the segment is expected to remain dominant. The expansion of the category is being aided by the rising demand for bakery goods such as cakes, pastries, bread, and muffins. The market demand for pastries, cakes, and muffins is being boosted by the vast selection of flavors available. Also, because they eliminate the need to purchase and store multiple ingredients, prepared flour mixes can be an affordable choice for commercial bakeries. They can also prevent waste by supplying the exact amount of components required for each dish.
Throughout the projected period, the bread mix category is expected to grow at a CAGR of 8.7% over the forecast period. Customers who want to bake bread at home but don't want to deal with measuring and combining every ingredient can benefit from bread mixes. This is especially helpful for people who might not have any prior experience baking bread or who might not have access to a pantry that is completely stocked. Additionally, a variety of bread types, such as white, whole wheat, sourdough, and gluten-free options, can be provided by bread mixes. Customers may now discover and experiment with several bread varieties because of prepared flour mixes.
| Attribute | Description |
|---|---|
| Market Size | Revenue (USD Billion) |
| Market size value in 2022 | USD 24.6 Billion |
| Market size value in 2032 | USD 50.2 Billion |
| CAGR (2023 to 2032) | 7.4% |
| Historical data | 2019-2021 |
| Base Year | 2022 |
| Forecast | 2023-2032 |
| Regional Segments | The regions analyzed for the market are Asia Pacific, Europe, South America, North America, and Middle East & Africa. Furthermore, the regions are further analyzed at the country level. |
| Segments | End-Use, Product |
As per The Brainy Insights, the size of the prepared flour mixes market was valued at USD 24.6 billion in 2022 to USD 50.2 billion by 2032.
The global prepared flour mixes market is growing at a CAGR of 7.4% during the forecast period 2023-2032.
The North American region emerged as the largest market for the prepared flour mixes.
The rise in demand from household consumers will influence the market's growth.
1. Introduction
1.1. Objectives of the Study
1.2. Market Definition
1.3. Research Scope
1.4. Currency
1.5. Key Target Audience
2. Research Methodology and Assumptions
3. Executive Summary
4. Premium Insights
4.1. Porter’s Five Forces Analysis
4.2. Value Chain Analysis
4.3. Top Investment Pockets
4.3.1. Market Attractiveness Analysis by End-Use
4.3.2. Market Attractiveness Analysis by Product
4.3.3. Market Attractiveness Analysis by Region
4.4. Industry Trends
5. Market Dynamics
5.1. Market Evaluation
5.2. Drivers
5.2.1. Rise in demand from household consumers
5.3. Restraints
5.3.1. Quality concerns
5.4. Opportunities
5.4.1. Rise in demand from developing countries
6. Global Prepared Flour Mixes Market Analysis and Forecast, By End-Use
6.1. Segment Overview
6.2. Bakery Shop
6.3. Household
6.4. Food Processing Industry
7. Global Prepared Flour Mixes Market Analysis and Forecast, By Product
7.1. Segment Overview
7.2. Pastry Mix
7.3. Batter Mix
7.4. Bread Mix
8. Global Prepared Flour Mixes Market Analysis and Forecast, By Regional Analysis
8.1. Segment Overview
8.2. North America
8.2.1. U.S.
8.2.2. Canada
8.2.3. Mexico
8.3. Europe
8.3.1. Germany
8.3.2. France
8.3.3. U.K.
8.3.4. Italy
8.3.5. Spain
8.4. Asia-Pacific
8.4.1. Japan
8.4.2. China
8.4.3. India
8.5. South America
8.5.1. Brazil
8.6. Middle East and Africa
8.6.1. UAE
8.6.2. South Africa
9. Global Prepared Flour Mixes Market-Competitive Landscape
9.1. Overview
9.2. Market Share of Key Players in the Prepared Flour Mixes Market
9.2.1. Global Company Market Share
9.2.2. North America Company Market Share
9.2.3. Europe Company Market Share
9.2.4. APAC Company Market Share
9.3. Competitive Situations and Trends
9.3.1. Product Launches and Developments
9.3.2. Partnerships, Collaborations, and Agreements
9.3.3. Mergers & Acquisitions
9.3.4. Expansions
10. Company Profiles
10.1. Allied Pinnacle Pty. Ltd.
10.1.1. Business Overview
10.1.2. Company Snapshot
10.1.3. Company Market Share Analysis
10.1.4. Company Product Portfolio
10.1.5. Recent Developments
10.1.6. SWOT Analysis
10.2. Intermix
10.2.1. Business Overview
10.2.2. Company Snapshot
10.2.3. Company Market Share Analysis
10.2.4. Company Product Portfolio
10.2.5. Recent Developments
10.2.6. SWOT Analysis
10.3. Rich Products Corp.
10.3.1. Business Overview
10.3.2. Company Snapshot
10.3.3. Company Market Share Analysis
10.3.4. Company Product Portfolio
10.3.5. Recent Developments
10.3.6. SWOT Analysis
10.4. Nisshin Seifun Group Inc.
10.4.1. Business Overview
10.4.2. Company Snapshot
10.4.3. Company Market Share Analysis
10.4.4. Company Product Portfolio
10.4.5. Recent Developments
10.4.6. SWOT Analysis
10.5. Yihai Kerry
10.5.1. Business Overview
10.5.2. Company Snapshot
10.5.3. Company Market Share Analysis
10.5.4. Company Product Portfolio
10.5.5. Recent Developments
10.5.6. SWOT Analysis
10.6. Nitto-fuji International Vietnam Co., Ltd.
10.6.1. Business Overview
10.6.2. Company Snapshot
10.6.3. Company Market Share Analysis
10.6.4. Company Product Portfolio
10.6.5. Recent Developments
10.6.6. SWOT Analysis
10.7. Pondan (PPMI)
10.7.1. Business Overview
10.7.2. Company Snapshot
10.7.3. Company Market Share Analysis
10.7.4. Company Product Portfolio
10.7.5. Recent Developments
10.7.6. SWOT Analysis
10.8. Interflour Group Pte. Ltd.
10.8.1. Business Overview
10.8.2. Company Snapshot
10.8.3. Company Market Share Analysis
10.8.4. Company Product Portfolio
10.8.5. Recent Developments
10.8.6. SWOT Analysis
10.9. ADM
10.9.1. Business Overview
10.9.2. Company Snapshot
10.9.3. Company Market Share Analysis
10.9.4. Company Product Portfolio
10.9.5. Recent Developments
10.9.6. SWOT Analysis
10.10. Lesaffre
10.10.1. Business Overview
10.10.2. Company Snapshot
10.10.3. Company Market Share Analysis
10.10.4. Company Product Portfolio
10.10.5. Recent Developments
10.10.6. SWOT Analysis
10.11. Bakels Group
10.11.1. Business Overview
10.11.2. Company Snapshot
10.11.3. Company Market Share Analysis
10.11.4. Company Product Portfolio
10.11.5. Recent Developments
10.11.6. SWOT Analysis
10.12. PURATOS
10.12.1. Business Overview
10.12.2. Company Snapshot
10.12.3. Company Market Share Analysis
10.12.4. Company Product Portfolio
10.12.5. Recent Developments
10.12.6. SWOT Analysis
10.13. Associated British Foods plc
10.13.1. Business Overview
10.13.2. Company Snapshot
10.13.3. Company Market Share Analysis
10.13.4. Company Product Portfolio
10.13.5. Recent Developments
10.13.6. SWOT Analysis
List of Table
1. Global Prepared Flour Mixes Market, By End-Use, 2019-2032 (USD Billion)
2. Global Bakery Shop Prepared Flour Mixes Market, By Region, 2019-2032 (USD Billion)
3. Global Household Prepared Flour Mixes Market, By Region, 2019-2032 (USD Billion)
4. Global Food Processing Industry Prepared Flour Mixes Market, By Region, 2019-2032 (USD Billion)
5. Global Prepared Flour Mixes Market, By Product, 2019-2032 (USD Billion)
6. Global Pastry Mix Prepared Flour Mixes Market, By Region, 2019-2032 (USD Billion)
7. Global Batter Mix Prepared Flour Mixes Market, By Region, 2019-2032 (USD Billion)
8. Global Bread Mix Prepared Flour Mixes Market, By Region, 2019-2032 (USD Billion)
9. Global Prepared Flour Mixes Market, By Region, 2019-2032 (USD Billion)
10. North America Prepared Flour Mixes Market, By End-Use, 2019-2032 (USD Billion)
11. North America Prepared Flour Mixes Market, By Product, 2019-2032 (USD Billion)
12. U.S. Prepared Flour Mixes Market, By End-Use, 2019-2032 (USD Billion)
13. U.S. Prepared Flour Mixes Market, By Product, 2019-2032 (USD Billion)
14. Canada Prepared Flour Mixes Market, By End-Use, 2019-2032 (USD Billion)
15. Canada Prepared Flour Mixes Market, By Product, 2019-2032 (USD Billion)
16. Mexico Prepared Flour Mixes Market, By End-Use, 2019-2032 (USD Billion)
17. Mexico Prepared Flour Mixes Market, By Product, 2019-2032 (USD Billion)
18. Europe Prepared Flour Mixes Market, By End-Use, 2019-2032 (USD Billion)
19. Europe Prepared Flour Mixes Market, By Product, 2019-2032 (USD Billion)
20. Germany Prepared Flour Mixes Market, By End-Use, 2019-2032 (USD Billion)
21. Germany Prepared Flour Mixes Market, By Product, 2019-2032 (USD Billion)
22. France Prepared Flour Mixes Market, By End-Use, 2019-2032 (USD Billion)
23. France Prepared Flour Mixes Market, By Product, 2019-2032 (USD Billion)
24. U.K. Prepared Flour Mixes Market, By End-Use, 2019-2032 (USD Billion)
25. U.K. Prepared Flour Mixes Market, By Product, 2019-2032 (USD Billion)
26. Italy Prepared Flour Mixes Market, By End-Use, 2019-2032 (USD Billion)
27. Italy Prepared Flour Mixes Market, By Product, 2019-2032 (USD Billion)
28. Spain Prepared Flour Mixes Market, By End-Use, 2019-2032 (USD Billion)
29. Spain Prepared Flour Mixes Market, By Product, 2019-2032 (USD Billion)
30. Asia Pacific Prepared Flour Mixes Market, By End-Use, 2019-2032 (USD Billion)
31. Asia Pacific Prepared Flour Mixes Market, By Product, 2019-2032 (USD Billion)
32. Japan Prepared Flour Mixes Market, By End-Use, 2019-2032 (USD Billion)
33. Japan Prepared Flour Mixes Market, By Product, 2019-2032 (USD Billion)
34. China Prepared Flour Mixes Market, By End-Use, 2019-2032 (USD Billion)
35. China Prepared Flour Mixes Market, By Product, 2019-2032 (USD Billion)
36. India Prepared Flour Mixes Market, By End-Use, 2019-2032 (USD Billion)
37. India Prepared Flour Mixes Market, By Product, 2019-2032 (USD Billion)
38. South America Prepared Flour Mixes Market, By End-Use, 2019-2032 (USD Billion)
39. South America Prepared Flour Mixes Market, By Product, 2019-2032 (USD Billion)
40. Brazil Prepared Flour Mixes Market, By End-Use, 2019-2032 (USD Billion)
41. Brazil Prepared Flour Mixes Market, By Product, 2019-2032 (USD Billion)
42. Middle East and Africa Prepared Flour Mixes Market, By End-Use, 2019-2032 (USD Billion)
43. Middle East and Africa Prepared Flour Mixes Market, By Product, 2019-2032 (USD Billion)
44. UAE Prepared Flour Mixes Market, By End-Use, 2019-2032 (USD Billion)
45. UAE Prepared Flour Mixes Market, By Product, 2019-2032 (USD Billion)
46. South Africa Prepared Flour Mixes Market, By End-Use, 2019-2032 (USD Billion)
47. South Africa Prepared Flour Mixes Market, By Product, 2019-2032 (USD Billion)
List of Figures
1. Global Prepared Flour Mixes Market Segmentation
2. Prepared Flour Mixes Market: Research Methodology
3. Market Size Estimation Methodology: Bottom-Up Approach
4. Market Size Estimation Methodology: Top-Down Approach
5. Data Triangulation
6. Porter’s Five Forces Analysis
7. Value Chain Analysis
8. Global Prepared Flour Mixes Market Attractiveness Analysis by End-Use
9. Global Prepared Flour Mixes Market Attractiveness Analysis by Product
10. Global Prepared Flour Mixes Market Attractiveness Analysis by Region
11. Global Prepared Flour Mixes Market: Dynamics
12. Global Prepared Flour Mixes Market Share by End-Use (2022 & 2032)
13. Global Prepared Flour Mixes Market Share by Product (2022 & 2032)
14. Global Prepared Flour Mixes Market Share by Regions (2022 & 2032)
15. Global Prepared Flour Mixes Market Share by Company (2022)
This study forecasts revenue at global, regional, and country levels from 2019 to 2032. The Brainy Insights has segmented the global prepared flour mixes market based on below-mentioned segments:
Global Prepared Flour Mixes Market by End-Use:
Global Prepared Flour Mixes Market by Product:
Global Prepared Flour Mixes Market by Region:
Research has its special purpose to undertake marketing efficiently. In this competitive scenario, businesses need information across all industry verticals; the information about customer wants, market demand, competition, industry trends, distribution channels etc. This information needs to be updated regularly because businesses operate in a dynamic environment. Our organization, The Brainy Insights incorporates scientific and systematic research procedures in order to get proper market insights and industry analysis for overall business success. The analysis consists of studying the market from a miniscule level wherein we implement statistical tools which helps us in examining the data with accuracy and precision.
Our research reports feature both; quantitative and qualitative aspects for any market. Qualitative information for any market research process are fundamental because they reveal the customer needs and wants, usage and consumption for any product/service related to a specific industry. This in turn aids the marketers/investors in knowing certain perceptions of the customers. Qualitative research can enlighten about the different product concepts and designs along with unique service offering that in turn, helps define marketing problems and generate opportunities. On the other hand, quantitative research engages with the data collection process through interviews, e-mail interactions, surveys and pilot studies. Quantitative aspects for the market research are useful to validate the hypotheses generated during qualitative research method, explore empirical patterns in the data with the help of statistical tools, and finally make the market estimations.
The Brainy Insights offers comprehensive research and analysis, based on a wide assortment of factual insights gained through interviews with CXOs and global experts and secondary data from reliable sources. Our analysts and industry specialist assume vital roles in building up statistical tools and analysis models, which are used to analyse the data and arrive at accurate insights with exceedingly informative research discoveries. The data provided by our organization have proven precious to a diverse range of companies, facilitating them to address issues such as determining which products/services are the most appealing, whether or not customers use the product in the manner anticipated, the purchasing intentions of the market and many others.
Our research methodology encompasses an idyllic combination of primary and secondary initiatives. Key phases involved in this process are listed below:

The phase involves the gathering and collecting of market data and its related information with the help of different sources & research procedures.

The data procurement stage involves in data gathering and collecting through various data sources.
This stage involves in extensive research. These data sources includes:
Purchased Database: Purchased databases play a crucial role in estimating the market sizes irrespective of the domain. Our purchased database includes:
Primary Research: The Brainy Insights interacts with leading companies and experts of the concerned domain to develop the analyst team’s market understanding and expertise. It improves and substantiates every single data presented in the market reports. Primary research mainly involves in telephonic interviews, E-mail interactions and face-to-face interviews with the raw material providers, manufacturers/producers, distributors, & independent consultants. The interviews that we conduct provides valuable data on market size and industry growth trends prevailing in the market. Our organization also conducts surveys with the various industry experts in order to gain overall insights of the industry/market. For instance, in healthcare industry we conduct surveys with the pharmacists, doctors, surgeons and nurses in order to gain insights and key information of a medical product/device/equipment which the customers are going to usage. Surveys are conducted in the form of questionnaire designed by our own analyst team. Surveys plays an important role in primary research because surveys helps us to identify the key target audiences of the market. Additionally, surveys helps to identify the key target audience engaged with the market. Our survey team conducts the survey by targeting the key audience, thus gaining insights from them. Based on the perspectives of the customers, this information is utilized to formulate market strategies. Moreover, market surveys helps us to understand the current competitive situation of the industry. To be precise, our survey process typically involve with the 360 analysis of the market. This analytical process begins by identifying the prospective customers for a product or service related to the market/industry to obtain data on how a product/service could fit into customers’ lives.

Secondary Research: The secondary data sources includes information published by the on-profit organizations such as World bank, WHO, company fillings, investor presentations, annual reports, national government documents, statistical databases, blogs, articles, white papers and others. From the annual report, we analyse a company’s revenue to understand the key segment and market share of that organization in a particular region. We analyse the company websites and adopt the product mapping technique which is important for deriving the segment revenue. In the product mapping method, we select and categorize the products offered by the companies catering to domain specific market, deduce the product revenue for each of the companies so as to get overall estimation of the market size. We also source data and analyses trends based on information received from supply side and demand side intermediaries in the value chain. The supply side denotes the data gathered from supplier, distributor, wholesaler and the demand side illustrates the data gathered from the end customers for respective market domain.

The supply side for a domain specific market is analysed by:
The demand side for the market is estimated through:
In-house Library: Apart from these third-party sources, we have our in-house library of qualitative and quantitative information. Our in-house database includes market data for various industry and domains. These data are updated on regular basis as per the changing market scenario. Our library includes, historic databases, internal audit reports and archives.
Sometimes there are instances where there is no metadata or raw data available for any domain specific market. For those cases, we use our expertise to forecast and estimate the market size in order to generate comprehensive data sets. Our analyst team adopt a robust research technique in order to produce the estimates:
Data Synthesis: This stage involves the analysis & mapping of all the information obtained from the previous step. It also involves in scrutinizing the data for any discrepancy observed while data gathering related to the market. The data is collected with consideration to the heterogeneity of sources. Robust scientific techniques are in place for synthesizing disparate data sets and provide the essential contextual information that can orient market strategies. The Brainy Insights has extensive experience in data synthesis where the data passes through various stages:


Market Deduction & Formulation: The final stage comprises of assigning data points at appropriate market spaces so as to deduce feasible conclusions. Analyst perspective & subject matter expert based holistic form of market sizing coupled with industry analysis also plays a crucial role in this stage.
This stage involves in finalization of the market size and numbers that we have collected from data integration step. With data interpolation, it is made sure that there is no gap in the market data. Successful trend analysis is done by our analysts using extrapolation techniques, which provide the best possible forecasts for the market.
Data Validation & Market Feedback: Validation is the most important step in the process. Validation & re-validation via an intricately designed process helps us finalize data-points to be used for final calculations.

The Brainy Insights interacts with leading companies and experts of the concerned domain to develop the analyst team’s market understanding and expertise. It improves and substantiates every single data presented in the market reports. The data validation interview and discussion panels are typically composed of the most experienced industry members. The participants include, however, are not limited to:
Moreover, we always validate our data and findings through primary respondents from all the major regions we are working on.


Free Customization
Fortune 500 Clients
Free Yearly Update On Purchase Of Multi/Corporate License
Companies Served Till Date