- +1-315-215-1633
- sales@thebrainyinsights.com

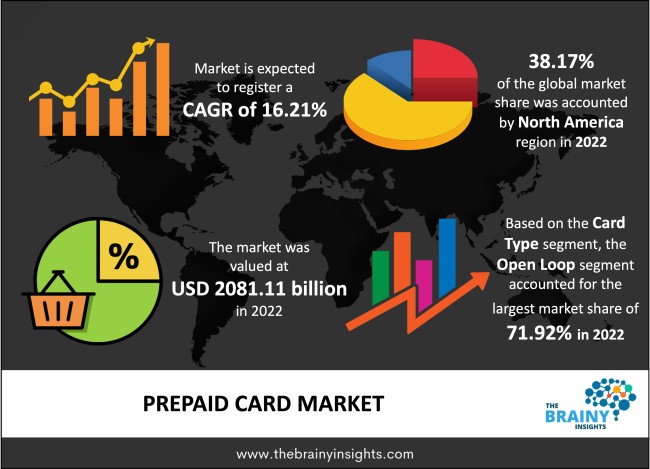
The global prepaid card market was valued at USD 2081.11 Billion in 2022 and grew at a CAGR of 16.21% from 2023 to 2032. The market is expected to reach USD 9348.24 Billion by 2032. The increasing demand for prepaid cards can be attributed to the growth of the e-commerce and retail industry. These prepaid cards enable the consumer to make cashless transactions.
A prepaid card is a card that can be used to make purchases with the money that the consumers pre-load onto the prepaid card account. A prepaid card is not linked to a bank's checking account or a credit union's share draft account. The card can be used to spend up to the pre-loaded amount. Prepaid cards are sometimes known as prepaid debit cards or stored-value cards. Prepaid cards are available in a variety of stores and online. After the amount has been exhausted or used, the card owner can reload it with money. Reloadable prepaid cards include several ways for depositing monies into the card's balance, including direct deposit and bank-to-bank transfer.
Get an overview of this study by requesting a free sample
Increasing use of prepaid cards: Prepaid cards are a reasonably straightforward way to pay for purchases without opening a credit line or opening a bank account. Prepaid cards can be a useful alternative for parents who wish to offer their children spending money without handing them cash, which they can easily lose and never get back. As overspending on debit or credit cards may be financially costly and harm their credit, a prepaid card can be a safer alternative for some consumers. The other types of plastic, such as debit or credit cards, can make it easy to spend more than the client has budgeted for and impose overdraft penalties. By denying purchases exceeding the client’s account balance, a prepaid card pushes them to stay within a budget.
High fees: Cardholders may be subject to various costs, such as activation fees, ATM withdrawal fees, transaction fees, monthly fees, reloading fees, or inactivity fees. These fees limit the use of prepaid cards among the end consumers compared to debit and credit cards.
Rising number of cashless transactions: With abundant innovation in the market, cashless transactions have expanded tenfold. Many customers increasingly prefer to buy from internet retailers rather than physical stores. Consumers can now make practically all transactions digitally, not only with shops. Cash usage has decreased as a result of the shift to cashless transactions. Covid-19 fueled the market for digital transactions. People were no longer making cashless payments for convenience; they were doing it for safety. Consumers turned to digital payments due to the pandemic, and their behaviour has been permanently altered.
The regions analyzed for the market include North America, Europe, South America, Asia Pacific, the Middle East, and Africa. North America emerged as the most significant prepaid card market, with a 38.17% market revenue share in 2022.
North America region will account for the largest market share with revenue growth. Nations such as the U.S., Canada and Mexico have a tremendous demand for prepaid cards due to the growth of the e-commerce and retail industries. The favourable government regulations are promoting the use of prepaid cards, especially in consumers of younger demographics.
North America Region Prepaid Card Market Share in 2022 - 38.17%
www.thebrainyinsights.com
Check the geographical analysis of this market by requesting a free sample
The card type segment is divided into closed loop and open loop. The open loop segment dominated the market, with a share of around 71.92% in 2022. An open-loop card is a charge card that can be used anywhere a particular brand of card is accepted. It is typically imprinted with the card brand or network logo, such as MasterCard, Visa, American Express, etc.
The offering segment is divided into gift cards, general purpose cards, incentive cards, disbursement cards and others. The general-purpose card segment dominated the market, with a share of around 48.95% in 2022. Prepaid cards are specially used for general purposes by budget-conscious consumers. People mostly use it for making general day-to-day transactions.
The end-users segment is divided into financial institutions, retail, corporate, and government. The retail segment dominated the market, with a share of around 49.11% in 2022. Prepaid cards are used mostly in retail channels such as convenience stores, hypermarkets, and supermarkets. Most consumers budget their retail purchases and thus use prepaid cards in such stores.
| Attribute | Description |
|---|---|
| Market Size | Revenue (USD Billion) |
| Market size value in 2022 | USD 2081.11 Billion |
| Market size value in 2032 | USD 9348.24 Billion |
| CAGR (2023 to 2032) | 16.21% |
| Historical data | 2019-2021 |
| Base Year | 2022 |
| Forecast | 2023-2032 |
| Region | The regions analyzed for the market are Asia Pacific, Europe, South America, North America, and Middle East & Africa. Furthermore, the regions are further analyzed at the country level. |
| Segments | Card Type, Offering and End-users |
As per The Brainy Insights, the size of the prepaid card market was valued USD 2081.11 billion in 2022 to USD 9348.24 billion by 2032.
Global prepaid card market is growing at a CAGR of 16.21% during the forecast period 2023-2032.
North America region emerged as the largest market for the prepaid card.
The market's growth will be influenced by the rising use of prepaid card.
The high fees can hamper the market growth.
The rising number for cashless transactions is providing huge opportunities to the market.
1. Introduction
1.1. Objectives of the Study
1.2. Market Definition
1.3. Research Scope
1.4. Currency
1.5. Key Target Audience
2. Research Methodology and Assumptions
3. Executive Summary
4. Premium Insights
4.1. Porter’s Five Forces Analysis
4.2. Value Chain Analysis
4.3. Top Investment Pockets
4.3.1. Market Attractiveness Analysis by Card Type
4.3.2. Market Attractiveness Analysis by Offering
4.3.3. Market Attractiveness Analysis by End-users
4.3.4. Market Attractiveness Analysis by Region
4.4. Industry Trends
5. Market Dynamics
5.1. Market Evaluation
5.2. Drivers
5.2.1. Increasing use of prepaid cards
5.3. Restraints
5.3.1. High fees
5.4. Opportunities
5.4.1. Growing number of digital transactions
5.5. Challenges
5.5.1. Lack of standardization
6. Global Prepaid Card Market Analysis and Forecast, By Card Type
6.1. Segment Overview
6.2. Closed Loop
6.3. Open Loop
7. Global Prepaid Card Market Analysis and Forecast, By Offering
7.1. Segment Overview
7.2. Gift Card
7.3. General Purpose Card
7.4. Incentive Card
7.5. Disbursement Card
7.6. Other
8. Global Prepaid Card Market Analysis and Forecast, By End-users
8.1. Segment Overview
8.2. Financial Institutions
8.3. Retail
8.4. Corporate
8.5. Government
9. Global Prepaid Card Market Analysis and Forecast, By Regional Analysis
9.1. Segment Overview
9.2. North America
9.2.1. U.S.
9.2.2. Canada
9.2.3. Mexico
9.3. Europe
9.3.1. Germany
9.3.2. France
9.3.3. U.K.
9.3.4. Italy
9.3.5. Spain
9.4. Asia-Pacific
9.4.1. Japan
9.4.2. China
9.4.3. India
9.5. South America
9.5.1. Brazil
9.6. Middle East and Africa
9.6.1. UAE
9.6.2. South Africa
10. Global Prepaid Card Market-Competitive Landscape
10.1. Overview
10.2. Market Share of Key Players in the Prepaid Card Market
10.2.1. Global Company Market Share
10.2.2. North America Company Market Share
10.2.3. Europe Company Market Share
10.2.4. APAC Company Market Share
10.3. Competitive Situations and Trends
10.3.1. Product Launches and Developments
10.3.2. Partnerships, Collaborations, and Agreements
10.3.3. Mergers & Acquisitions
10.3.4. Expansions
11. Company Profiles
11.1. American Express Company
11.1.1. Business Overview
11.1.2. Company Snapshot
11.1.3. Company Market Share Analysis
11.1.4. Company Product Portfolio
11.1.5. Recent Developments
11.1.6. SWOT Analysis
11.2. Visa, Inc.
11.2.1. Business Overview
11.2.2. Company Snapshot
11.2.3. Company Market Share Analysis
11.2.4. Company Product Portfolio
11.2.5. Recent Developments
11.2.6. SWOT Analysis
11.3. Kaiku Finance, LLC
11.3.1. Business Overview
11.3.2. Company Snapshot
11.3.3. Company Market Share Analysis
11.3.4. Company Product Portfolio
11.3.5. Recent Developments
11.3.6. SWOT Analysis
11.4. MasterCard Inc.
11.4.1. Business Overview
11.4.2. Company Snapshot
11.4.3. Company Market Share Analysis
11.4.4. Company Product Portfolio
11.4.5. Recent Developments
11.4.6. SWOT Analysis
11.5. Mango Financial, Inc.
11.5.1. Business Overview
11.5.2. Company Snapshot
11.5.3. Company Market Share Analysis
11.5.4. Company Product Portfolio
11.5.5. Recent Developments
11.5.6. SWOT Analysis
11.6. Citigroup
11.6.1. Business Overview
11.6.2. Company Snapshot
11.6.3. Company Market Share Analysis
11.6.4. Company Product Portfolio
11.6.5. Recent Developments
11.6.6. SWOT Analysis
11.7. Total System Services, Inc.
11.7.1. Business Overview
11.7.2. Company Snapshot
11.7.3. Company Market Share Analysis
11.7.4. Company Product Portfolio
11.7.5. Recent Developments
11.7.6. SWOT Analysis
11.8. BVA Compass Bancshares, Inc.
11.8.1. Business Overview
11.8.2. Company Snapshot
11.8.3. Company Market Share Analysis
11.8.4. Company Product Portfolio
11.8.5. Recent Developments
11.8.6. SWOT Analysis
11.9. The PNC Financial Services Group, Inc.
11.9.1. Business Overview
11.9.2. Company Snapshot
11.9.3. Company Market Share Analysis
11.9.4. Company Product Portfolio
11.9.5. Recent Developments
11.9.6. SWOT Analysis
11.10. H&R Block Inc.
11.10.1. Business Overview
11.10.2. Company Snapshot
11.10.3. Company Market Share Analysis
11.10.4. Company Product Portfolio
11.10.5. Recent Developments
11.10.6. SWOT Analysis
11.11. Green Dot Corporation
11.11.1. Business Overview
11.11.2. Company Snapshot
11.11.3. Company Market Share Analysis
11.11.4. Company Product Portfolio
11.11.5. Recent Developments
11.11.6. SWOT Analysis
11.12. JPMorgan Chase & Co.
11.12.1. Business Overview
11.12.2. Company Snapshot
11.12.3. Company Market Share Analysis
11.12.4. Company Product Portfolio
11.12.5. Recent Developments
11.12.6. SWOT Analysis
11.13. PayPal Holdings, Inc.
11.13.1. Business Overview
11.13.2. Company Snapshot
11.13.3. Company Market Share Analysis
11.13.4. Company Product Portfolio
11.13.5. Recent Developments
11.13.6. SWOT Analysis
11.14. NetSpend Holdings, Inc.
11.14.1. Business Overview
11.14.2. Company Snapshot
11.14.3. Company Market Share Analysis
11.14.4. Company Product Portfolio
11.14.5. Recent Developments
11.14.6. SWOT Analysis
11.15. UniRush, LLC
11.15.1. Business Overview
11.15.2. Company Snapshot
11.15.3. Company Market Share Analysis
11.15.4. Company Product Portfolio
11.15.5. Recent Developments
11.15.6. SWOT Analysis
11.15.7. Recent Developments
List of Table
1. Global Prepaid Card Market, By Card Type, 2019-2032 (USD Billion)
2. Global Closed Loop, Prepaid Card Market, By Region, 2019-2032 (USD Billion)
3. Global Open Loop, Prepaid Card Market, By Region, 2019-2032 (USD Billion)
4. Global Prepaid Card Market, By Offering, 2019-2032 (USD Billion)
5. Global Gift Card, Prepaid Card Market, By Region, 2019-2032 (USD Billion)
6. Global General Purpose Card, Prepaid Card Market, By Region, 2019-2032 (USD Billion)
7. Global Incentive Card, Prepaid Card Market, By Region, 2019-2032 (USD Billion)
8. Global Disbursement Card, Prepaid Card Market, By Region, 2019-2032 (USD Billion)
9. Global Others, Prepaid Card Market, By Region, 2019-2032 (USD Billion)
10. Global Prepaid Card Market, By End-users, 2019-2032 (USD Billion)
11. Global Financial Institutions, Prepaid Card Market, By Region, 2019-2032 (USD Billion)
12. Global Retail, Prepaid Card Market, By Region, 2019-2032 (USD Billion)
13. Global Corporate, Prepaid Card Market, By Region, 2019-2032 (USD Billion)
14. Global Government, Prepaid Card Market, By Region, 2019-2032 (USD Billion)
15. Global Prepaid Card Market, By Region, 2019-2032 (USD Billion)
16. North America Prepaid Card Market, By Card Type, 2019-2032 (USD Billion)
17. North America Prepaid Card Market, By Offering, 2019-2032 (USD Billion)
18. North America Prepaid Card Market, By End-users, 2019-2032 (USD Billion)
19. U.S. Prepaid Card Market, By Card Type, 2019-2032 (USD Billion)
20. U.S. Prepaid Card Market, By Offering, 2019-2032 (USD Billion)
21. U.S. Prepaid Card Market, By End-users, 2019-2032 (USD Billion)
22. Canada Prepaid Card Market, By Card Type, 2019-2032 (USD Billion)
23. Canada Prepaid Card Market, By Offering, 2019-2032 (USD Billion)
24. Canada Prepaid Card Market, By End-users, 2019-2032 (USD Billion)
25. Mexico Prepaid Card Market, By Card Type, 2019-2032 (USD Billion)
26. Mexico Prepaid Card Market, By Offering, 2019-2032 (USD Billion)
27. Mexico Prepaid Card Market, By End-users, 2019-2032 (USD Billion)
28. Europe Prepaid Card Market, By Card Type, 2019-2032 (USD Billion)
29. Europe Prepaid Card Market, By Offering, 2019-2032 (USD Billion)
30. Europe Prepaid Card Market, By End-users, 2019-2032 (USD Billion)
31. Germany Prepaid Card Market, By Card Type, 2019-2032 (USD Billion)
32. Germany Prepaid Card Market, By Offering, 2019-2032 (USD Billion)
33. Germany Prepaid Card Market, By End-users, 2019-2032 (USD Billion)
34. France Prepaid Card Market, By Card Type, 2019-2032 (USD Billion)
35. France Prepaid Card Market, By Offering, 2019-2032 (USD Billion)
36. France Prepaid Card Market, By End-users, 2019-2032 (USD Billion)
37. U.K. Prepaid Card Market, By Card Type, 2019-2032 (USD Billion)
38. U.K. Prepaid Card Market, By Offering, 2019-2032 (USD Billion)
39. U.K. Prepaid Card Market, By End-users, 2019-2032 (USD Billion)
40. Italy Prepaid Card Market, By Card Type, 2019-2032 (USD Billion)
41. Italy Prepaid Card Market, By Offering, 2019-2032 (USD Billion)
42. Italy Prepaid Card Market, By End-users, 2019-2032 (USD Billion)
43. Spain Prepaid Card Market, By Card Type, 2019-2032 (USD Billion)
44. Spain Prepaid Card Market, By Offering, 2019-2032 (USD Billion)
45. Spain Prepaid Card Market, By End-users, 2019-2032 (USD Billion)
46. Asia Pacific Prepaid Card Market, By Card Type, 2019-2032 (USD Billion)
47. Asia Pacific Prepaid Card Market, By Offering, 2019-2032 (USD Billion)
48. Asia Pacific Prepaid Card Market, By End-users, 2019-2032 (USD Billion)
49. Japan Prepaid Card Market, By Card Type, 2019-2032 (USD Billion)
50. Japan Prepaid Card Market, By Offering, 2019-2032 (USD Billion)
51. Japan Prepaid Card Market, By End-users, 2019-2032 (USD Billion)
52. China Prepaid Card Market, By Card Type, 2019-2032 (USD Billion)
53. China Prepaid Card Market, By Offering, 2019-2032 (USD Billion)
54. China Prepaid Card Market, By End-users, 2019-2032 (USD Billion)
55. India Prepaid Card Market, By Card Type, 2019-2032 (USD Billion)
56. India Prepaid Card Market, By Offering, 2019-2032 (USD Billion)
57. India Prepaid Card Market, By End-users, 2019-2032 (USD Billion)
58. South America Prepaid Card Market, By Card Type, 2019-2032 (USD Billion)
59. South America Prepaid Card Market, By Offering, 2019-2032 (USD Billion)
60. South America Prepaid Card Market, By End-users, 2019-2032 (USD Billion)
61. Brazil Prepaid Card Market, By Card Type, 2019-2032 (USD Billion)
62. Brazil Prepaid Card Market, By Offering, 2019-2032 (USD Billion)
63. Brazil Prepaid Card Market, By End-users, 2019-2032 (USD Billion)
64. Middle East and Africa Prepaid Card Market, By Card Type, 2019-2032 (USD Billion)
65. Middle East and Africa Prepaid Card Market, By Offering, 2019-2032 (USD Billion)
66. Middle East and Africa Prepaid Card Market, By End-users, 2019-2032 (USD Billion)
67. UAE Prepaid Card Market, By Card Type, 2019-2032 (USD Billion)
68. UAE Prepaid Card Market, By Offering, 2019-2032 (USD Billion)
69. UAE Prepaid Card Market, By End-users, 2019-2032 (USD Billion)
70. South Africa Prepaid Card Market, By Card Type, 2019-2032 (USD Billion)
71. South Africa Prepaid Card Market, By Offering, 2019-2032 (USD Billion)
72. South Africa Prepaid Card Market, By End-users, 2019-2032 (USD Billion)
List of Figures
1. Global Prepaid Card Market Segmentation
2. Prepaid Card Market: Research Methodology
3. Market Size Estimation Methodology: Bottom-Up Approach
4. Market Size Estimation Methodology: Top-Down Approach
5. Data Triangulation
6. Porter’s Five Forces Analysis
7. Value Chain Analysis
8. Global Prepaid Card Market Attractiveness Analysis by Card Type
9. Global Prepaid Card Market Attractiveness Analysis by Offering
10. Global Prepaid Card Market Attractiveness Analysis by End-users
11. Global Prepaid Card Market Attractiveness Analysis by Region
12. Global Prepaid Card Market: Dynamics
13. Global Prepaid Card Market Share by Card Type (2022 & 2032)
14. Global Prepaid Card Market Share by Offering (2022 & 2032)
15. Global Prepaid Card Market Share by End-users (2022 & 2032)
16. Global Prepaid Card Market Share by Regions (2022 & 2032)
17. Global Prepaid Card Market Share by Company (2022)
This study forecasts revenue at global, regional, and country levels from 2019 to 2032. The Brainy Insights has segmented the global prepaid card market based on below mentioned segments:
Global Prepaid Card Market by Card Type:
Global Prepaid Card Market by Offering:
Global Prepaid Card Market by End-users:
Global Prepaid Card Market by Region:
Research has its special purpose to undertake marketing efficiently. In this competitive scenario, businesses need information across all industry verticals; the information about customer wants, market demand, competition, industry trends, distribution channels etc. This information needs to be updated regularly because businesses operate in a dynamic environment. Our organization, The Brainy Insights incorporates scientific and systematic research procedures in order to get proper market insights and industry analysis for overall business success. The analysis consists of studying the market from a miniscule level wherein we implement statistical tools which helps us in examining the data with accuracy and precision.
Our research reports feature both; quantitative and qualitative aspects for any market. Qualitative information for any market research process are fundamental because they reveal the customer needs and wants, usage and consumption for any product/service related to a specific industry. This in turn aids the marketers/investors in knowing certain perceptions of the customers. Qualitative research can enlighten about the different product concepts and designs along with unique service offering that in turn, helps define marketing problems and generate opportunities. On the other hand, quantitative research engages with the data collection process through interviews, e-mail interactions, surveys and pilot studies. Quantitative aspects for the market research are useful to validate the hypotheses generated during qualitative research method, explore empirical patterns in the data with the help of statistical tools, and finally make the market estimations.
The Brainy Insights offers comprehensive research and analysis, based on a wide assortment of factual insights gained through interviews with CXOs and global experts and secondary data from reliable sources. Our analysts and industry specialist assume vital roles in building up statistical tools and analysis models, which are used to analyse the data and arrive at accurate insights with exceedingly informative research discoveries. The data provided by our organization have proven precious to a diverse range of companies, facilitating them to address issues such as determining which products/services are the most appealing, whether or not customers use the product in the manner anticipated, the purchasing intentions of the market and many others.
Our research methodology encompasses an idyllic combination of primary and secondary initiatives. Key phases involved in this process are listed below:

The phase involves the gathering and collecting of market data and its related information with the help of different sources & research procedures.

The data procurement stage involves in data gathering and collecting through various data sources.
This stage involves in extensive research. These data sources includes:
Purchased Database: Purchased databases play a crucial role in estimating the market sizes irrespective of the domain. Our purchased database includes:
Primary Research: The Brainy Insights interacts with leading companies and experts of the concerned domain to develop the analyst team’s market understanding and expertise. It improves and substantiates every single data presented in the market reports. Primary research mainly involves in telephonic interviews, E-mail interactions and face-to-face interviews with the raw material providers, manufacturers/producers, distributors, & independent consultants. The interviews that we conduct provides valuable data on market size and industry growth trends prevailing in the market. Our organization also conducts surveys with the various industry experts in order to gain overall insights of the industry/market. For instance, in healthcare industry we conduct surveys with the pharmacists, doctors, surgeons and nurses in order to gain insights and key information of a medical product/device/equipment which the customers are going to usage. Surveys are conducted in the form of questionnaire designed by our own analyst team. Surveys plays an important role in primary research because surveys helps us to identify the key target audiences of the market. Additionally, surveys helps to identify the key target audience engaged with the market. Our survey team conducts the survey by targeting the key audience, thus gaining insights from them. Based on the perspectives of the customers, this information is utilized to formulate market strategies. Moreover, market surveys helps us to understand the current competitive situation of the industry. To be precise, our survey process typically involve with the 360 analysis of the market. This analytical process begins by identifying the prospective customers for a product or service related to the market/industry to obtain data on how a product/service could fit into customers’ lives.

Secondary Research: The secondary data sources includes information published by the on-profit organizations such as World bank, WHO, company fillings, investor presentations, annual reports, national government documents, statistical databases, blogs, articles, white papers and others. From the annual report, we analyse a company’s revenue to understand the key segment and market share of that organization in a particular region. We analyse the company websites and adopt the product mapping technique which is important for deriving the segment revenue. In the product mapping method, we select and categorize the products offered by the companies catering to domain specific market, deduce the product revenue for each of the companies so as to get overall estimation of the market size. We also source data and analyses trends based on information received from supply side and demand side intermediaries in the value chain. The supply side denotes the data gathered from supplier, distributor, wholesaler and the demand side illustrates the data gathered from the end customers for respective market domain.

The supply side for a domain specific market is analysed by:
The demand side for the market is estimated through:
In-house Library: Apart from these third-party sources, we have our in-house library of qualitative and quantitative information. Our in-house database includes market data for various industry and domains. These data are updated on regular basis as per the changing market scenario. Our library includes, historic databases, internal audit reports and archives.
Sometimes there are instances where there is no metadata or raw data available for any domain specific market. For those cases, we use our expertise to forecast and estimate the market size in order to generate comprehensive data sets. Our analyst team adopt a robust research technique in order to produce the estimates:
Data Synthesis: This stage involves the analysis & mapping of all the information obtained from the previous step. It also involves in scrutinizing the data for any discrepancy observed while data gathering related to the market. The data is collected with consideration to the heterogeneity of sources. Robust scientific techniques are in place for synthesizing disparate data sets and provide the essential contextual information that can orient market strategies. The Brainy Insights has extensive experience in data synthesis where the data passes through various stages:


Market Deduction & Formulation: The final stage comprises of assigning data points at appropriate market spaces so as to deduce feasible conclusions. Analyst perspective & subject matter expert based holistic form of market sizing coupled with industry analysis also plays a crucial role in this stage.
This stage involves in finalization of the market size and numbers that we have collected from data integration step. With data interpolation, it is made sure that there is no gap in the market data. Successful trend analysis is done by our analysts using extrapolation techniques, which provide the best possible forecasts for the market.
Data Validation & Market Feedback: Validation is the most important step in the process. Validation & re-validation via an intricately designed process helps us finalize data-points to be used for final calculations.

The Brainy Insights interacts with leading companies and experts of the concerned domain to develop the analyst team’s market understanding and expertise. It improves and substantiates every single data presented in the market reports. The data validation interview and discussion panels are typically composed of the most experienced industry members. The participants include, however, are not limited to:
Moreover, we always validate our data and findings through primary respondents from all the major regions we are working on.


Free Customization
Fortune 500 Clients
Free Yearly Update On Purchase Of Multi/Corporate License
Companies Served Till Date