- +1-315-215-1633
- sales@thebrainyinsights.com

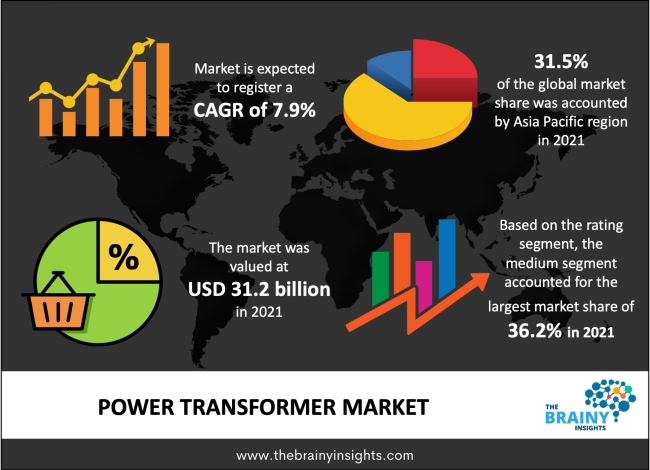
The power transformer market was estimated at around USD 31.2 billion in 2021, growing at a CAGR of nearly 7.9% during 2022-2030. The market is projected to reach approximately USD 61.95 billion by 2030.
Electric energy is transferred from one or more electrical circuits to another using a power transformer, a passive electrical system. Increasing investments in the energy sector as a result of increased infrastructure development are anticipated to support the market's growth. These transformers offer the best performance and are made to operate at full load. Decades of study in transmission networks have led to an increase in transmission voltages. Transmission of low-voltage to high-voltage power is made possible by power transformers. As the need for electricity increases globally, a major expansion of the power transformers market is anticipated. In 2018, there was an around 26,000 terawatt-hour demand for power (TWh). Power transformer use will undoubtedly expand with the rise in electricity consumption, particularly for long-distance high voltage transmissions. Power transformers are static devices used to transfer power without changing frequency from one circuit to another. These transformers, which are situated at the end or receiving end of lengthy high voltage transmission lines for step-up and step-down applications, are often above 200 MVA. The increasing deployment of renewable infrastructure for power generation as well as the modernization and extension of current grid infrastructure are the main drivers for power transformers.
Get an overview of this study by requesting a free sample
COVID-19 has had a detrimental effect on the global economy because many industries have been touched by the crisis and several sectors' operations have stopped. The power sector is among those affected industries. The lockdown has harmed the electricity distribution companies' capacity to maintain their financial soundness. For example, India's daily electricity demand has dropped by 25 to 28% since the commencement of the statewide lockdown, primarily as a result of the closure of businesses in the commercial and industrial sectors, including factories and offices. Power transformer companies have encountered aggregate technical and commercial (AT&C) losses that are larger than those imposed by regulators due to higher T&D losses than in the past. After the pandemic, the market will grow considerably.
Increasing electricity demand worldwide
The expansion of the global power transformers market is being driven by accelerated industrialization and increased domestic power demand. Globally, the need for power is continually increasing, which has led to a rise in the consumption of energy resources. More power plants as well as vast transmission networks are now present everywhere. The development of contemporary electric vehicles and incentives to utilize them are increasing the industry's use of electricity. Since most power plants are located in remote locations, the electricity generated is then sent via HVDC power transmission lines to the substations, where it is then distributed to the end consumers after step-down. Energy resources are generally underutilized in developing countries, and most less developed nations' power infrastructure might be improved. As a result, the need for electricity globally is now driving the global power transformers market.
Modernizing existing transmission networks
The transmission network is made up of electrical grids, poles, switch equipment, and transmission lines. Raising the transmission voltage is a continuous endeavor to reduce transmission losses, which make up the majority of losses in a power system. Electricity is frequently sent at high voltage to reduce transmission losses (above 115KV). The transmission network has had to be upgraded globally due to the introduction of Ultra High Voltage (UHV) transmission (1100KV and higher). While China has been employing UHV DC/AC transmission since 2009, India currently has the ability to transmit power at 1200KV. As a connecting device that connects two networks with different voltages, the power transformer performs a key role. Throughout the electrical system, power transformers link multiple networks. Consequently, elevated transmission voltage is what really fuel the demand for power transformers with greater ratings.
Rating divisions exist in the power transformer market. According to ratings, it is predicted that over the forecast period, the medium category market will dominate. Transformers with a medium grade are between 100 MVA and 500 MVA. After receiving energy from higher voltage levels, medium power transformers transform and distribute it to lower voltage substations or straight to sizable industrial customers. Power transformers with a medium rating are used for high voltage and extra high voltage power transmission. A sizable market opportunity for these transformers is provided by the requirement to update transmission lines in order to reduce losses.
One of the most enticing markets is expected to continue to be Asia-Pacific, which now commands the majority of the market's revenue share. This is due to the continued and steady penetration of renewable energy sources as well as a greater emphasis on updating outdated electrical infrastructure. Recent advancements in asset health monitoring systems to ensure system security and reliability, as well as increased investments in the construction of long-distance T&D networks, are also expected to fuel market dynamics.
The global Power transformer market is segmented as follows:
By Rating
By Region/Geography
| Attribute | Description |
|---|---|
| Base Year | 2021 |
| Forecast period | 2022-2030 |
| Report Coverage | Revenue estimation and forecast, company profile, competitive landscape, growth factors, and recent trends |
| Regional scope | North America, Europe, Asia Pacific, Middle East & Africa, and Latin America |
| Market Size(unit) | USD Billion |
| CAGR (2022 to 2030) | 7.9% |
| Segments Covered | By Rating |
1. Introduction
1.1. Objectives of the Study
1.2. Market Definition
1.3. Research Scope
2. Research Methodology and Assumptions
3. Executive Summary
4. Premium Insights
4.1. Porter’s Five Forces Analysis
4.2. Value Chain Analysis
4.3. Top Investment Pockets
4.3.1. Market Attractiveness Analysis By Rating
4.4. Industry Trends
5. Market Dynamics
5.1. Market Evaluation
5.2. Drivers
5.2.1. Increasing electricity demand worldwide
5.2.2. Modernizing existing transmission networks
5.3. Restrains
5.3.1. High cost would hamper the market
5.4. Opportunities
5.4.1. Increasing use of non-conventional and renewable energy sources
6. Global Power Transformer Market Analysis and Forecast, By Rating
6.1. Segment Overview
6.2. Low
6.3. Medium
6.4. High
7. Global Power Transformer Market Analysis and Forecast, By Regional Analysis
7.1. Segment Overview
7.2. North America
7.2.1. U.S.
7.2.2. Canada
7.2.3. Mexico
7.3. Europe
7.3.1. Germany
7.3.2. France
7.3.3. U.K.
7.3.4. Italy
7.3.5. Spain
7.3.6. Rest of Europe
7.4. Asia-Pacific
7.4.1. Japan
7.4.2. China
7.4.3. India
7.4.4. Australia
7.4.5. South Korea
7.4.6. Rest of Asia-Pacific
7.5. South America
7.5.1. Brazil
7.5.2. Argentina
7.5.3. Rest of South America
7.6. Middle East and Africa
7.6.1. UAE
7.6.2. South Africa
7.6.3. Egypt
7.6.4. Kuwait
7.6.5. Saudi Arabia
7.6.6. Rest of Middle East & Africa
8. Global Power Transformer Market-Competitive Landscape
8.1. Overview
8.2. Market Share of Key Players in the Power Transformer Market
8.2.1. Global Company Market Share
8.2.2. North America Company Market Share
8.2.3. Europe Company Market Share
8.2.4. APAC Company Market Share
8.3. Competitive Situations and Trends
8.3.1. Rating Launches and Developments
8.3.2. Partnerships, Collaborations, and Agreements
8.3.3. Mergers & Acquisitions
8.3.4. Expansions
9. Company Profiles
9.1. Cg Power and Industrial
9.1.1. Business Overview
9.1.2. Company Snapshot
9.1.3. Company Market Share Analysis
9.1.4. Company End Use Portfolio
9.1.5. Recent Developments
9.1.6. SWOT Analysis
9.2. Solutions Ltd
9.2.1. Business Overview
9.2.2. Company Snapshot
9.2.3. Company Market Share Analysis
9.2.4. Company End Use Portfolio
9.2.5. Recent Developments
9.2.6. SWOT Analysis
9.3. Siemens Ag
9.3.1. Business Overview
9.3.2. Company Snapshot
9.3.3. Company Market Share Analysis
9.3.4. Company End Use Portfolio
9.3.5. Recent Developments
9.3.6. SWOT Analysis
9.4. Schneider Electric Se
9.4.1. Business Overview
9.4.2. Company Snapshot
9.4.3. Company Market Share Analysis
9.4.4. Company End Use Portfolio
9.4.5. Recent Developments
9.4.6. SWOT Analysis
9.5. EMCO Ltd.
9.5.1. Business Overview
9.5.2. Company Snapshot
9.5.3. Company Market Share Analysis
9.5.4. Company End Use Portfolio
9.5.5. Recent Developments
9.5.6. SWOT Analysis
9.6. Bharat Heavy Electricals Ltd.
9.6.1. Business Overview
9.6.2. Company Snapshot
9.6.3. Company Market Share Analysis
9.6.4. Company End Use Portfolio
9.6.5. Recent Developments
9.6.6. SWOT Analysis
9.7. General Electric Company
9.7.1. Business Overview
9.7.2. Company Snapshot
9.7.3. Company Market Share Analysis
9.7.4. Company End Use Portfolio
9.7.5. Recent Developments
9.7.6. SWOT Analysis
9.8. Kirloskar Electric Co. Ltd.
9.8.1. Business Overview
9.8.2. Company Snapshot
9.8.3. Company Market Share Analysis
9.8.4. Company End Use Portfolio
9.8.5. Recent Developments
9.8.6. SWOT Analysis
9.9. Toshiba Corporation
9.9.1. Business Overview
9.9.2. Company Snapshot
9.9.3. Company Market Share Analysis
9.9.4. Company End Use Portfolio
9.9.5. Recent Developments
9.9.6. SWOT Analysis
9.10. Hitachi Ltd.
9.10.1. Business Overview
9.10.2. Company Snapshot
9.10.3. Company Market Share Analysis
9.10.4. Company End Use Portfolio
9.10.5. Recent Developments
9.10.6. SWOT Analysis
List of Table
1. Global Power Transformer Market, By Rating, 2022-2030(USD Billion)
2. Global Low Machine Power Transformer Market, By Region, 2022-2030(USD Billion)
3. Global Medium Power Transformer Market, By Region, 2022-2030(USD Billion)
4. Global High Power Transformer Market, By Region, 2022-2030(USD Billion)
5. Global Power Transformer Market, By Region, 2022-2030(USD Billion)
6. Global Power Transformer Market, By North America, 2022-2030(USD Billion)
7. North America Power Transformer Market, By Rating, 2022-2030(USD Billion)
8. U.S. Power Transformer Market, By Rating, 2022-2030(USD Billion)
9. Canada Power Transformer Market, By Rating, 2022-2030(USD Billion)
10. Mexico Power Transformer Market, By Rating, 2022-2030(USD Billion)
11. Europe Power Transformer Market, By Rating, 2022-2030(USD Billion)
12. Germany Power Transformer Market, By Rating, 2022-2030(USD Billion)
13. France Power Transformer Market, By Rating, 2022-2030(USD Billion)
14. U.K. Power Transformer Market, By Rating, 2022-2030(USD Billion)
15. Italy Power Transformer Market, By Rating, 2022-2030(USD Billion)
16. Spain Power Transformer Market, By Rating, 2022-2030(USD Billion)
17. Rest of Europe Power Transformer Market, By Rating, 2022-2030(USD Billion)
18. Asia Pacific Power Transformer Market, By Rating, 2022-2030(USD Billion)
19. Japan Power Transformer Market, By Rating, 2022-2030(USD Billion)
20. China Power Transformer Market, By Rating, 2022-2030(USD Billion)
21. India Power Transformer Market, By Rating, 2022-2030(USD Billion)
22. Australia Power Transformer Market, By Rating, 2022-2030(USD Billion)
23. South Korea Power Transformer Market, By Rating, 2022-2030(USD Billion)
24. Rest of Asia-Pacific Power Transformer Market, By Rating, 2022-2030(USD Billion)
25. South America Power Transformer Market, By Rating, 2022-2030(USD Billion)
26. Brazil Power Transformer Market, By Rating, 2022-2030(USD Billion)
27. Argentina Power Transformer Market, By Rating, 2022-2030(USD Billion)
28. Rest of Latin America Power Transformer Market, By Rating, 2022-2030(USD Billion)
29. Middle East and Africa Power Transformer Market, By Rating, 2022-2030(USD Billion)
30. UAE Power Transformer Market, By Rating, 2022-2030(USD Billion)
31. South Africa Power Transformer Market, By Rating, 2022-2030(USD Billion)
32. Egypt Power Transformer Market, By Rating, 2022-2030(USD Billion)
33. Kuwait Power Transformer Market, By Rating, 2022-2030(USD Billion)
34. Saudi Arabia Power Transformer Market, By Rating, 2022-2030(USD Billion)
35. Rest of Middle East Power Transformer Market, By Rating, 2022-2030(USD Billion)
List of Figures
1. Global Power Transformer Market Segmentation
2. Power Transformer Market: Research Methodology
3. Market Size Estimation Methodology: Bottom-Up Approach
4. Market Size Estimation Methodology: Top-Down Approach
5. Data Triangulation
6. Porter’s Five Forces Analysis
7. Value Chain Analysis
8. Global Power Transformer Market Attractiveness Analysis By Rating
9. Global Power Transformer Market Attractiveness Analysis By Region
10. Global Power Transformer Market: Dynamics
11. Global Power Transformer Market Share By Rating(2022 & 2030)
12. Global Power Transformer Market Share by Regions (2022 & 2030)
13. Global Power Transformer Market Share by Company (2021)
By Rating
By Region/Geography
Research has its special purpose to undertake marketing efficiently. In this competitive scenario, businesses need information across all industry verticals; the information about customer wants, market demand, competition, industry trends, distribution channels etc. This information needs to be updated regularly because businesses operate in a dynamic environment. Our organization, The Brainy Insights incorporates scientific and systematic research procedures in order to get proper market insights and industry analysis for overall business success. The analysis consists of studying the market from a miniscule level wherein we implement statistical tools which helps us in examining the data with accuracy and precision.
Our research reports feature both; quantitative and qualitative aspects for any market. Qualitative information for any market research process are fundamental because they reveal the customer needs and wants, usage and consumption for any product/service related to a specific industry. This in turn aids the marketers/investors in knowing certain perceptions of the customers. Qualitative research can enlighten about the different product concepts and designs along with unique service offering that in turn, helps define marketing problems and generate opportunities. On the other hand, quantitative research engages with the data collection process through interviews, e-mail interactions, surveys and pilot studies. Quantitative aspects for the market research are useful to validate the hypotheses generated during qualitative research method, explore empirical patterns in the data with the help of statistical tools, and finally make the market estimations.
The Brainy Insights offers comprehensive research and analysis, based on a wide assortment of factual insights gained through interviews with CXOs and global experts and secondary data from reliable sources. Our analysts and industry specialist assume vital roles in building up statistical tools and analysis models, which are used to analyse the data and arrive at accurate insights with exceedingly informative research discoveries. The data provided by our organization have proven precious to a diverse range of companies, facilitating them to address issues such as determining which products/services are the most appealing, whether or not customers use the product in the manner anticipated, the purchasing intentions of the market and many others.
Our research methodology encompasses an idyllic combination of primary and secondary initiatives. Key phases involved in this process are listed below:

The phase involves the gathering and collecting of market data and its related information with the help of different sources & research procedures.

The data procurement stage involves in data gathering and collecting through various data sources.
This stage involves in extensive research. These data sources includes:
Purchased Database: Purchased databases play a crucial role in estimating the market sizes irrespective of the domain. Our purchased database includes:
Primary Research: The Brainy Insights interacts with leading companies and experts of the concerned domain to develop the analyst team’s market understanding and expertise. It improves and substantiates every single data presented in the market reports. Primary research mainly involves in telephonic interviews, E-mail interactions and face-to-face interviews with the raw material providers, manufacturers/producers, distributors, & independent consultants. The interviews that we conduct provides valuable data on market size and industry growth trends prevailing in the market. Our organization also conducts surveys with the various industry experts in order to gain overall insights of the industry/market. For instance, in healthcare industry we conduct surveys with the pharmacists, doctors, surgeons and nurses in order to gain insights and key information of a medical product/device/equipment which the customers are going to usage. Surveys are conducted in the form of questionnaire designed by our own analyst team. Surveys plays an important role in primary research because surveys helps us to identify the key target audiences of the market. Additionally, surveys helps to identify the key target audience engaged with the market. Our survey team conducts the survey by targeting the key audience, thus gaining insights from them. Based on the perspectives of the customers, this information is utilized to formulate market strategies. Moreover, market surveys helps us to understand the current competitive situation of the industry. To be precise, our survey process typically involve with the 360 analysis of the market. This analytical process begins by identifying the prospective customers for a product or service related to the market/industry to obtain data on how a product/service could fit into customers’ lives.

Secondary Research: The secondary data sources includes information published by the on-profit organizations such as World bank, WHO, company fillings, investor presentations, annual reports, national government documents, statistical databases, blogs, articles, white papers and others. From the annual report, we analyse a company’s revenue to understand the key segment and market share of that organization in a particular region. We analyse the company websites and adopt the product mapping technique which is important for deriving the segment revenue. In the product mapping method, we select and categorize the products offered by the companies catering to domain specific market, deduce the product revenue for each of the companies so as to get overall estimation of the market size. We also source data and analyses trends based on information received from supply side and demand side intermediaries in the value chain. The supply side denotes the data gathered from supplier, distributor, wholesaler and the demand side illustrates the data gathered from the end customers for respective market domain.

The supply side for a domain specific market is analysed by:
The demand side for the market is estimated through:
In-house Library: Apart from these third-party sources, we have our in-house library of qualitative and quantitative information. Our in-house database includes market data for various industry and domains. These data are updated on regular basis as per the changing market scenario. Our library includes, historic databases, internal audit reports and archives.
Sometimes there are instances where there is no metadata or raw data available for any domain specific market. For those cases, we use our expertise to forecast and estimate the market size in order to generate comprehensive data sets. Our analyst team adopt a robust research technique in order to produce the estimates:
Data Synthesis: This stage involves the analysis & mapping of all the information obtained from the previous step. It also involves in scrutinizing the data for any discrepancy observed while data gathering related to the market. The data is collected with consideration to the heterogeneity of sources. Robust scientific techniques are in place for synthesizing disparate data sets and provide the essential contextual information that can orient market strategies. The Brainy Insights has extensive experience in data synthesis where the data passes through various stages:


Market Deduction & Formulation: The final stage comprises of assigning data points at appropriate market spaces so as to deduce feasible conclusions. Analyst perspective & subject matter expert based holistic form of market sizing coupled with industry analysis also plays a crucial role in this stage.
This stage involves in finalization of the market size and numbers that we have collected from data integration step. With data interpolation, it is made sure that there is no gap in the market data. Successful trend analysis is done by our analysts using extrapolation techniques, which provide the best possible forecasts for the market.
Data Validation & Market Feedback: Validation is the most important step in the process. Validation & re-validation via an intricately designed process helps us finalize data-points to be used for final calculations.

The Brainy Insights interacts with leading companies and experts of the concerned domain to develop the analyst team’s market understanding and expertise. It improves and substantiates every single data presented in the market reports. The data validation interview and discussion panels are typically composed of the most experienced industry members. The participants include, however, are not limited to:
Moreover, we always validate our data and findings through primary respondents from all the major regions we are working on.


Free Customization
Fortune 500 Clients
Free Yearly Update On Purchase Of Multi/Corporate License
Companies Served Till Date