- +1-315-215-1633
- sales@thebrainyinsights.com

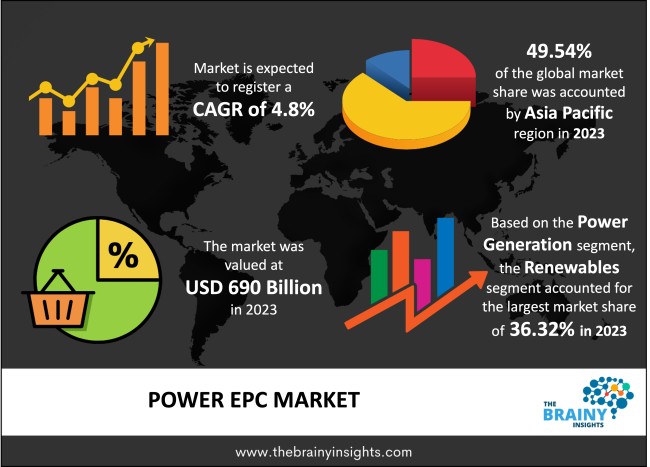
The global Power EPC market was valued at USD 690 billion in 2023 and growing at a CAGR of 4.8% from 2024 to 2033. The market is expected to reach USD 1103 billion by 2033. Rising demand for energy and power, Advancements in turbines, and other energy sources will potentially drive the growth of the Power EPC Market. Whereas a Rapidly growing global population and rapid urbanization may drive the growth of the Power EPC Market in the period forecasted. Also, there is a surge in the EPC sector in emerging economies due to government expenditures on infrastructure development to sustain economic growth, which fuels market growth. The population has increased, leading to rapid urbanization along with growing disposable income. The growing use of technology like AI is further driving the market.
The Power EPC Market denotes a segment within the broader energy sector concentrating on Engineering, Procurement, and Construction (EPC) services specialized for power generation, transmission, and distribution endeavors. It encompasses diverse tasks ranging from project planning and design to procurement, construction, and commissioning across various power infrastructure projects.
Various significant factors shape the Power EPC Market, including increasing energy demands, the necessity to modernize aging infrastructure, government backing for renewable energy endeavors, advancements in technology, and a heightened emphasis on sustainability and carbon emission reduction.
Entities operating within the Power EPC Market typically offer a wide spectrum of services, encompassing feasibility evaluations, engineering design, equipment procurement, construction supervision, project funding, and project initiation. These firms engage in collaborative efforts with a diverse array of stakeholders, such as utility providers, independent energy producers, governmental entities, and private developers, to provide integrated solutions for power infrastructure projects.
Get an overview of this study by requesting a free sample
Rising demand for energy and power – The increasing demand for energy and power catalyzes the growth of the Power EPC Market. As energy needs rise across various sectors such as residential, commercial, industrial, and infrastructure development, there's a corresponding surge in the requirement for the construction of power generation, transmission, and distribution infrastructure. This heightened demand prompts organizations and governments to invest in expanding their power capacity and modernizing existing infrastructure.
High setup and installation costs – A significant obstacle linked with Power EPC is the substantial setup and installation expenses involved. This hurdle often leads to delays or abandonment of major EPC projects in the market. Furthermore, organizations grappling with tight budget constraints to acquire these services pose another significant drawback, impeding the expansion of the Power EPC Market.
Government initiatives promoting the growth of Power EPC in the market- Investing in renewable energy presents an avenue to bolster energy security and diminish reliance on imported fossil fuels. Numerous nations acknowledge the significance of broadening their energy portfolio and lessening dependence on geopolitically unstable regions for energy procurement. By allocating resources to domestic renewable energy initiatives, countries fortify their energy self-sufficiency, foster growth in local economies, and generate employment opportunities.
The regions analyzed for the market include North America, Europe, South America, Asia Pacific, the Middle East, and Africa. APAC emerged as the largest global Power EPC market, accounting for 49.54% of the total market. Further, it is expected to be the fastest-growing region in the global market. Owing to rapidly growing industrialization, urbanization, construction activities in highest populous countries: India, and China. Additionally, the rapidly growing population and APAC is the largest consumer of energy consumption in the global market.
APAC Region Power EPC Market Share in 2023 - 49.54%
www.thebrainyinsights.com
Check the geographical analysis of this market by requesting a free sample
Renewables have dominated the market accounting for 36.32% of the total market. Further, it is also expected to be the fastest-growing in the market. Owing to rapid awareness towards global awareness and increasing adverse impacts of the fossils on earth. Additionally, rising government initiatives for the same and renewables offering lower-carbon alternatives to fossil fuels have also made renewables dominate the Power Generation in the Market.
| Attribute | Description |
|---|---|
| Market Size | Revenue (USD Billion) |
| Market size value in 2023 | USD 690 Billion |
| Market size value in 2033 | USD 1103 Billion |
| CAGR (2024 to 2033) | 4.8% |
| Historical data | 2020-2022 |
| Base Year | 2023 |
| Forecast | 2024-2033 |
| Region | The regions analyzed for the market are Asia Pacific, Europe, South America, North America, and Middle East & Africa. Furthermore, the regions are further analyzed at the country level. |
| Segments | Power Generation |
As per The Brainy Insights, the size of the power EPC market was valued at USD 690 billion in 2023 to USD 1,103 billion by 2033.
The global power EPC market is growing at a CAGR of 4.8% during the forecast period 2024-2033.
The Asia Pacific region emerged as the largest market for the power EPC.
The rising demand for energy and power will influence the market's growth.
1. Introduction
1.1. Objectives of the Study
1.2. Market Definition
1.3. Research Scope
1.4. Currency
1.5. Key Target Audience
2. Research Methodology and Assumptions
3. Executive Summary
4. Premium Insights
4.1. Porter’s Five Forces Analysis
4.2. Value Chain Analysis
4.3. Top Investment Pockets
4.3.1. Market Attractiveness Analysis by Power Generation
4.3.2. Market Attractiveness Analysis by Region
4.4. Industry Trends
5. Market Dynamics
5.1. Market Evaluation
5.2. Drivers
5.2.1. Rising demand for energy and power
5.2.2. Advancements in turbine and other energy sources
5.3. Restraints
5.3.1. High setup and installation costs
5.4. Opportunities
5.4.1. Rapidly growing global population
5.4.2. Rapid urbanization
5.4.3. Government initiatives promoting the growth of Power EPC in the market
5.5. Challenges
5.5.1. Diminishing various conventional sources of electricity
6. Global Power EPC Market Analysis and Forecast, By Power Generation
6.1. Segment Overview
6.2. Thermal
6.3. Hydroelectric
6.4. Nuclear
6.5. Renewables
7. Global Power EPC Market Analysis and Forecast, By Regional Analysis
7.1. Segment Overview
7.2. North America
7.2.1. U.S.
7.2.2. Canada
7.2.3. Mexico
7.3. Europe
7.3.1. Germany
7.3.2. France
7.3.3. U.K.
7.3.4. Italy
7.3.5. Spain
7.4. Asia-Pacific
7.4.1. Japan
7.4.2. China
7.4.3. India
7.5. South America
7.5.1. Brazil
7.6. Middle East and Africa
7.6.1. UAE
7.6.2. South Africa
8. Global Power EPC Market-Competitive Landscape
8.1. Overview
8.2. Market Share of Key Players in Global Power EPC Market
8.2.1. Global Company Market Share
8.2.2. North America Company Market Share
8.2.3. Europe Company Market Share
8.2.4. APAC Company Market Share
8.3. Competitive Situations and Trends
8.3.1. Product Launches and Developments
8.3.2. Partnerships, Collaborations, and Agreements
8.3.3. Mergers & Acquisitions
8.3.4. Expansions
9. Company Profiles
9.1. Fluor Ltd
9.1.1. Business Overview
9.1.2. Company Snapshot
9.1.3. Company Market Share Analysis
9.1.4. Company Product Portfolio
9.1.5. Recent Developments
9.1.6. SWOT Analysis
9.2. John Wood PLC
9.2.1. Business Overview
9.2.2. Company Snapshot
9.2.3. Company Market Share Analysis
9.2.4. Company Product Portfolio
9.2.5. Recent Developments
9.2.6. SWOT Analysis
9.3. Kiewit Corporation
9.3.1. Business Overview
9.3.2. Company Snapshot
9.3.3. Company Market Share Analysis
9.3.4. Company Product Portfolio
9.3.5. Recent Developments
9.3.6. SWOT Analysis
9.4. McDermott International Inc
9.4.1. Business Overview
9.4.2. Company Snapshot
9.4.3. Company Market Share Analysis
9.4.4. Company Product Portfolio
9.4.5. Recent Developments
9.4.6. SWOT Analysis
9.5. Bechtel Corporation
9.5.1. Business Overview
9.5.2. Company Snapshot
9.5.3. Company Market Share Analysis
9.5.4. Company Product Portfolio
9.5.5. Recent Developments
9.5.6. SWOT Analysis
9.6. Saipem SpA
9.6.1. Business Overview
9.6.2. Company Snapshot
9.6.3. Company Market Share Analysis
9.6.4. Company Product Portfolio
9.6.5. Recent Developments
9.6.6. SWOT Analysis
9.7. Larsen & Turbo Limited
9.7.1. Business Overview
9.7.2. Company Snapshot
9.7.3. Company Market Share Analysis
9.7.4. Company Product Portfolio
9.7.5. Recent Developments
9.7.6. SWOT Analysis
9.8. Doosan Heavy Industries & Construction
9.8.1. Business Overview
9.8.2. Company Snapshot
9.8.3. Company Market Share Analysis
9.8.4. Company Product Portfolio
9.8.5. Recent Developments
9.8.6. SWOT Analysis
9.9. TATA Projects
9.9.1. Business Overview
9.9.2. Company Snapshot
9.9.3. Company Market Share Analysis
9.9.4. Company Product Portfolio
9.9.5. Recent Developments
9.9.6. SWOT Analysis
9.10. Thermax Global
9.10.1. Business Overview
9.10.2. Company Snapshot
9.10.3. Company Market Share Analysis
9.10.4. Company Product Portfolio
9.10.5. Recent Developments
9.10.6. SWOT Analysis
List of Table
1. Global Power EPC Market, By Power Generation, 2020-2033 (USD Billion)
2. Global Thermal, Power EPC Market, By Region, 2020-2033 (USD Billion)
3. Global Hydroelectric, Power EPC Market, By Region, 2020-2033 (USD Billion)
4. Global Nuclear, Power EPC Market, By Region, 2020-2033 (USD Billion)
5. Global Renewables, Power EPC Market, By Region, 2020-2033 (USD Billion)
6. Global Power EPC Market, By Region, 2020-2033 (USD Billion)
7. North America Power EPC Market, By Power Generation, 2020-2033 (USD Billion)
8. U.S. Power EPC Market, By Power Generation, 2020-2033 (USD Billion)
9. Canada Power EPC Market, By Power Generation, 2020-2033 (USD Billion)
10. Mexico Power EPC Market, By Power Generation, 2020-2033 (USD Billion)
11. Europe Power EPC Market, By Power Generation, 2020-2033 (USD Billion)
12. Germany Power EPC Market, By Power Generation, 2020-2033 (USD Billion)
13. France Power EPC Market, By Power Generation, 2020-2033 (USD Billion)
14. U.K. Power EPC Market, By Power Generation, 2020-2033 (USD Billion)
15. Italy Power EPC Market, By Power Generation, 2020-2033 (USD Billion)
16. Spain Power EPC Market, By Power Generation, 2020-2033 (USD Billion)
17. Asia Pacific Power EPC Market, By Power Generation, 2020-2033 (USD Billion)
18. Japan Power EPC Market, By Power Generation, 2020-2033 (USD Billion)
19. China Power EPC Market, By Power Generation, 2020-2033 (USD Billion)
20. India Power EPC Market, By Power Generation, 2020-2033 (USD Billion)
21. South America Power EPC Market, By Power Generation, 2020-2033 (USD Billion)
22. Brazil Power EPC Market, By Power Generation, 2020-2033 (USD Billion)
23. Middle East and Africa Power EPC Market, By Power Generation, 2020-2033 (USD Billion)
24. UAE Power EPC Market, By Power Generation, 2020-2033 (USD Billion)
25. South Africa Power EPC Market, By Power Generation, 2020-2033 (USD Billion)
List of Figures
1. Global Power EPC Market Segmentation
2. Global Power EPC Market: Research Methodology
3. Market Size Estimation Methodology: Bottom-Up Approach
4. Market Size Estimation Methodology: Top-Down Approach
5. Data Triangulation
6. Porter’s Five Forces Analysis
7. Value Chain Analysis
8. Global Power EPC Market Attractiveness Analysis by Power Generation
9. Global Power EPC Market Attractiveness Analysis by Region
10. Global Power EPC Market: Dynamics
11. Global Power EPC Market Share by Power Generation (2023 & 2033)
12. Global Power EPC Market Share by Regions (2023 & 2033)
13. Global Power EPC Market Share by Company (2023)
This study forecasts revenue at global, regional, and country levels from 2020 to 2033. The Brainy Insights has segmented the global power EPC market based on below-mentioned segments:
Global Power EPC Market by Power Generation:
Global Power EPC Market by Region:
Research has its special purpose to undertake marketing efficiently. In this competitive scenario, businesses need information across all industry verticals; the information about customer wants, market demand, competition, industry trends, distribution channels etc. This information needs to be updated regularly because businesses operate in a dynamic environment. Our organization, The Brainy Insights incorporates scientific and systematic research procedures in order to get proper market insights and industry analysis for overall business success. The analysis consists of studying the market from a miniscule level wherein we implement statistical tools which helps us in examining the data with accuracy and precision.
Our research reports feature both; quantitative and qualitative aspects for any market. Qualitative information for any market research process are fundamental because they reveal the customer needs and wants, usage and consumption for any product/service related to a specific industry. This in turn aids the marketers/investors in knowing certain perceptions of the customers. Qualitative research can enlighten about the different product concepts and designs along with unique service offering that in turn, helps define marketing problems and generate opportunities. On the other hand, quantitative research engages with the data collection process through interviews, e-mail interactions, surveys and pilot studies. Quantitative aspects for the market research are useful to validate the hypotheses generated during qualitative research method, explore empirical patterns in the data with the help of statistical tools, and finally make the market estimations.
The Brainy Insights offers comprehensive research and analysis, based on a wide assortment of factual insights gained through interviews with CXOs and global experts and secondary data from reliable sources. Our analysts and industry specialist assume vital roles in building up statistical tools and analysis models, which are used to analyse the data and arrive at accurate insights with exceedingly informative research discoveries. The data provided by our organization have proven precious to a diverse range of companies, facilitating them to address issues such as determining which products/services are the most appealing, whether or not customers use the product in the manner anticipated, the purchasing intentions of the market and many others.
Our research methodology encompasses an idyllic combination of primary and secondary initiatives. Key phases involved in this process are listed below:

The phase involves the gathering and collecting of market data and its related information with the help of different sources & research procedures.

The data procurement stage involves in data gathering and collecting through various data sources.
This stage involves in extensive research. These data sources includes:
Purchased Database: Purchased databases play a crucial role in estimating the market sizes irrespective of the domain. Our purchased database includes:
Primary Research: The Brainy Insights interacts with leading companies and experts of the concerned domain to develop the analyst team’s market understanding and expertise. It improves and substantiates every single data presented in the market reports. Primary research mainly involves in telephonic interviews, E-mail interactions and face-to-face interviews with the raw material providers, manufacturers/producers, distributors, & independent consultants. The interviews that we conduct provides valuable data on market size and industry growth trends prevailing in the market. Our organization also conducts surveys with the various industry experts in order to gain overall insights of the industry/market. For instance, in healthcare industry we conduct surveys with the pharmacists, doctors, surgeons and nurses in order to gain insights and key information of a medical product/device/equipment which the customers are going to usage. Surveys are conducted in the form of questionnaire designed by our own analyst team. Surveys plays an important role in primary research because surveys helps us to identify the key target audiences of the market. Additionally, surveys helps to identify the key target audience engaged with the market. Our survey team conducts the survey by targeting the key audience, thus gaining insights from them. Based on the perspectives of the customers, this information is utilized to formulate market strategies. Moreover, market surveys helps us to understand the current competitive situation of the industry. To be precise, our survey process typically involve with the 360 analysis of the market. This analytical process begins by identifying the prospective customers for a product or service related to the market/industry to obtain data on how a product/service could fit into customers’ lives.

Secondary Research: The secondary data sources includes information published by the on-profit organizations such as World bank, WHO, company fillings, investor presentations, annual reports, national government documents, statistical databases, blogs, articles, white papers and others. From the annual report, we analyse a company’s revenue to understand the key segment and market share of that organization in a particular region. We analyse the company websites and adopt the product mapping technique which is important for deriving the segment revenue. In the product mapping method, we select and categorize the products offered by the companies catering to domain specific market, deduce the product revenue for each of the companies so as to get overall estimation of the market size. We also source data and analyses trends based on information received from supply side and demand side intermediaries in the value chain. The supply side denotes the data gathered from supplier, distributor, wholesaler and the demand side illustrates the data gathered from the end customers for respective market domain.

The supply side for a domain specific market is analysed by:
The demand side for the market is estimated through:
In-house Library: Apart from these third-party sources, we have our in-house library of qualitative and quantitative information. Our in-house database includes market data for various industry and domains. These data are updated on regular basis as per the changing market scenario. Our library includes, historic databases, internal audit reports and archives.
Sometimes there are instances where there is no metadata or raw data available for any domain specific market. For those cases, we use our expertise to forecast and estimate the market size in order to generate comprehensive data sets. Our analyst team adopt a robust research technique in order to produce the estimates:
Data Synthesis: This stage involves the analysis & mapping of all the information obtained from the previous step. It also involves in scrutinizing the data for any discrepancy observed while data gathering related to the market. The data is collected with consideration to the heterogeneity of sources. Robust scientific techniques are in place for synthesizing disparate data sets and provide the essential contextual information that can orient market strategies. The Brainy Insights has extensive experience in data synthesis where the data passes through various stages:


Market Deduction & Formulation: The final stage comprises of assigning data points at appropriate market spaces so as to deduce feasible conclusions. Analyst perspective & subject matter expert based holistic form of market sizing coupled with industry analysis also plays a crucial role in this stage.
This stage involves in finalization of the market size and numbers that we have collected from data integration step. With data interpolation, it is made sure that there is no gap in the market data. Successful trend analysis is done by our analysts using extrapolation techniques, which provide the best possible forecasts for the market.
Data Validation & Market Feedback: Validation is the most important step in the process. Validation & re-validation via an intricately designed process helps us finalize data-points to be used for final calculations.

The Brainy Insights interacts with leading companies and experts of the concerned domain to develop the analyst team’s market understanding and expertise. It improves and substantiates every single data presented in the market reports. The data validation interview and discussion panels are typically composed of the most experienced industry members. The participants include, however, are not limited to:
Moreover, we always validate our data and findings through primary respondents from all the major regions we are working on.


Free Customization
Fortune 500 Clients
Free Yearly Update On Purchase Of Multi/Corporate License
Companies Served Till Date