- +1-315-215-1633
- sales@thebrainyinsights.com

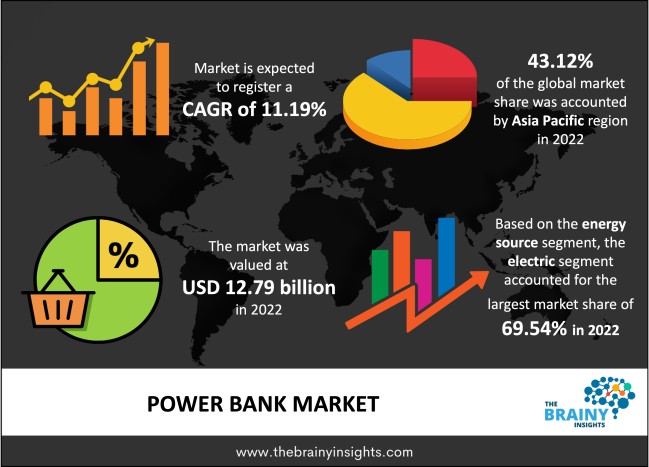
The global power bank market is projected to reach USD 36.95 billion by 2032, at a CAGR of 11.19% from 2023 to 2032. The rise in the usage of electronic devices such as smartphones, headphones, speakers, etc., has led to the widespread adoption of power banks, especially among the young population.
Power banks are widely used and can be used to charge various devices, including portable speakers, battery-operated headphones, smartphones, etc. They serve as portable chargers in actuality. Power banks are available in a wide range of sizes and designs to accommodate the needs of a wide range of users. Power banks have increased dramatically in recent years since they offer an efficient and simple way to charge smartphones and other gadgets while not connected to the main power. Wireless charging power banks have also been produced for devices that can be charged wirelessly. These power banks are already an established commodity and are handy, especially when travelling. Reaching a primary power source can be challenging whenever a mobile phone or other battery-operated equipment needs charging. Earlier power banks may have had 1000 mA hours or less capacity. However, some of the newest ones on the market today can provide enormous capabilities of 25000 mA hours.
Get an overview of this study by requesting a free sample
The power bank market operates globally via the key regions: North America, South America, Asia Pacific, Europe, the Middle East, and Africa. Among the regions, Asia-Pacific, followed by North America and Europe, will gain tremendous market share due to the expansion of the smartphone industry. This can be attributed to increased urbanization and rising per-capita income. The consumers of the mentioned regions are getting increasingly investing in smart devices. They prefer products that enhance their work and living standards. With the increased demand for electronic goods, companies are expanding their portfolio and providing advanced devices. According to the statistics, the number of smartphone users grows yearly. In 2021, the number of smartphone users around the globe was 6.4 billion, representing a 5.3 per cent annual rise. Smartphones are also the most often used electronic devices. According to the most recent smartphone user statistics, smartphones account for over 75% of all mobile telephones today. Portable chargers with power banks are beneficial since they allow battery-powered devices to charge anywhere. Thus, this factor is propelling the growth of the power bank market.
A power bank's quality is paramount to consider. Due to the high price of branded power banks, many consumers are willing to purchase counterfeit products, which can deteriorate the condition of their electronic devices. Poor-quality power banks may harm the battery and charging port on the phone. Security issues may also result from this factor. A low-quality lithium-ion power bank may explode if it is overcharged.
High-performance systems and tools are required to support the ultra-high frequencies and effective data rates needed for the 5G network. The exponential growth of data traffic has resulted in the expansion of mobile networks. As a result of this growth, radio network energy consumption has become a substantial contributor to operator electricity use and operational costs. With new devices and use cases increasing network capacity, ensuring low 5G energy consumption is critical to reducing operator costs and ensuring they can still meet their energy reduction goals. Wireless cellular networks, smartphone battery economy, and good power use have all become critical in the Fifth Generation (5G). In the mobile revolution, energy-efficient networks and an energy-saving approach in mobile devices are crucial. Thus, power banks are required to fulfil the needs of increased data capacity, data rate, and best-in-class service quality. Therefore, the demand for power bank services has increased, especially in North America and Europe.
Some countries are in developing regions, and most under-developed areas need to be aware of the power bank-sharing services. These countries still need to be occupied by the manufacturers due to low per capita income, which leads to lower or negligible demand for the product. These countries also perceive the power bank sharing services as needed to be more affordable. They need to measure the cost-benefit analysis on a long-term basis, which restricts the demand for the product in such regions.
The global power bank market has been segmented based on capacity range, battery type, energy source, application, distribution channel and regions.
The regions evaluated for the power bank market include North America, Europe, South America, Asia Pacific, the Middle East and Africa. The Asia Pacific region emerged as the most significant power bank market, with around 43.12% share of the market revenue in 2022.
APAC Power Bank Market Share in 2022 - 43.12%
www.thebrainyinsights.com
Check the geographical analysis of this market by requesting a free sample
The key players are now concentrating on implementing new technology, product innovations, mergers & acquisitions, joint venture, alliances, and partnerships to improve their market position in the global power bank industry.
In November 2017, Xiaomi introduced Mi Power Bank 2i Range, which consists10,000 the mAh Mi Power Bank 2 and 2,000 mAh Mi Power Bank 2.
In February 2022, Anker Innovations introduced PowerCore 10,000 mAh PD power bank with dual USB ports; the power bank’s USB Type-C port offers power up to 18 W.
As per The Brainy Insights, the size of the power bank market was valued at USD 12.79 billion in 2022 and is anticipated to reach USD 36.95 billion by 2032.
Global power bank market is growing at a CAGR of 11.19% during the forecast period 2023-2032.
The global power bank market has been segmented based on capacity range, energy source, battery type, application, distribution channel and regions. The electric segment dominated the market and held the largest market share in 2022.
The Asia Pacific region emerged as the largest market for the power bank.
Growing use of smartphones and tablets is the key driving factor for the power bank market.
Low-quality of power banks may hamper the market growth.
Technological advancements leading to increase in power consumption of electronic devices bodies will provide huge opportunities to the market.
Key players are ADATA, Ambrane India Private Limited, Anker Innovations, AsusTeK Computer Inc., AUKEY, GRIFFIN, Intex Technologies
1. Introduction
1.1. Objectives of the Study
1.2. Market Definition
1.3. Research Scope
1.4. Currency
1.5. Key Target Audience
2. Research Methodology and Assumptions
3. Executive Summary
4. Premium Insights
4.1. Porter’s Five Forces Analysis
4.2. Value Chain Analysis
4.3. Top Investment Pockets
4.3.1. Market Attractiveness Analysis By Capacity Range
4.3.2. Market Attractiveness Analysis By Energy Source
4.3.3. Market Attractiveness Analysis By Battery Type
4.3.4. Market Attractiveness Analysis By Application
4.3.5. Market Attractiveness Analysis By Distribution Channel
4.3.6. Market Attractiveness Analysis By Region
4.4. Industry Trends
5. Market Dynamics
5.1. Market Evaluation
5.2. Drivers
5.2.1. Growing use of smartphones and tablets
5.2.2. Increase in adoption of wearable devices
5.3. Restrains
5.3.1. Low-quality of power banks
5.4. Opportunities
5.4.1. Technological advancements leading to increase in power consumption of electronic devices
5.5. Challenges
5.5.1. Highly competitive market
6. Global Power Bank Market Analysis and Forecast, By Capacity Range
6.1. Segment Overview
6.2. 1,000–5,000 mAh
6.3. 5,001–10,000 mAh
6.4. 10,001–15,000 mAh
6.5. 15,001–20,000 mAh
6.6. Above 20,001 mAh
7. Global Power Bank Market Analysis and Forecast, By Energy Source
7.1. Segment Overview
7.2. Electric
7.3. Solar
8. Global Power Bank Market Analysis and Forecast, By Battery Type
8.1. Segment Overview
8.2. Lithium - Ion Batteries
8.3. Lithium Polymer Batteries
9. Global Power Bank Market Analysis and Forecast, By Application
9.1. Segment Overview
9.2. Smartphone
9.3. Tablet
9.4. Laptop
9.5. Wearable Device
9.6. Digital Camera
9.7. Portable Media Device
9.8. Others
10. Global Power Bank Market Analysis and Forecast, By Distribution Channel
10.1. Segment Overview
10.2. E-commerce
10.3. Brick And Mortar
11. Global Power Bank Market Analysis and Forecast, By Regional Analysis
11.1. Segment Overview
11.2. North America
11.2.1. U.S.
11.2.2. Canada
11.2.3. Mexico
11.3. Europe
11.3.1. Germany
11.3.2. France
11.3.3. U.K.
11.3.4. Italy
11.3.5. Spain
11.4. Asia-Pacific
11.4.1. Japan
11.4.2. China
11.4.3. India
11.5. South America
11.5.1. Brazil
11.6. Middle East and Africa
11.6.1. UAE
11.6.2. South Africa
12. Global Power Bank Market-Competitive Landscape
12.1. Overview
12.2. Market Share of Key Players in Global Power Bank Market
12.2.1. Global Company Market Share
12.2.2. North America Company Market Share
12.2.3. Europe Company Market Share
12.2.4. APAC Company Market Share
12.3. Competitive Situations and Trends
12.3.1. Product Launches and Developments
12.3.2. Partnerships, Collaborations, and Agreements
12.3.3. Mergers & Acquisitions
12.3.4. Expansions
13. Company Profiles
13.1. ADATA
13.1.1. Business Overview
13.1.2. Company Snapshot
13.1.3. Company Market Share Analysis
13.1.4. Company Product Portfolio
13.1.5. Recent Developments
13.1.6. SWOT Analysis
13.2. Ambrane India Private Limited
13.2.1. Business Overview
13.2.2. Company Snapshot
13.2.3. Company Market Share Analysis
13.2.4. Company Product Portfolio
13.2.5. Recent Developments
13.2.6. SWOT Analysis
13.3. Anker Innovations
13.3.1. Business Overview
13.3.2. Company Snapshot
13.3.3. Company Market Share Analysis
13.3.4. Company Product Portfolio
13.3.5. Recent Developments
13.3.6. SWOT Analysis
13.4. AsusTeK Computer Inc.
13.4.1. Business Overview
13.4.2. Company Snapshot
13.4.3. Company Market Share Analysis
13.4.4. Company Product Portfolio
13.4.5. Recent Developments
13.4.6. SWOT Analysis
13.5. AUKEY
13.5.1. Business Overview
13.5.2. Company Snapshot
13.5.3. Company Market Share Analysis
13.5.4. Company Product Portfolio
13.5.5. Recent Developments
13.5.6. SWOT Analysis
13.6. GRIFFIN
13.6.1. Business Overview
13.6.2. Company Snapshot
13.6.3. Company Market Share Analysis
13.6.4. Company Product Portfolio
13.6.5. Recent Developments
13.6.6. SWOT Analysis
13.7. Intex Technologies
13.7.1. Business Overview
13.7.2. Company Snapshot
13.7.3. Company Market Share Analysis
13.7.4. Company Product Portfolio
13.7.5. Recent Developments
13.7.6. SWOT Analysis
13.8. Lenovo Group Ltd.
13.8.1. Business Overview
13.8.2. Company Snapshot
13.8.3. Company Market Share Analysis
13.8.4. Company Product Portfolio
13.8.5. Recent Developments
13.8.6. SWOT Analysis
13.9. Microsoft Corporation
13.9.1. Business Overview
13.9.2. Company Snapshot
13.9.3. Company Market Share Analysis
13.9.4. Company Product Portfolio
13.9.5. Recent Developments
13.9.6. SWOT Analysis
13.10. mophie
13.10.1. Business Overview
13.10.2. Company Snapshot
13.10.3. Company Market Share Analysis
13.10.4. Company Product Portfolio
13.10.5. Recent Developments
13.10.6. SWOT Analysis
13.11. Panasonic Corporation
13.11.1. Business Overview
13.11.2. Company Snapshot
13.11.3. Company Market Share Analysis
13.11.4. Company Product Portfolio
13.11.5. Recent Developments
13.11.6. SWOT Analysis
13.12. RAVPower
13.12.1. Business Overview
13.12.2. Company Snapshot
13.12.3. Company Market Share Analysis
13.12.4. Company Product Portfolio
13.12.5. Recent Developments
13.12.6. SWOT Analysis
13.13. Sony Corporation
13.13.1. Business Overview
13.13.2. Company Snapshot
13.13.3. Company Market Share Analysis
13.13.4. Company Product Portfolio
13.13.5. Recent Developments
13.13.6. SWOT Analysis
13.14. Xiaomi
13.14.1. Business Overview
13.14.2. Company Snapshot
13.14.3. Company Market Share Analysis
13.14.4. Company Product Portfolio
13.14.5. Recent Developments
13.14.6. SWOT Analysis
List of Table
1. Global Power Bank Market, By Capacity Range, 2019-2032 (USD Billion) (Units)
2. Global 1,000–5,000 mAh Power Bank Market, By Region, 2019-2032 (USD Billion) (Units)
3. Global 5,001–10,000 mAh Power Bank Market, By Region, 2019-2032 (USD Billion) (Units)
4. Global 10,001–15,000 mAh Power Bank Market, By Region, 2019-2032 (USD Billion) (Units)
5. Global 15,001–20,000 mAh Power Bank Market, By Region, 2019-2032 (USD Billion) (Units)
6. Global Above 20,001 mAh Power Bank Market, By Region, 2019-2032 (USD Billion) (Units)
7. Global Power Bank Market, By Energy Source, 2019-2032 (USD Billion) (Units)
8. Global Electric Power Bank Market, By Region, 2019-2032 (USD Billion) (Units)
9. Global Solar Power Bank Market, By Region, 2019-2032 (USD Billion) (Units)
10. Global Power Bank Market, By Battery Type, 2019-2032 (USD Billion) (Units)
11. Global Lithium - Ion Batteries Power Bank Market, By Region, 2019-2032 (USD Billion) (Units)
12. Global Lithium Polymer Batteries Power Bank Market, By Region, 2019-2032 (USD Billion) (Units)
13. Global Power Bank Market, By Application, 2019-2032 (USD Billion) (Units)
14. Global Smartphone Power Bank Market, By Region, 2019-2032 (USD Billion) (Units)
15. Global Tablet Power Bank Market, By Region, 2019-2032 (USD Billion) (Units)
16. Global Laptop Power Bank Market, By Region, 2019-2032 (USD Billion) (Units)
17. Global Wearable Device Power Bank Market, By Region, 2019-2032 (USD Billion) (Units)
18. Global Digital Camera Power Bank Market, By Region, 2019-2032 (USD Billion) (Units)
19. Global Portable Media Device Power Bank Market, By Region, 2019-2032 (USD Billion) (Units)
20. Global Others Power Bank Market, By Region, 2019-2032 (USD Billion) (Units)
21. Global Power Bank Market, By Distribution Channel, 2019-2032 (USD Billion) (Units)
22. Global E-commerce Power Bank Market, By Region, 2019-2032 (USD Billion) (Units)
23. Global Brick And Mortar Power Bank Market, By Region, 2019-2032 (USD Billion) (Units)
24. Global Power Bank Market, By Region, 2019-2032 (USD Billion) (Units)
25. Global Power Bank Market, By North America, 2019-2032 (USD Billion) (Units)
26. North America Power Bank Market, By Capacity Range, 2019-2032 (USD Billion) (Units)
27. North America Power Bank Market, By Energy Source, 2019-2032 (USD Billion) (Units)
28. North America Power Bank Market, By Battery Type, 2019-2032 (USD Billion) (Units)
29. North America Power Bank Market, By Application, 2019-2032 (USD Billion) (Units)
30. North America Power Bank Market, By Distribution Channel, 2019-2032 (USD Billion) (Units)
31. U.S. Power Bank Market, By Capacity Range, 2019-2032 (USD Billion) (Units)
32. U.S. Power Bank Market, By Energy Source, 2019-2032 (USD Billion) (Units)
33. U.S. Power Bank Market, By Battery Type, 2019-2032 (USD Billion) (Units)
34. U.S. Power Bank Market, By Application, 2019-2032 (USD Billion) (Units)
35. U.S. Power Bank Market, By Distribution Channel, 2019-2032 (USD Billion) (Units)
36. Canada Power Bank Market, By Capacity Range, 2019-2032 (USD Billion) (Units)
37. Canada Power Bank Market, By Energy Source, 2019-2032 (USD Billion) (Units)
38. Canada Power Bank Market, By Battery Type, 2019-2032 (USD Billion) (Units)
39. Canada Power Bank Market, By Application, 2019-2032 (USD Billion) (Units)
40. Canada Power Bank Market, By Distribution Channel, 2019-2032 (USD Billion) (Units)
41. Mexico Power Bank Market, By Capacity Range, 2019-2032 (USD Billion) (Units)
42. Mexico Power Bank Market, By Energy Source, 2019-2032 (USD Billion) (Units)
43. Mexico Power Bank Market, By Battery Type, 2019-2032 (USD Billion) (Units)
44. Mexico Power Bank Market, By Application, 2019-2032 (USD Billion) (Units)
45. Mexico Power Bank Market, By Distribution Channel, 2019-2032 (USD Billion) (Units)
46. Europe Power Bank Market, By Capacity Range, 2019-2032 (USD Billion) (Units)
47. Europe Power Bank Market, By Energy Source, 2019-2032 (USD Billion) (Units)
48. Europe Power Bank Market, By Battery Type, 2019-2032 (USD Billion) (Units)
49. Europe Power Bank Market, By Application, 2019-2032 (USD Billion) (Units)
50. Europe Power Bank Market, By Distribution Channel, 2019-2032 (USD Billion) (Units)
51. Germany Power Bank Market, By Capacity Range, 2019-2032 (USD Billion) (Units)
52. Germany Power Bank Market, By Energy Source, 2019-2032 (USD Billion) (Units)
53. Germany Power Bank Market, By Battery Type, 2019-2032 (USD Billion) (Units)
54. Germany Power Bank Market, By Application, 2019-2032 (USD Billion) (Units)
55. Germany Power Bank Market, By Distribution Channel, 2019-2032 (USD Billion) (Units)
56. France Power Bank Market, By Capacity Range, 2019-2032 (USD Billion) (Units)
57. France Power Bank Market, By Energy Source, 2019-2032 (USD Billion) (Units)
58. France Power Bank Market, By Battery Type, 2019-2032 (USD Billion) (Units)
59. France Power Bank Market, By Application, 2019-2032 (USD Billion) (Units)
60. France Power Bank Market, By Distribution Channel, 2019-2032 (USD Billion) (Units)
61. U.K. Power Bank Market, By Capacity Range, 2019-2032 (USD Billion) (Units)
62. U.K. Power Bank Market, By Energy Source, 2019-2032 (USD Billion) (Units)
63. U.K. Power Bank Market, By Battery Type, 2019-2032 (USD Billion) (Units)
64. U.K. Power Bank Market, By Application, 2019-2032 (USD Billion) (Units)
65. U.K. Power Bank Market, By Distribution Channel, 2019-2032 (USD Billion) (Units)
66. Italy Power Bank Market, By Capacity Range, 2019-2032 (USD Billion) (Units)
67. Italy Power Bank Market, By Energy Source, 2019-2032 (USD Billion) (Units)
68. Italy Power Bank Market, By Battery Type, 2019-2032 (USD Billion) (Units)
69. Italy Power Bank Market, By Application, 2019-2032 (USD Billion) (Units)
70. Italy Power Bank Market, By Distribution Channel, 2019-2032 (USD Billion) (Units)
71. Spain Power Bank Market, By Capacity Range, 2019-2032 (USD Billion) (Units)
72. Spain Power Bank Market, By Energy Source, 2019-2032 (USD Billion) (Units)
73. Spain Power Bank Market, By Battery Type, 2019-2032 (USD Billion) (Units)
74. Spain Power Bank Market, By Application, 2019-2032 (USD Billion) (Units)
75. Spain Power Bank Market, By Distribution Channel, 2019-2032 (USD Billion) (Units)
76. Asia Pacific Power Bank Market, By Capacity Range, 2019-2032 (USD Billion) (Units)
77. Asia Pacific Power Bank Market, By Energy Source, 2019-2032 (USD Billion) (Units)
78. Asia Pacific Power Bank Market, By Battery Type, 2019-2032 (USD Billion) (Units)
79. Asia Pacific Power Bank Market, By Application, 2019-2032 (USD Billion) (Units)
80. Asia Pacific Power Bank Market, By Distribution Channel, 2019-2032 (USD Billion) (Units)
81. Japan Power Bank Market, By Capacity Range, 2019-2032 (USD Billion) (Units)
82. Japan Power Bank Market, By Energy Source, 2019-2032 (USD Billion) (Units)
83. Japan Power Bank Market, By Battery Type, 2019-2032 (USD Billion) (Units)
84. Japan Power Bank Market, By Application, 2019-2032 (USD Billion) (Units)
85. Japan Power Bank Market, By Distribution Channel, 2019-2032 (USD Billion) (Units)
86. China Power Bank Market, By Capacity Range, 2019-2032 (USD Billion) (Units)
87. China Power Bank Market, By Energy Source, 2019-2032 (USD Billion) (Units)
88. China Power Bank Market, By Battery Type, 2019-2032 (USD Billion) (Units)
89. China Power Bank Market, By Application, 2019-2032 (USD Billion) (Units)
90. China Power Bank Market, By Distribution Channel, 2019-2032 (USD Billion) (Units)
91. India Power Bank Market, By Capacity Range, 2019-2032 (USD Billion) (Units)
92. India Power Bank Market, By Energy Source, 2019-2032 (USD Billion) (Units)
93. India Power Bank Market, By Battery Type, 2019-2032 (USD Billion) (Units)
94. India Power Bank Market, By Application, 2019-2032 (USD Billion) (Units)
95. India Power Bank Market, By Distribution Channel, 2019-2032 (USD Billion) (Units)
96. South America Power Bank Market, By Capacity Range, 2019-2032 (USD Billion) (Units)
97. South America Power Bank Market, By Energy Source, 2019-2032 (USD Billion) (Units)
98. South America Power Bank Market, By Battery Type, 2019-2032 (USD Billion) (Units)
99. South America Power Bank Market, By Application, 2019-2032 (USD Billion) (Units)
100. South America Power Bank Market, By Distribution Channel, 2019-2032 (USD Billion) (Units)
101. Brazil Power Bank Market, By Capacity Range, 2019-2032 (USD Billion) (Units)
102. Brazil Power Bank Market, By Energy Source, 2019-2032 (USD Billion) (Units)
103. Brazil Power Bank Market, By Battery Type, 2019-2032 (USD Billion) (Units)
104. Brazil Power Bank Market, By Application, 2019-2032 (USD Billion) (Units)
105. Brazil Power Bank Market, By Distribution Channel, 2019-2032 (USD Billion) (Units)
106. Middle East and Africa Power Bank Market, By Capacity Range, 2019-2032 (USD Billion) (Units)
107. Middle East and Africa Power Bank Market, By Energy Source, 2019-2032 (USD Billion) (Units)
108. Middle East and Africa Power Bank Market, By Battery Type, 2019-2032 (USD Billion) (Units)
109. Middle East and Africa Power Bank Market, By Application, 2019-2032 (USD Billion) (Units)
110. Middle East and Africa Power Bank Market, By Distribution Channel, 2019-2032 (USD Billion) (Units)
111. UAE Power Bank Market, By Capacity Range, 2019-2032 (USD Billion) (Units)
112. UAE Power Bank Market, By Energy Source, 2019-2032 (USD Billion) (Units)
113. UAE Power Bank Market, By Battery Type, 2019-2032 (USD Billion) (Units)
114. UAE Power Bank Market, By Application, 2019-2032 (USD Billion) (Units)
115. UAE Power Bank Market, By Distribution Channel, 2019-2032 (USD Billion) (Units)
116. South Africa Power Bank Market, By Capacity Range, 2019-2032 (USD Billion) (Units)
117. South Africa Power Bank Market, By Energy Source, 2019-2032 (USD Billion) (Units)
118. South Africa Power Bank Market, By Battery Type, 2019-2032 (USD Billion) (Units)
119. South Africa Power Bank Market, By Application, 2019-2032 (USD Billion) (Units)
120. South Africa Power Bank Market, By Distribution Channel, 2019-2032 (USD Billion) (Units)
List of Figures
1. Global Power Bank Market Segmentation
2. Power Bank Market: Research Methodology
3. Market Size Estimation Methodology: Bottom-Up Approach
4. Market Size Estimation Methodology: Top-Down Approach
5. Data Triangulation
6. Porter’s Five Forces Analysis
7. Value Chain Analysis
8. Global Power Bank Market Attractiveness Analysis By Capacity Range
9. Global Power Bank Market Attractiveness Analysis By Energy Source
10. Global Power Bank Market Attractiveness Analysis By Battery Type
11. Global Power Bank Market Attractiveness Analysis By Application
12. Global Power Bank Market Attractiveness Analysis By Distribution Channel
13. Global Power Bank Market Attractiveness Analysis By Region
14. Global Power Bank Market: Dynamics
15. Global Power Bank Market Share by Capacity Range (2023 & 2032)
16. Global Power Bank Market Share by Energy Source (2023 & 2032)
17. Global Power Bank Market Share By Battery Type (2023 & 2032)
18. Global Power Bank Market Share by Application (2023 & 2032)
19. Global Power Bank Market Share by Distribution Channel (2023 & 2032)
20. Global Power Bank Market Share by Regions (2023 & 2032)
21. Global Power Bank Market Share by Company (2022)
This study forecasts revenue at global, regional, and country levels from 2019 to 2032. The Brainy Insights has segmented the global power bank market on the basis of below mentioned segments:
Global Power Bank Market by Capacity Range:
Global Power Bank Market by Energy Source:
Global Power Bank Market by Battery Type:
Global Power Bank Market by Application:
Global Power Bank Market by Distribution Channel:
Global Power Bank Market by Region:
Research has its special purpose to undertake marketing efficiently. In this competitive scenario, businesses need information across all industry verticals; the information about customer wants, market demand, competition, industry trends, distribution channels etc. This information needs to be updated regularly because businesses operate in a dynamic environment. Our organization, The Brainy Insights incorporates scientific and systematic research procedures in order to get proper market insights and industry analysis for overall business success. The analysis consists of studying the market from a miniscule level wherein we implement statistical tools which helps us in examining the data with accuracy and precision.
Our research reports feature both; quantitative and qualitative aspects for any market. Qualitative information for any market research process are fundamental because they reveal the customer needs and wants, usage and consumption for any product/service related to a specific industry. This in turn aids the marketers/investors in knowing certain perceptions of the customers. Qualitative research can enlighten about the different product concepts and designs along with unique service offering that in turn, helps define marketing problems and generate opportunities. On the other hand, quantitative research engages with the data collection process through interviews, e-mail interactions, surveys and pilot studies. Quantitative aspects for the market research are useful to validate the hypotheses generated during qualitative research method, explore empirical patterns in the data with the help of statistical tools, and finally make the market estimations.
The Brainy Insights offers comprehensive research and analysis, based on a wide assortment of factual insights gained through interviews with CXOs and global experts and secondary data from reliable sources. Our analysts and industry specialist assume vital roles in building up statistical tools and analysis models, which are used to analyse the data and arrive at accurate insights with exceedingly informative research discoveries. The data provided by our organization have proven precious to a diverse range of companies, facilitating them to address issues such as determining which products/services are the most appealing, whether or not customers use the product in the manner anticipated, the purchasing intentions of the market and many others.
Our research methodology encompasses an idyllic combination of primary and secondary initiatives. Key phases involved in this process are listed below:

The phase involves the gathering and collecting of market data and its related information with the help of different sources & research procedures.

The data procurement stage involves in data gathering and collecting through various data sources.
This stage involves in extensive research. These data sources includes:
Purchased Database: Purchased databases play a crucial role in estimating the market sizes irrespective of the domain. Our purchased database includes:
Primary Research: The Brainy Insights interacts with leading companies and experts of the concerned domain to develop the analyst team’s market understanding and expertise. It improves and substantiates every single data presented in the market reports. Primary research mainly involves in telephonic interviews, E-mail interactions and face-to-face interviews with the raw material providers, manufacturers/producers, distributors, & independent consultants. The interviews that we conduct provides valuable data on market size and industry growth trends prevailing in the market. Our organization also conducts surveys with the various industry experts in order to gain overall insights of the industry/market. For instance, in healthcare industry we conduct surveys with the pharmacists, doctors, surgeons and nurses in order to gain insights and key information of a medical product/device/equipment which the customers are going to usage. Surveys are conducted in the form of questionnaire designed by our own analyst team. Surveys plays an important role in primary research because surveys helps us to identify the key target audiences of the market. Additionally, surveys helps to identify the key target audience engaged with the market. Our survey team conducts the survey by targeting the key audience, thus gaining insights from them. Based on the perspectives of the customers, this information is utilized to formulate market strategies. Moreover, market surveys helps us to understand the current competitive situation of the industry. To be precise, our survey process typically involve with the 360 analysis of the market. This analytical process begins by identifying the prospective customers for a product or service related to the market/industry to obtain data on how a product/service could fit into customers’ lives.

Secondary Research: The secondary data sources includes information published by the on-profit organizations such as World bank, WHO, company fillings, investor presentations, annual reports, national government documents, statistical databases, blogs, articles, white papers and others. From the annual report, we analyse a company’s revenue to understand the key segment and market share of that organization in a particular region. We analyse the company websites and adopt the product mapping technique which is important for deriving the segment revenue. In the product mapping method, we select and categorize the products offered by the companies catering to domain specific market, deduce the product revenue for each of the companies so as to get overall estimation of the market size. We also source data and analyses trends based on information received from supply side and demand side intermediaries in the value chain. The supply side denotes the data gathered from supplier, distributor, wholesaler and the demand side illustrates the data gathered from the end customers for respective market domain.

The supply side for a domain specific market is analysed by:
The demand side for the market is estimated through:
In-house Library: Apart from these third-party sources, we have our in-house library of qualitative and quantitative information. Our in-house database includes market data for various industry and domains. These data are updated on regular basis as per the changing market scenario. Our library includes, historic databases, internal audit reports and archives.
Sometimes there are instances where there is no metadata or raw data available for any domain specific market. For those cases, we use our expertise to forecast and estimate the market size in order to generate comprehensive data sets. Our analyst team adopt a robust research technique in order to produce the estimates:
Data Synthesis: This stage involves the analysis & mapping of all the information obtained from the previous step. It also involves in scrutinizing the data for any discrepancy observed while data gathering related to the market. The data is collected with consideration to the heterogeneity of sources. Robust scientific techniques are in place for synthesizing disparate data sets and provide the essential contextual information that can orient market strategies. The Brainy Insights has extensive experience in data synthesis where the data passes through various stages:


Market Deduction & Formulation: The final stage comprises of assigning data points at appropriate market spaces so as to deduce feasible conclusions. Analyst perspective & subject matter expert based holistic form of market sizing coupled with industry analysis also plays a crucial role in this stage.
This stage involves in finalization of the market size and numbers that we have collected from data integration step. With data interpolation, it is made sure that there is no gap in the market data. Successful trend analysis is done by our analysts using extrapolation techniques, which provide the best possible forecasts for the market.
Data Validation & Market Feedback: Validation is the most important step in the process. Validation & re-validation via an intricately designed process helps us finalize data-points to be used for final calculations.

The Brainy Insights interacts with leading companies and experts of the concerned domain to develop the analyst team’s market understanding and expertise. It improves and substantiates every single data presented in the market reports. The data validation interview and discussion panels are typically composed of the most experienced industry members. The participants include, however, are not limited to:
Moreover, we always validate our data and findings through primary respondents from all the major regions we are working on.


Free Customization
Fortune 500 Clients
Free Yearly Update On Purchase Of Multi/Corporate License
Companies Served Till Date