- +1-315-215-1633
- sales@thebrainyinsights.com

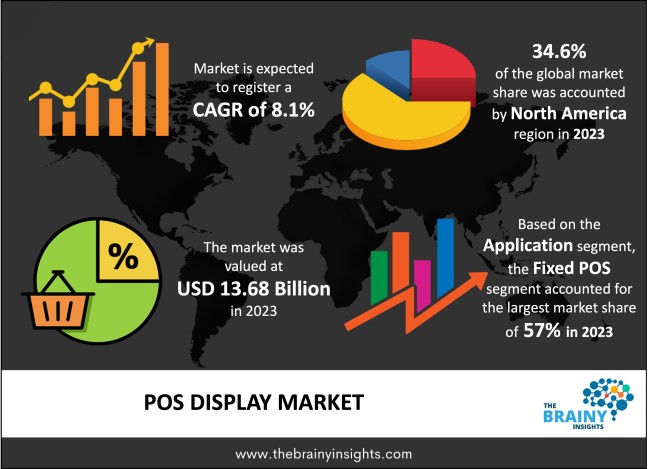
The global POS display market is expected to reach USD 29.81 billion by 2033, at a CAGR of 8.1% from 2024 to 2033. POS display market growth would be driven by the increasing demand for digitization & automation of businesses, rising adoption of technology-driven branding & marketing strategies & the effective & appealing nature of the POS display model. The ultimate aim of POS is to enhance the sales figures of a showcased product, and this can be achieved through different mediums like shelf-edge displays, stand-alone units, floor models or counter showcases. The materials used in creating these promotional tools may vary from plastic to metal and cardboard, while their colorful designs complement the advertised merchandise on display. POS displays are primarily utilized to catch customers' eyes on newly released products, limited edition items, or seasonal specials. The design may captivate and engage customers and serve branding purposes to make a sale. Recently, POS display utilization has skyrocketed due to its affordable, cost-effective nature in advertising specific product(s) directly at purchase points, resulting in remarkable growth.
Sale can be defined as an exchange of goods or services for money. A buyer and a seller are involved in the transaction. Sale is the primary source of revenue for any company or business. Businesses survive and thrive majorly on sales of their goods and services. A sale would only occur when it satisfies the consumer's need or solves a problem for the consumer. Manufacturers, suppliers, retailers & other vendors apply various strategies to increase sales, retain customers and acquire market share. Some of the techniques employed to increase sales are expanding overseas, introducing new products/services, discount offers, improving consumer outreach, & enhancing marketing activities. The point of sale is where the monetary exchange between the seller and buyer takes place. It is, however, not necessary that the transaction has to take place physically; it can take place online as well. The receipt or proof of trade can be generated electronically or printed accordingly. In short, the cash counter in a supermarket/hypermarket can be called a point of sale (POS). The display of products near the point of sale to attract consumers' attention or nudge the consumers towards the impulsive purchase of the product is called a POS display. POS display is a custom display of productsplaced near checkout counters with an appealing aesthetic to increase company sales. Point of sale display provides exclusive space for brands to display their new or updated products with their features, offers, other benefits & discounts, all away from the cramped space with other competitors on regular shelves. Dummy packs, display packs, counter display units, free-standing display units, and shelf edging are some point-of-sale display types. The customizable, engaging, expressive, aesthetic, attractive, & informational nature of point-of-sale displays helps increasesales for the brand. Employees are not needed for this marketing strategy which reduces costs and any human errors that might occur while promoting the product. These features and benefits of the point-of-sale display are increasing the adoption of the POS display across brands and driving the global POS display market.
Get an overview of this study by requesting a free sample
The increasing number of market players in various industries is making these markets highly fragmented. Market players deploy effective marketing strategies to retain the consumer base and increase market share. POS display is one such effective strategy that can help increase the visibility of products or services and thereby drive the brand's sales to ensure its dominance in its respective sector. POS displays allow brands to have an exclusive space away from competitors providing a greater chance for the brand to further its products and sales by capturing the attention of consumers.
As mentioned earlier, the increasing number of market players across sectors has created a fragmented market. Extensive capital is spent on branding, promoting & marketing products & services to retain the customer base in the fragmented market. The limited POS display space and the rising competition have led to a supply-demand deficit, i.e., the demand for POS display space is very high compared to the available space. When demand is high and supply is low, it increases the price of the commodity. The rising costs of implementing POS displays can hamper the growth of the market.
POS display manufacturers invest substantially to develop new touch screen technology or surface acoustic web technology. The surface acoustic wave technology improves screens' visibility, clarity, and durability, making them more attractive & appealing. The rising demand for acoustic surface wave tech to attract more consumers owing to its clarity and the high-definition display will provide lucrative opportunities for the POS display market in the forecast period. Innovations to develop POS displays that utilize less space, offer better graphics, or create rotating die-cut POS displays will also aid the growth of the global POS display market. Retailers have increasingly adopted POS display models to attract customers and increase sales to compete with the growing online distributing platforms.
The covid 19 pandemic led to significant changes in the purchasing habits of the population to cope with the new normal of social distancing & regular sanitization. An increasing number of buyers were gravitating towards online shopping as it was more convenient, easy, & ensured social distancing with features like contactless delivery. The trend of online shopping has continued and is increasing globally, taking away the market of retail chains or brick-or-mortars. The growing online business will challenge POS displays in retail chains, supermarkets, or hypermarkets.
The global POS display market has been segmented based on application, end-user, and regions.
The regions analyzed for the market include North America, Europe, South America, Asia Pacific, the Middle East, and Africa. North America emerged as the largest market for the global POS Display market, with a 34.6% share of the market revenue in 2023.
North America region POS Display Market Share in 2023 - 34.6%
www.thebrainyinsights.com
Check the geographical analysis of this market by requesting a free sample
The key players are now concentrating on implementing strategies such as adopting new technology, product innovations, mergers & acquisitions, joint venture, alliances, and partnerships to improve their market position in the global POS display industry.
A Dutch paper & recycling manufacturer Reparenco was acquired by Smurfit Kappa for USD 533 million. Smurfit Kappa is an Irish company. The acquisition aimed to increase the business's global footprint by increasing business integration and facilitating strategic synergies.
As per The Brainy Insights, the size of the POS display market was valued at USD 13.68 billion in 2023 to USD 29.81 billion by 2033.
Global POS display market is growing at a CAGR of 8.1% during the forecast period 2024-2033.
The global POS display market has been segmented based on application, end user, and regions. The fixed POS segment led the market in 2023. The restaurant segment is projected to witness highest growth during the forecast period.
North America region emerged as the largest market for the POS Display.
The market's growth will be influenced by the rising demand for POS display systems by sellers.
The high initial costs of implementing POS display could hamper the market growth.
Increasing investments in POS display technology will provide huge opportunities to the market.
Key players are Lightspeed Retail, Clover, Smurfit Kappa PLC, NCR Corporation, Duet, PAR Technology Corporation, ShopKeep, Agilysys Inc., Toast Inc., and Vend.
1. Introduction
1.1. Objectives of the Study
1.2. Market Definition
1.3. Research Scope
1.4. Currency
1.5. Key Target Audience
2. Research Methodology and Assumptions
3. Executive Summary
4. Premium Insights
4.1. Porter’s Five Forces Analysis
4.2. Value Chain Analysis
4.3. Top Investment Pockets
4.3.1. Market Attractiveness Analysis by Application
4.3.2. Market Attractiveness Analysis by End User
4.3.3. Market Attractiveness Analysis by Region
4.4. Industry Trends
5. Market Dynamics
5.1. Market Evaluation
5.2. Drivers
5.2.1. The rising demand for POS display systems by sellers
5.3. Restraints
5.3.1. High initial costs of implementing POS display
5.4. Opportunities
5.4.1. Increasing investments in POS display technology
5.5. Challenges
5.5.1. Growing trend of online shopping
6. Global POS Display Market Analysis and Forecast, By Application
6.1. Segment Overview
6.2. Fixed POS
6.3. Mobile POS
7. Global POS Display Market Analysis and Forecast, By End User
7.1. Segment Overview
7.2. Retail
7.3. Hospitality
7.4. Entertainment
7.5. Restaurant
7.6. Warehouse
7.7. Healthcare
7.8. Others
8. Global POS Display Market Analysis and Forecast, By Regional Analysis
8.1. Segment Overview
8.2. North America
8.2.1. U.S.
8.2.2. Canada
8.2.3. Mexico
8.3. Europe
8.3.1. Germany
8.3.2. France
8.3.3. U.K.
8.3.4. Italy
8.3.5. Spain
8.4. Asia-Pacific
8.4.1. Japan
8.4.2. China
8.4.3. India
8.5. South America
8.5.1. Brazil
8.6. Middle East and Africa
8.6.1. UAE
8.6.2. South Africa
9. Global POS Display Market-Competitive Landscape
9.1. Overview
9.2. Market Share of Key Players in the POS Display Market
9.2.1. Global Company Market Share
9.2.2. North America Company Market Share
9.2.3. Europe Company Market Share
9.2.4. APAC Company Market Share
9.3. Competitive Situations and Trends
9.3.1. Product Launches and Developments
9.3.2. Partnerships, Collaborations, and Agreements
9.3.3. Mergers & Acquisitions
9.3.4. Expansions
10. Company Profiles
10.1. Lightspeed Retail
10.1.1. Business Overview
10.1.2. Company Snapshot
10.1.3. Company Market Share Analysis
10.1.4. Company Product Portfolio
10.1.5. Recent Developments
10.1.6. SWOT Analysis
10.2. Clover
10.2.1. Business Overview
10.2.2. Company Snapshot
10.2.3. Company Market Share Analysis
10.2.4. Company Product Portfolio
10.2.5. Recent Developments
10.2.6. SWOT Analysis
10.3. Smurfit Kappa PLC
10.3.1. Business Overview
10.3.2. Company Snapshot
10.3.3. Company Market Share Analysis
10.3.4. Company Product Portfolio
10.3.5. Recent Developments
10.3.6. SWOT Analysis
10.4. NCR Corporation
10.4.1. Business Overview
10.4.2. Company Snapshot
10.4.3. Company Market Share Analysis
10.4.4. Company Product Portfolio
10.4.5. Recent Developments
10.4.6. SWOT Analysis
10.5. Duet
10.5.1. Business Overview
10.5.2. Company Snapshot
10.5.3. Company Market Share Analysis
10.5.4. Company Product Portfolio
10.5.5. Recent Developments
10.5.6. SWOT Analysis
10.6. PAR Technology Corporation
10.6.1. Business Overview
10.6.2. Company Snapshot
10.6.3. Company Market Share Analysis
10.6.4. Company Product Portfolio
10.6.5. Recent Developments
10.6.6. SWOT Analysis
10.7. ShopKeep
10.7.1. Business Overview
10.7.2. Company Snapshot
10.7.3. Company Market Share Analysis
10.7.4. Company Product Portfolio
10.7.5. Recent Developments
10.7.6. SWOT Analysis
10.8. Agilysys Inc.
10.8.1. Business Overview
10.8.2. Company Snapshot
10.8.3. Company Market Share Analysis
10.8.4. Company Product Portfolio
10.8.5. Recent Developments
10.8.6. SWOT Analysis
10.9. Toast Inc.
10.9.1. Business Overview
10.9.2. Company Snapshot
10.9.3. Company Market Share Analysis
10.9.4. Company Product Portfolio
10.9.5. Recent Developments
10.9.6. SWOT Analysis
10.10. Vend
10.10.1. Business Overview
10.10.2. Company Snapshot
10.10.3. Company Market Share Analysis
10.10.4. Company Component Portfolio
10.10.5. Recent Developments
10.10.6. SWOT Analysis
List of Table
1. Global POS Display Market, By Application, 2020-2033 (USD Billion)
2. Global Fixed POS Display Market, By Region, 2020-2033 (USD Billion)
3. Global Mobile POS Display Market, By Region, 2020-2033 (USD Billion)
4. Global POS Display Market, By End User, 2020-2033 (USD Billion)
5. Global Retail Display Market, By Region, 2020-2033 (USD Billion)
6. Global Hospitality POS Display Market, By Region, 2020-2033 (USD Billion)
7. Global Entertainment POS Display Market, By Region, 2020-2033 (USD Billion)
8. Global Restaurant POS Display Market, By Region, 2020-2033 (USD Billion)
9. Global Warehouse POS Display Market, By Region, 2020-2033 (USD Billion)
10. Global Healthcare POS Display Market, By Region, 2020-2033 (USD Billion)
11. Global Others POS Display Market, By Region, 2020-2033 (USD Billion)
12. Global POS Display Market, By Region, 2020-2033 (USD Billion)
13. North America POS Display Market, By Application, 2020-2033 (USD Billion)
14. North America POS Display Market, By End User, 2020-2033 (USD Billion)
15. U.S. POS Display Market, By Application, 2020-2033 (USD Billion)
16. U.S. POS Display Market, By End User, 2020-2033 (USD Billion)
17. Canada POS Display Market, By Application, 2020-2033 (USD Billion)
18. Canada POS Display Market, By End User, 2020-2033 (USD Billion)
19. Mexico POS Display Market, By Application, 2020-2033 (USD Billion)
20. Mexico POS Display Market, By End User, 2020-2033 (USD Billion)
21. Europe POS Display Market, By Application, 2020-2033 (USD Billion)
22. Europe POS Display Market, By End User, 2020-2033 (USD Billion)
23. Germany POS Display Market, By Application, 2020-2033 (USD Billion)
24. Germany POS Display Market, By End User, 2020-2033 (USD Billion)
25. France POS Display Market, By Application, 2020-2033 (USD Billion)
26. France POS Display Market, By End User, 2020-2033 (USD Billion)
27. U.K. POS Display Market, By Application, 2020-2033 (USD Billion)
28. U.K. POS Display Market, By End User, 2020-2033 (USD Billion)
29. Italy POS Display Market, By Application, 2020-2033 (USD Billion)
30. Italy POS Display Market, By End User, 2020-2033 (USD Billion)
31. Spain POS Display Market, By Application, 2020-2033 (USD Billion)
32. Spain POS Display Market, By End User, 2020-2033 (USD Billion)
33. Asia Pacific POS Display Market, By Application, 2020-2033 (USD Billion)
34. Asia Pacific POS Display Market, By End User, 2020-2033 (USD Billion)
35. Japan POS Display Market, By Application, 2020-2033 (USD Billion)
36. Japan POS Display Market, By End User, 2020-2033 (USD Billion)
37. China POS Display Market, By Application, 2020-2033 (USD Billion)
38. China POS Display Market, By End User, 2020-2033 (USD Billion)
39. India POS Display Market, By Application, 2020-2033 (USD Billion)
40. India POS Display Market, By End User, 2020-2033 (USD Billion)
41. South America POS Display Market, By Application, 2020-2033 (USD Billion)
42. South America POS Display Market, By End User, 2020-2033 (USD Billion)
43. Brazil POS Display Market, By Application, 2020-2033 (USD Billion)
44. Brazil POS Display Market, By End User, 2020-2033 (USD Billion)
45. Middle East and Africa POS Display Market, By Application, 2020-2033 (USD Billion)
46. Middle East and Africa POS Display Market, By End User, 2020-2033 (USD Billion)
47. UAE POS Display Market, By Application, 2020-2033 (USD Billion)
48. UAE POS Display Market, By End User, 2020-2033 (USD Billion)
49. South Africa POS Display Market, By Application, 2020-2033 (USD Billion)
50. South Africa POS Display Market, By End User, 2020-2033 (USD Billion)
List of Figures
1. Global POS Display Market Segmentation
2. POS Display Market: Research Methodology
3. Market Size Estimation Methodology: Bottom-Up Approach
4. Market Size Estimation Methodology: Top-Down Approach
5. Data Triangulation
6. Porter’s Five Forces Analysis
7. Value Chain Analysis
8. Global POS Display Market Attractiveness Analysis by Application
9. Global POS Display Market Attractiveness Analysis by End User
10. Global POS Display Market Attractiveness Analysis by Region
11. Global POS Display Market: Dynamics
12. Global POS Display Market Share by Application (2023 & 2033)
13. Global POS Display Market Share by End User (2023 & 2033)
14. Global POS Display Market Share by End User (2023 & 2033)
15. Global POS Display Market Share by Regions (2023 & 2033)
16. Global POS Display Market Share by Company (2023)
This study forecasts revenue at global, regional, and country levels from 2020 to 2033. The Brainy Insights has segmented the global POS display market based on below mentioned segments:
Global POS Display Market by Application:
Global POS Display Market by End User:
Global POS Display Market by Region:
Research has its special purpose to undertake marketing efficiently. In this competitive scenario, businesses need information across all industry verticals; the information about customer wants, market demand, competition, industry trends, distribution channels etc. This information needs to be updated regularly because businesses operate in a dynamic environment. Our organization, The Brainy Insights incorporates scientific and systematic research procedures in order to get proper market insights and industry analysis for overall business success. The analysis consists of studying the market from a miniscule level wherein we implement statistical tools which helps us in examining the data with accuracy and precision.
Our research reports feature both; quantitative and qualitative aspects for any market. Qualitative information for any market research process are fundamental because they reveal the customer needs and wants, usage and consumption for any product/service related to a specific industry. This in turn aids the marketers/investors in knowing certain perceptions of the customers. Qualitative research can enlighten about the different product concepts and designs along with unique service offering that in turn, helps define marketing problems and generate opportunities. On the other hand, quantitative research engages with the data collection process through interviews, e-mail interactions, surveys and pilot studies. Quantitative aspects for the market research are useful to validate the hypotheses generated during qualitative research method, explore empirical patterns in the data with the help of statistical tools, and finally make the market estimations.
The Brainy Insights offers comprehensive research and analysis, based on a wide assortment of factual insights gained through interviews with CXOs and global experts and secondary data from reliable sources. Our analysts and industry specialist assume vital roles in building up statistical tools and analysis models, which are used to analyse the data and arrive at accurate insights with exceedingly informative research discoveries. The data provided by our organization have proven precious to a diverse range of companies, facilitating them to address issues such as determining which products/services are the most appealing, whether or not customers use the product in the manner anticipated, the purchasing intentions of the market and many others.
Our research methodology encompasses an idyllic combination of primary and secondary initiatives. Key phases involved in this process are listed below:

The phase involves the gathering and collecting of market data and its related information with the help of different sources & research procedures.

The data procurement stage involves in data gathering and collecting through various data sources.
This stage involves in extensive research. These data sources includes:
Purchased Database: Purchased databases play a crucial role in estimating the market sizes irrespective of the domain. Our purchased database includes:
Primary Research: The Brainy Insights interacts with leading companies and experts of the concerned domain to develop the analyst team’s market understanding and expertise. It improves and substantiates every single data presented in the market reports. Primary research mainly involves in telephonic interviews, E-mail interactions and face-to-face interviews with the raw material providers, manufacturers/producers, distributors, & independent consultants. The interviews that we conduct provides valuable data on market size and industry growth trends prevailing in the market. Our organization also conducts surveys with the various industry experts in order to gain overall insights of the industry/market. For instance, in healthcare industry we conduct surveys with the pharmacists, doctors, surgeons and nurses in order to gain insights and key information of a medical product/device/equipment which the customers are going to usage. Surveys are conducted in the form of questionnaire designed by our own analyst team. Surveys plays an important role in primary research because surveys helps us to identify the key target audiences of the market. Additionally, surveys helps to identify the key target audience engaged with the market. Our survey team conducts the survey by targeting the key audience, thus gaining insights from them. Based on the perspectives of the customers, this information is utilized to formulate market strategies. Moreover, market surveys helps us to understand the current competitive situation of the industry. To be precise, our survey process typically involve with the 360 analysis of the market. This analytical process begins by identifying the prospective customers for a product or service related to the market/industry to obtain data on how a product/service could fit into customers’ lives.

Secondary Research: The secondary data sources includes information published by the on-profit organizations such as World bank, WHO, company fillings, investor presentations, annual reports, national government documents, statistical databases, blogs, articles, white papers and others. From the annual report, we analyse a company’s revenue to understand the key segment and market share of that organization in a particular region. We analyse the company websites and adopt the product mapping technique which is important for deriving the segment revenue. In the product mapping method, we select and categorize the products offered by the companies catering to domain specific market, deduce the product revenue for each of the companies so as to get overall estimation of the market size. We also source data and analyses trends based on information received from supply side and demand side intermediaries in the value chain. The supply side denotes the data gathered from supplier, distributor, wholesaler and the demand side illustrates the data gathered from the end customers for respective market domain.

The supply side for a domain specific market is analysed by:
The demand side for the market is estimated through:
In-house Library: Apart from these third-party sources, we have our in-house library of qualitative and quantitative information. Our in-house database includes market data for various industry and domains. These data are updated on regular basis as per the changing market scenario. Our library includes, historic databases, internal audit reports and archives.
Sometimes there are instances where there is no metadata or raw data available for any domain specific market. For those cases, we use our expertise to forecast and estimate the market size in order to generate comprehensive data sets. Our analyst team adopt a robust research technique in order to produce the estimates:
Data Synthesis: This stage involves the analysis & mapping of all the information obtained from the previous step. It also involves in scrutinizing the data for any discrepancy observed while data gathering related to the market. The data is collected with consideration to the heterogeneity of sources. Robust scientific techniques are in place for synthesizing disparate data sets and provide the essential contextual information that can orient market strategies. The Brainy Insights has extensive experience in data synthesis where the data passes through various stages:


Market Deduction & Formulation: The final stage comprises of assigning data points at appropriate market spaces so as to deduce feasible conclusions. Analyst perspective & subject matter expert based holistic form of market sizing coupled with industry analysis also plays a crucial role in this stage.
This stage involves in finalization of the market size and numbers that we have collected from data integration step. With data interpolation, it is made sure that there is no gap in the market data. Successful trend analysis is done by our analysts using extrapolation techniques, which provide the best possible forecasts for the market.
Data Validation & Market Feedback: Validation is the most important step in the process. Validation & re-validation via an intricately designed process helps us finalize data-points to be used for final calculations.

The Brainy Insights interacts with leading companies and experts of the concerned domain to develop the analyst team’s market understanding and expertise. It improves and substantiates every single data presented in the market reports. The data validation interview and discussion panels are typically composed of the most experienced industry members. The participants include, however, are not limited to:
Moreover, we always validate our data and findings through primary respondents from all the major regions we are working on.


Free Customization
Fortune 500 Clients
Free Yearly Update On Purchase Of Multi/Corporate License
Companies Served Till Date