- +1-315-215-1633
- sales@thebrainyinsights.com

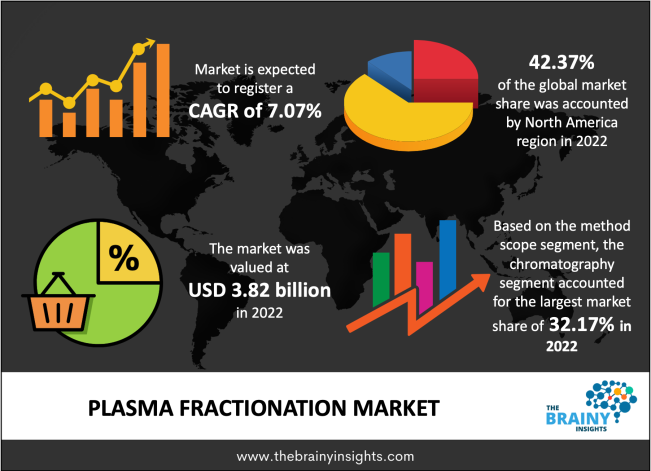
The global plasma fractionation market was valued at USD 28.66 billion in 2022, increasing at a CAGR of 7.07% from 2022 to 2030 and anticipated to reach USD 49.51 billion by 2030. North America is expected to grow the fastest during the forecast period. The rise in the use of alpha-1-antitrypsin and immunoglobulins in areas of medicine across the world is expected to drive market growth during the forecast period. Additionally, the growing off-label usage of critical plasma products such as immunoglobulins and albumins propels the market growth.
Plasma is one of the significant components of blood. Plasma is the straw-coloured liquid portion of blood in which all the blood cells are suspended. Plasma makes up roughly 55 % of a human's total blood volume. Plasma itself is primarily composed of water (92 per cent), solutes (1 per cent), and plasma proteins (7 per cent) like waste, electrolytes, and organic nutrients. Plasma fractionation is the manufacturing process utilized to transform plasma that has been voluntarily contributed into life-saving treatments. The fractionation method separates plasma proteins to create various plasma protein therapies. This is done by utilizing purification techniques such as filtration, centrifugation, precipitation, and separation. Plasma fractionation is a process that extracts secrets & purifies the proteins from human plasma. Plasma is an element of blood which is considered a source of different proteins. Plasma fractionation helps make products from secreted & purified plasma for multiple therapies and medication procedures. Also, multiple modern fractionation processes utilize alcohol concentrations, temperature, time, and pH to extract specific therapeutic proteins. Moreover, the growing technological sophistication over the years & the introduction of in-process viral reduction therapies have resulted in the development of new protein therapeutics & improved product quality & purity.
Get an overview of this study by requesting a free sample
For example, in April 2022- Octapharma AG partnered with local authorities to provide Ukrainian refugees with housing.
For example, in April 2020, Grifols Company launched a 3- ml vial of Hyper RAB, that is, rabies immune globulin in the plasma fractionation industry, to assist in treating rabies cases across the globe.
Improved research and development (R&D): The increased emphasis on R&D of new treatments and drugs for rare diseases is the driving factor of the market growth. Further, the market growth's driving factors are government funding and company investments in plasma therapy research activities. Also, the increasing number of patients suffering from rare autoimmune disorders worldwide is helping to propel the market growth. Additionally, the growing elderly population, the rising government awareness about plasma-derived products, and the government & private organizations working hard to inform patients about available & effective therapies are propelling the market growth.
The shortage of plasma proteins acts: The ever-increasing use of recombinant alternatives and the restricted medical reimbursement policies are restraining the market growth. Further, the emergence of recombinant products (which can be utilized as an alternative to plasma products) and recombinant therapies as an alternative to plasma-derived treatments are hampering the market growth.
The increasing prevalence of blood & respiratory disorders: The lifestyle involving alcohol, tobacco, and fast food is growing people's risk of inflammatory diseases, which is expected to offer market growth opportunities. Furthermore, a requirement for enabling these features in the field of molecular biology and associated healthcare practices is the driving factor of the market growth. Additionally, the increasing incidence of infectious respiratory diseases like influenza, tuberculosis, and RSV are also helping to propel the market growth. Moreover, technological advancements in diagnostic technology, and ever-increasing R&D investments by key participants, government, and nonprofit organizations for diagnostic testing are stimulating the market growth during the forecast period.
The regions analyzed for the market include Europe, South America, Asia Pacific, North America, the Middle East, and Africa. The Asia Pacific emerged as the largest market for the global plasma fractionation market, with a 42.37% share of the market revenue in 2022. The Asia Pacific dominates the plasma fractionation market due to the presence of governmental agencies that oversee and control plasma collection, fractionation, and sales. Also, the rising prevalence of hemophilia among nations like India & China that require the use of plasma fractionation products is helping to boost the market growth. Moreover, the increase in private & public funding for research & development, favourable government regulations, and the growing prevalence of target diseases with an ageing population with blood-related diseases are expected to propel the market growth in this region. Also, the presence of a large patient population, poor sanitization, and low awareness about plasma fractionation products among the people, the advances and established healthcare sector, the continuous innovations in treatment options for autoimmune diseases, and the rising prevalence of hemophilia and other medical disorders are anticipated to drive the market growth in this region. North America is expected to grow the fastest during the forecast period due to the ever-increasing demand for plasma fractionation products and the strong presence of key participants in the industry. In addition, a rise in healthcare awareness amongst people worldwide, an ageing population with blood-related disorders, and the increasing prevalence of respiratory diseases and AATD are also propelling the market growth in this region during the forecast period.
Asia-Pacific Region Plasma Fractionation Market Share in 2022 - 42.37%
www.thebrainyinsights.com
Check the geographical analysis of this market by requesting a free sample
The method scope segment is divided into chromatography, depth filtration, centrifugation, and others. The chromatography segment dominated, with a market share of around 32.17% in 2022. This growth is attributed to the new product launches and growing demand for chromatography techniques in environmental pollution laboratories. Further, by 2030, the centrifugation segment will likely dominate the market due to the advantages of centrifugation over membrane separation.
The product type segment is divided into immunoglobulins, albumin, protease inhibitors, coagulation factors, and others. In 2022, the immunoglobulins segment dominated the market with the largest market share of 28.13% and market revenue of 8.06 billion. This growth is attributed to the varied usage of immunoglobulin in several disorders, such as secondary and primary immune deficiencies, inflammatory diseases, and autoimmune diseases. Moreover, the increasing use of high-dose IgG products to treat autoimmune neurologic diseases is also helping to propel the segment's market growth. Additionally, immunoglobulins refer to glycoprotein molecules produced by plasma or white blood cells (WBCs). They are typically present in the cells & serum of the immune system & function as antibodies by explicitly identifying and binding antigens, such as viruses or bacteria, and aiding in their destruction. Further, by 2030, the albumin segment will likely dominate the market due to the wide applications of human albumin as a drug formulation agent, sealant in surgeries, vaccine ingredient, and coating for medical equipment & devices.
The end-user segment is divided into clinical research, hospitals & clinics, and others. In 2022, the hospitals & clinics segment dominated the market with the largest market share of 43.17% and market revenue of 12.37 billion. This growth is attributed to the ever-increasing use of plasma-based products in numerous therapy areas. Also, the risen off-label use of plasma fractionation products in hospitals to treat different diseases is helping to boost the segment's market growth. Further, by 2030, the clinical research segment will likely dominate the market due to the ever-increasing demand for advanced therapies such as personalized medicines.
The application segment is divided into hematology, neurology, oncology, pulmonology, immunology, and others. In 2022, the neurology segment dominated the market, accounting for around 23.12% of global revenue. This growth is attributed to the increasing prevalence of neurological disorders, the general use of plasma-derived products for therapy, and the growing R&D investments in neurological research. Further, by 2030, the immunology segment will likely dominate the market due to the increasing usage of plasma proteins in treating immune deficiencies.
| Attribute | Description |
|---|---|
| Market Size | Revenue (USD Billion) |
| Market size value in 2022 | USD 28.66 Billion |
| Market size value in 2030 | USD 49.51 Billion |
| CAGR (2022 to 2030) | 7.07% |
| Historical data | 2019-2020 |
| Base Year | 2021 |
| Forecast | 2022-2030 |
| Segments | Key Segments are method scope, product type, end-user, application, and regions |
| Regional Segments | The key regions are North America, South America, Europe, Asia Pacific, and Middle East & Africa. |
As per The Brainy Insights, the size of the plasma fractionation market was valued at USD 28.66 billion in 2022 to USD 49.51 billion by 2030.
Global plasma fractionation market is growing at a CAGR of 7.07% during the forecast period 2022-2030.
Asia-Pacific region emerged as the largest market for the plasma fractionation.
The market's growth will be influenced by the rising immunoglobulin consumption.
The high prices of plasma products could hamper the market growth.
The high growth potential in emerging countries will provide huge opportunities to the market.
1. Introduction
1.1. Objectives of the Study
1.2. Market Definition
1.3. Research Scope
1.4. Currency
1.5. Key Target Audience
2. Research Methodology and Assumptions
3. Executive Summary
4. Premium Insights
4.1. Porter’s Five Forces Analysis
4.2. Value Chain Analysis
4.3. Top Investment Pockets
4.3.1. Market Attractiveness Analysis By Method Scope
4.3.2. Market Attractiveness Analysis By Product Type
4.3.3. Market Attractiveness Analysis By End-User
4.3.4. Market Attractiveness Analysis By Application
4.3.5. Market Attractiveness Analysis By Region
4.4. Industry Trends
5. Market Dynamics
5.1. Market Evaluation
5.2. Drivers
5.2.1. The growing demand for chromatography techniques in environmental pollution laboratories
5.2.2. The high presence of several plasma collection centres
5.2.3. The growing prevalence of respiratory diseases and AATD
5.2.4. The rise in respiratory diseases worldwide
5.3. Restraints
5.3.1. The high prices of plasma products
5.3.2. The stringent government regulations regarding plasma therapies
5.3.3. The shortage of plasma proteins acts
5.4. Opportunities
5.4.1. The increasing prevalence of blood & respiratory disorders
5.4.2. The high growth potential in emerging countries
6. Global Plasma Fractionation Market Analysis and Forecast, By Method Scope
6.1. Segment Overview
6.2. Chromatography
6.3. Depth Filtration
6.4. Centrifugation
6.5. Others
7. Global Plasma Fractionation Market Analysis and Forecast, By Product Type
7.1. Segment Overview
7.2. Immunoglobulins
7.3. Albumin
7.4. Protease Inhibitors
7.5. Coagulation Factors
7.6. Others
8. Global Plasma Fractionation Market Analysis and Forecast, By End-User
8.1. Segment Overview
8.2. Clinical Research
8.3. Hospitals & Clinics
8.4. Others
9. Global Plasma Fractionation Market Analysis and Forecast, By Application
9.1. Segment Overview
9.2. Hematology
9.3. Neurology
9.4. Oncology
9.5. Pulmonology
9.6. Immunology
9.7. Others
10. Global Plasma Fractionation Market Analysis and Forecast, By Regional Analysis
10.1. Segment Overview
10.2. North America
10.2.1. U.S.
10.2.2. Canada
10.2.3. Mexico
10.3. Europe
10.3.1. Germany
10.3.2. France
10.3.3. U.K.
10.3.4. Italy
10.3.5. Spain
10.4. Asia-Pacific
10.4.1. Japan
10.4.2. China
10.4.3. India
10.5. South America
10.5.1. Brazil
10.6. Middle East and Africa
10.6.1. UAE
10.6.2. South Africa
11. Global Plasma Fractionation Market-Competitive Landscape
11.1. Overview
11.2. Market Share of Key Players in Global Plasma Fractionation Market
11.2.1. Global Company Market Share
11.2.2. North America Company Market Share
11.2.3. Europe Company Market Share
11.2.4. APAC Company Market Share
11.3. Competitive Situations and Trends
11.3.1. Product Launches and Developments
11.3.2. Partnerships, Collaborations, and Agreements
11.3.3. Mergers & Acquisitions
11.3.4. Expansions
12. Company Profiles
12.1. Biotest AG
12.1.1. Business Overview
12.1.2. Company Snapshot
12.1.3. Company Market Share Analysis
12.1.4. Company Product Portfolio
12.1.5. Recent Developments
12.1.6. SWOT Analysis
12.2. Bio Products Laboratory
12.2.1. Business Overview
12.2.2. Company Snapshot
12.2.3. Company Market Share Analysis
12.2.4. Company Product Portfolio
12.2.5. Recent Developments
12.2.6. SWOT Analysis
12.3. CSL Limited
12.3.1. Business Overview
12.3.2. Company Snapshot
12.3.3. Company Market Share Analysis
12.3.4. Company Product Portfolio
12.3.5. Recent Developments
12.3.6. SWOT Analysis
12.4. Grifols
12.4.1. Business Overview
12.4.2. Company Snapshot
12.4.3. Company Market Share Analysis
12.4.4. Company Product Portfolio
12.4.5. Recent Developments
12.4.6. SWOT Analysis
12.5. China Biologic Products Holdings Inc.
12.5.1. Business Overview
12.5.2. Company Snapshot
12.5.3. Company Market Share Analysis
12.5.4. Company Product Portfolio
12.5.5. Recent Developments
12.5.6. SWOT Analysis
12.6. Japan Blood Products Organization
12.6.1. Business Overview
12.6.2. Company Snapshot
12.6.3. Company Market Share Analysis
12.6.4. Company Product Portfolio
12.6.5. Recent Developments
12.6.6. SWOT Analysis
12.7. Green Cross Corporation
12.7.1. Business Overview
12.7.2. Company Snapshot
12.7.3. Company Market Share Analysis
12.7.4. Company Product Portfolio
12.7.5. Recent Developments
12.7.6. SWOT Analysis
12.8. Octapharma AG
12.8.1. Business Overview
12.8.2. Company Snapshot
12.8.3. Company Market Share Analysis
12.8.4. Company Product Portfolio
12.8.5. Recent Developments
12.8.6. SWOT Analysis
12.9. Merck KGaA
12.9.1. Business Overview
12.9.2. Company Snapshot
12.9.3. Company Market Share Analysis
12.9.4. Company Product Portfolio
12.9.5. Recent Developments
12.9.6. SWOT Analysis
12.10. Takeda Pharmaceutical Company Limited
12.10.1. Business Overview
12.10.2. Company Snapshot
12.10.3. Company Market Share Analysis
12.10.4. Company Product Portfolio
12.10.5. Recent Developments
12.10.6. SWOT Analysis
12.11. Shanghai RAAS
12.11.1. Business Overview
12.11.2. Company Snapshot
12.11.3. Company Market Share Analysis
12.11.4. Company Product Portfolio
12.11.5. Recent Developments
12.11.6. SWOT Analysis
12.12. LFB group
12.12.1. Business Overview
12.12.2. Company Snapshot
12.12.3. Company Market Share Analysis
12.12.4. Company Product Portfolio
12.12.5. Recent Developments
12.12.6. SWOT Analysis
12.13. Baxter
12.13.1. Business Overview
12.13.2. Company Snapshot
12.13.3. Company Market Share Analysis
12.13.4. Company Product Portfolio
12.13.5. Recent Developments
12.13.6. SWOT Analysis
12.14. Sanquin Blood Supply Foundation
12.14.1. Business Overview
12.14.2. Company Snapshot
12.14.3. Company Market Share Analysis
12.14.4. Company Product Portfolio
12.14.5. Recent Developments
12.14.6. SWOT Analysis
12.15. Kedrion
12.15.1. Business Overview
12.15.2. Company Snapshot
12.15.3. Company Market Share Analysis
12.15.4. Company Product Portfolio
12.15.5. Recent Developments
12.15.6. SWOT Analysis
12.16. Bharat Serums and Vaccines Limited
12.16.1. Business Overview
12.16.2. Company Snapshot
12.16.3. Company Market Share Analysis
12.16.4. Company Product Portfolio
12.16.5. Recent Developments
12.16.6. SWOT Analysis
12.17. Boccard
12.17.1. Business Overview
12.17.2. Company Snapshot
12.17.3. Company Market Share Analysis
12.17.4. Company Product Portfolio
12.17.5. Recent Developments
12.17.6. SWOT Analysis
12.18. ADMA Biologics
12.18.1. Business Overview
12.18.2. Company Snapshot
12.18.3. Company Market Share Analysis
12.18.4. Company Product Portfolio
12.18.5. Recent Developments
12.18.6. SWOT Analysis
12.19. Intas Pharmaceuticals Ltd
12.19.1. Business Overview
12.19.2. Company Snapshot
12.19.3. Company Market Share Analysis
12.19.4. Company Product Portfolio
12.19.5. Recent Developments
12.19.6. SWOT Analysis
List of Table
1. Global Plasma Fractionation Market, By Method Scope, 2019-2030 (USD Billion)
2. Global Chromatography, Plasma Fractionation Market, By Region, 2019-2030 (USD Billion)
3. Global Depth Filtration, Plasma Fractionation Market, By Region, 2019-2030 (USD Billion)
4. Global Centrifugation, Plasma Fractionation Market, By Region, 2019-2030 (USD Billion)
5. Global Others, Plasma Fractionation Market, By Region, 2019-2030 (USD Billion)
6. Global Plasma Fractionation Market, By Product Type, 2019-2030 (USD Billion)
7. Global Immunoglobulins, Plasma Fractionation Market, By Region, 2019-2030 (USD Billion)
8. Global Albumin, Plasma Fractionation Market, By Region, 2019-2030 (USD Billion)
9. Global Protease Inhibitors, Plasma Fractionation Market, By Region, 2019-2030 (USD Billion)
10. Global Coagulation Factors, Plasma Fractionation Market, By Region, 2019-2030 (USD Billion)
11. Global Others, Plasma Fractionation Market, By Region, 2019-2030 (USD Billion)
12. Global Plasma Fractionation Market, By End-User, 2019-2030 (USD Billion)
13. Global Clinical Research, Plasma Fractionation Market, By Region, 2019-2030 (USD Billion)
14. Global Hospitals & Clinics, Plasma Fractionation Market, By Region, 2019-2030 (USD Billion)
15. Global Others, Plasma Fractionation Market, By Region, 2019-2030 (USD Billion)
16. Global Plasma Fractionation Market, By Application, 2019-2030 (USD Billion)
17. Global Hematology, Neurology, Oncology, Pulmonology, Immunology, and Others, Plasma Fractionation Market, By Region, 2019-2030 (USD Billion)
18. Global Neurology, Plasma Fractionation Market, By Region, 2019-2030 (USD Billion)
19. Global Oncology, Plasma Fractionation Market, By Region, 2019-2030 (USD Billion)
20. lobal Pulmonology, Plasma Fractionation Market, By Region, 2019-2030 (USD Billion)
21. lobal Immunology, Plasma Fractionation Market, By Region, 2019-2030 (USD Billion)
22. lobal Others, Plasma Fractionation Market, By Region, 2019-2030 (USD Billion)
23. North America Plasma Fractionation Market, By Method Scope, 2019-2030 (USD Billion)
24. North America Plasma Fractionation Market, By Product Type, 2019-2030 (USD Billion)
25. North America Plasma Fractionation Market, By End-User, 2019-2030 (USD Billion)
26. North America Plasma Fractionation Market, By Application, 2019-2030 (USD Billion)
27. U.S. Plasma Fractionation Market, By Method Scope, 2019-2030 (USD Billion)
28. U.S. Plasma Fractionation Market, By Product Type, 2019-2030 (USD Billion)
29. U.S. Plasma Fractionation Market, By End-User, 2019-2030 (USD Billion)
30. U.S. Plasma Fractionation Market, By Application, 2019-2030 (USD Billion)
31. Canada Plasma Fractionation Market, By Method Scope, 2019-2030 (USD Billion)
32. Canada Plasma Fractionation Market, By Product Type, 2019-2030 (USD Billion)
33. Canada Plasma Fractionation Market, By End-User, 2019-2030 (USD Billion)
34. Canada Plasma Fractionation Market, By Application, 2019-2030 (USD Billion)
35. Mexico Plasma Fractionation Market, By Method Scope, 2019-2030 (USD Billion)
36. Mexico Plasma Fractionation Market, By Product Type, 2019-2030 (USD Billion)
37. Mexico Plasma Fractionation Market, By End-User, 2019-2030 (USD Billion)
38. Mexico Plasma Fractionation Market, By Application, 2019-2030 (USD Billion)
39. Europe Plasma Fractionation Market, By Method Scope, 2019-2030 (USD Billion)
40. Europe Plasma Fractionation Market, By Product Type, 2019-2030 (USD Billion)
41. Europe Plasma Fractionation Market, By End-User, 2019-2030 (USD Billion)
42. Europe Plasma Fractionation Market, By Application, 2019-2030 (USD Billion)
43. Germany Plasma Fractionation Market, By Method Scope, 2019-2030 (USD Billion)
44. Germany Plasma Fractionation Market, By Product Type, 2019-2030 (USD Billion)
45. Germany Plasma Fractionation Market, By End-User, 2019-2030 (USD Billion)
46. Germany Plasma Fractionation Market, By Application, 2019-2030 (USD Billion)
47. France Plasma Fractionation Market, By Method Scope, 2019-2030 (USD Billion)
48. France Plasma Fractionation Market, By Product Type, 2019-2030 (USD Billion)
49. France Plasma Fractionation Market, By End-User, 2019-2030 (USD Billion)
50. France Plasma Fractionation Market, By Application, 2019-2030 (USD Billion)
51. U.K. Plasma Fractionation Market, By Method Scope, 2019-2030 (USD Billion)
52. U.K. Plasma Fractionation Market, By Product Type, 2019-2030 (USD Billion)
53. U.K. Plasma Fractionation Market, By End-User, 2019-2030 (USD Billion)
54. U.K. Plasma Fractionation Market, By Application, 2019-2030 (USD Billion)
55. Italy Plasma Fractionation Market, By Method Scope, 2019-2030 (USD Billion)
56. Italy Plasma Fractionation Market, By Product Type, 2019-2030 (USD Billion)
57. Italy Plasma Fractionation Market, By End-User, 2019-2030 (USD Billion)
58. Italy Plasma Fractionation Market, By Application, 2019-2030 (USD Billion)
59. Spain Plasma Fractionation Market, By Method Scope, 2019-2030 (USD Billion)
60. Spain Plasma Fractionation Market, By Product Type, 2019-2030 (USD Billion)
61. Spain Plasma Fractionation Market, By End-User, 2019-2030 (USD Billion)
62. Spain Plasma Fractionation Market, By Application, 2019-2030 (USD Billion)
63. Asia Pacific Plasma Fractionation Market, By Method Scope, 2019-2030 (USD Billion)
64. Asia Pacific Plasma Fractionation Market, By Product Type, 2019-2030 (USD Billion)
65. Asia Pacific Plasma Fractionation Market, By End-User, 2019-2030 (USD Billion)
66. Asia Pacific Plasma Fractionation Market, By Application, 2019-2030 (USD Billion)
67. Japan Plasma Fractionation Market, By Method Scope, 2019-2030 (USD Billion)
68. Japan Plasma Fractionation Market, By Product Type, 2019-2030 (USD Billion)
69. Japan Plasma Fractionation Market, By End-User, 2019-2030 (USD Billion)
70. Japan Plasma Fractionation Market, By Application, 2019-2030 (USD Billion)
71. China Plasma Fractionation Market, By Method Scope, 2019-2030 (USD Billion)
72. China Plasma Fractionation Market, By Product Type, 2019-2030 (USD Billion)
73. China Plasma Fractionation Market, By End-User, 2019-2030 (USD Billion)
74. China Plasma Fractionation Market, By Application, 2019-2030 (USD Billion)
75. India Plasma Fractionation Market, By Method Scope, 2019-2030 (USD Billion)
76. India Plasma Fractionation Market, By Product Type, 2019-2030 (USD Billion)
77. India Plasma Fractionation Market, By End-User, 2019-2030 (USD Billion)
78. India Plasma Fractionation Market, By Application, 2019-2030 (USD Billion)
79. South America Plasma Fractionation Market, By Method Scope, 2019-2030 (USD Billion)
80. South America Plasma Fractionation Market, By Product Type, 2019-2030 (USD Billion)
81. South America Plasma Fractionation Market, By End-User, 2019-2030 (USD Billion)
82. South America Plasma Fractionation Market, By Application, 2019-2030 (USD Billion)
83. Brazil Plasma Fractionation Market, By Method Scope, 2019-2030 (USD Billion)
84. Brazil Plasma Fractionation Market, By Product Type, 2019-2030 (USD Billion)
85. Brazil Plasma Fractionation Market, By End-User, 2019-2030 (USD Billion)
86. Brazil Plasma Fractionation Market, By Application, 2019-2030 (USD Billion)
87. Middle East and Africa Plasma Fractionation Market, By Method Scope, 2019-2030 (USD Billion)
88. Middle East and Africa Plasma Fractionation Market, By Product Type, 2019-2030 (USD Billion)
89. Middle East and Africa Plasma Fractionation Market, By End-User, 2019-2030 (USD Billion)
90. Middle East and Africa Plasma Fractionation Market, By Application, 2019-2030 (USD Billion)
91. UAE Plasma Fractionation Market, By Method Scope, 2019-2030 (USD Billion)
92. UAE Plasma Fractionation Market, By Product Type, 2019-2030 (USD Billion)
93. UAE Plasma Fractionation Market, By End-User, 2019-2030 (USD Billion)
94. UAE Plasma Fractionation Market, By Application, 2019-2030 (USD Billion)
95. South Africa Plasma Fractionation Market, By Method Scope, 2019-2030 (USD Billion)
96. South Africa Plasma Fractionation Market, By Product Type, 2019-2030 (USD Billion)
97. South Africa Plasma Fractionation Market, By End-User, 2019-2030 (USD Billion)
98. South Africa Plasma Fractionation Market, By Application, 2019-2030 (USD Billion)
List of Figures
1. Global Plasma Fractionation Market Segmentation
2. Global Plasma Fractionation Market: Research Methodology
3. Market Size Estimation Methodology: Bottom-Up Approach
4. Market Size Estimation Methodology: Top-Down Approach
5. Data Triangulation
6. Porter’s Five Forces Analysis
7. Value Chain Analysis
8. Global Plasma Fractionation Market Attractiveness Analysis By Method Scope
9. Global Plasma Fractionation Market Attractiveness Analysis By Product Type
10. Global Plasma Fractionation Market Attractiveness Analysis By End-User
11. Global Plasma Fractionation Market Attractiveness Analysis By Application
12. Global Plasma Fractionation Market Attractiveness Analysis By Region
13. Global Plasma Fractionation Market: Dynamics
14. Global Plasma Fractionation Market Share By Method Scope (2022 & 2030)
15. Global Plasma Fractionation Market Share By Product Type (2022 & 2030)
16. Global Plasma Fractionation Market Share By End-User (2022 & 2030)
17. Global Plasma Fractionation Market Share By Application (2022 & 2030)
18. Global Plasma Fractionation Market Share By Regions (2022 & 2030)
19. Global Plasma Fractionation Market Share By Company (2021)
This study forecasts revenue at global, regional, and country levels from 2019 to 2030. The Brainy Insights has segmented the global plasma fractionation based on below mentioned segments:
Global Plasma Fractionation Market by Method Scope:
Global Plasma Fractionation Market by Product Type:
Global Plasma Fractionation Market by End-User:
Global Plasma Fractionation Market by Application:
Global Plasma Fractionation by Region:
Research has its special purpose to undertake marketing efficiently. In this competitive scenario, businesses need information across all industry verticals; the information about customer wants, market demand, competition, industry trends, distribution channels etc. This information needs to be updated regularly because businesses operate in a dynamic environment. Our organization, The Brainy Insights incorporates scientific and systematic research procedures in order to get proper market insights and industry analysis for overall business success. The analysis consists of studying the market from a miniscule level wherein we implement statistical tools which helps us in examining the data with accuracy and precision.
Our research reports feature both; quantitative and qualitative aspects for any market. Qualitative information for any market research process are fundamental because they reveal the customer needs and wants, usage and consumption for any product/service related to a specific industry. This in turn aids the marketers/investors in knowing certain perceptions of the customers. Qualitative research can enlighten about the different product concepts and designs along with unique service offering that in turn, helps define marketing problems and generate opportunities. On the other hand, quantitative research engages with the data collection process through interviews, e-mail interactions, surveys and pilot studies. Quantitative aspects for the market research are useful to validate the hypotheses generated during qualitative research method, explore empirical patterns in the data with the help of statistical tools, and finally make the market estimations.
The Brainy Insights offers comprehensive research and analysis, based on a wide assortment of factual insights gained through interviews with CXOs and global experts and secondary data from reliable sources. Our analysts and industry specialist assume vital roles in building up statistical tools and analysis models, which are used to analyse the data and arrive at accurate insights with exceedingly informative research discoveries. The data provided by our organization have proven precious to a diverse range of companies, facilitating them to address issues such as determining which products/services are the most appealing, whether or not customers use the product in the manner anticipated, the purchasing intentions of the market and many others.
Our research methodology encompasses an idyllic combination of primary and secondary initiatives. Key phases involved in this process are listed below:

The phase involves the gathering and collecting of market data and its related information with the help of different sources & research procedures.

The data procurement stage involves in data gathering and collecting through various data sources.
This stage involves in extensive research. These data sources includes:
Purchased Database: Purchased databases play a crucial role in estimating the market sizes irrespective of the domain. Our purchased database includes:
Primary Research: The Brainy Insights interacts with leading companies and experts of the concerned domain to develop the analyst team’s market understanding and expertise. It improves and substantiates every single data presented in the market reports. Primary research mainly involves in telephonic interviews, E-mail interactions and face-to-face interviews with the raw material providers, manufacturers/producers, distributors, & independent consultants. The interviews that we conduct provides valuable data on market size and industry growth trends prevailing in the market. Our organization also conducts surveys with the various industry experts in order to gain overall insights of the industry/market. For instance, in healthcare industry we conduct surveys with the pharmacists, doctors, surgeons and nurses in order to gain insights and key information of a medical product/device/equipment which the customers are going to usage. Surveys are conducted in the form of questionnaire designed by our own analyst team. Surveys plays an important role in primary research because surveys helps us to identify the key target audiences of the market. Additionally, surveys helps to identify the key target audience engaged with the market. Our survey team conducts the survey by targeting the key audience, thus gaining insights from them. Based on the perspectives of the customers, this information is utilized to formulate market strategies. Moreover, market surveys helps us to understand the current competitive situation of the industry. To be precise, our survey process typically involve with the 360 analysis of the market. This analytical process begins by identifying the prospective customers for a product or service related to the market/industry to obtain data on how a product/service could fit into customers’ lives.

Secondary Research: The secondary data sources includes information published by the on-profit organizations such as World bank, WHO, company fillings, investor presentations, annual reports, national government documents, statistical databases, blogs, articles, white papers and others. From the annual report, we analyse a company’s revenue to understand the key segment and market share of that organization in a particular region. We analyse the company websites and adopt the product mapping technique which is important for deriving the segment revenue. In the product mapping method, we select and categorize the products offered by the companies catering to domain specific market, deduce the product revenue for each of the companies so as to get overall estimation of the market size. We also source data and analyses trends based on information received from supply side and demand side intermediaries in the value chain. The supply side denotes the data gathered from supplier, distributor, wholesaler and the demand side illustrates the data gathered from the end customers for respective market domain.

The supply side for a domain specific market is analysed by:
The demand side for the market is estimated through:
In-house Library: Apart from these third-party sources, we have our in-house library of qualitative and quantitative information. Our in-house database includes market data for various industry and domains. These data are updated on regular basis as per the changing market scenario. Our library includes, historic databases, internal audit reports and archives.
Sometimes there are instances where there is no metadata or raw data available for any domain specific market. For those cases, we use our expertise to forecast and estimate the market size in order to generate comprehensive data sets. Our analyst team adopt a robust research technique in order to produce the estimates:
Data Synthesis: This stage involves the analysis & mapping of all the information obtained from the previous step. It also involves in scrutinizing the data for any discrepancy observed while data gathering related to the market. The data is collected with consideration to the heterogeneity of sources. Robust scientific techniques are in place for synthesizing disparate data sets and provide the essential contextual information that can orient market strategies. The Brainy Insights has extensive experience in data synthesis where the data passes through various stages:


Market Deduction & Formulation: The final stage comprises of assigning data points at appropriate market spaces so as to deduce feasible conclusions. Analyst perspective & subject matter expert based holistic form of market sizing coupled with industry analysis also plays a crucial role in this stage.
This stage involves in finalization of the market size and numbers that we have collected from data integration step. With data interpolation, it is made sure that there is no gap in the market data. Successful trend analysis is done by our analysts using extrapolation techniques, which provide the best possible forecasts for the market.
Data Validation & Market Feedback: Validation is the most important step in the process. Validation & re-validation via an intricately designed process helps us finalize data-points to be used for final calculations.

The Brainy Insights interacts with leading companies and experts of the concerned domain to develop the analyst team’s market understanding and expertise. It improves and substantiates every single data presented in the market reports. The data validation interview and discussion panels are typically composed of the most experienced industry members. The participants include, however, are not limited to:
Moreover, we always validate our data and findings through primary respondents from all the major regions we are working on.


Free Customization
Fortune 500 Clients
Free Yearly Update On Purchase Of Multi/Corporate License
Companies Served Till Date