- +1-315-215-1633
- sales@thebrainyinsights.com

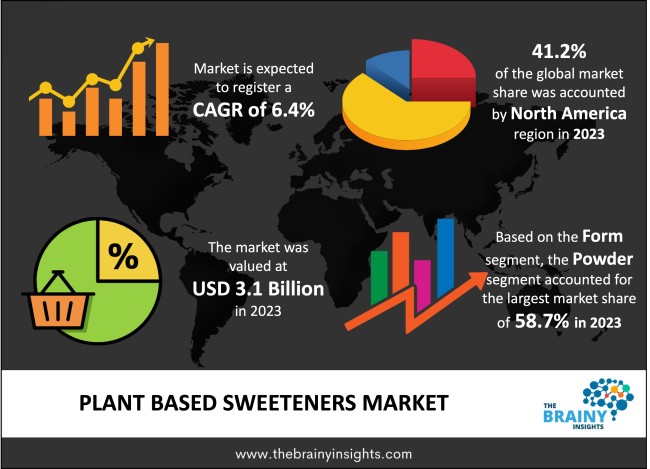
The Plant Based Sweeteners Market was valued at USD 3.1 billion in 2023 and grew at a CAGR of 6.4% from 2024 to 2033. Plant leaves or fruits are commonly used to make "plant-based sweeteners," which are natural sweeteners. The remarkable diversity of plants found in the world has led to the availability of a wide variety of natural sweeteners on the market. Sweeteners sourced from organic sources allow both consumers and formulators to maximize flavor without consuming excessive amounts of sugar. Growing consumer concern for maintaining a healthy lifestyle and the growing need for lower or zero-calorie organic ingredients in foods and beverages are two major factors propelling the growth of the global market for plant-based sweeteners. As healthier substitutes for sugar, people are gravitating toward readily identifiable, naturally derived foods rather than complexly named or laboratory-created
The market for plant-based sweeteners is growing as a result of the increased demand for healthier substitutes for conventional sweeteners. In comparison to artificial sweeteners and refined sugars, plant-based sweeteners are sourced naturally from fruits, vegetables, and other plant sources, providing customers with a healthier choice. Because of the growing trend toward plant-based diets and increased knowledge of the health hazards associated with excessive sugar consumption, this industry has experienced tremendous development.
Get an overview of this study by requesting a free sample
Consumers are looking for healthier choices as they become more aware of the detrimental effects refined sugar consumption has on their health. Health-conscious customers are boosting demand for plant-based sweeteners since they are seen as natural and healthier alternatives. Additionally, a decrease in sugar consumption has been motivated by the rise in diabetes and obesity rates worldwide. Because they are calorie-free or low-calorie alternatives, plant-based sweeteners are appealing to people who are trying to control their blood sugar and weight.
A major obstacle for plant-based sweeteners is to create flavor profiles that are comparable to those of regular sugar. Certain plant-based sweeteners could have unusual aftertastes or inconsistent flavors, which might discourage consumers from embracing and using them. Additionally, the cost of producing plant-based sweeteners may be higher than that of conventional sugars and artificial sweeteners. Higher production costs could lead to higher retail pricing, which would make plant-based sweeteners less accessible and affordable for some customers.
The creation of novel plant-based sweeteners sourced from a variety of botanical sources has enormous potential. Putting money into research and development to find new plant-based sweetening chemicals may result in the release of distinctive and cutting-edge sweeteners with various taste profiles and uses. Furthermore, there is rising interest in plant-based sweeteners that have additional functional advantages beyond just sweetness, like prebiotic qualities, antioxidant activity, or nutritional improvement. The increased demand for functional foods and beverages may be met by creating sweeteners with health-promoting qualities.
North America led the market in 2023 with the largest market share of 41.2%. Natural and low-calorie sweeteners are in high demand as North American consumers pursue healthier lifestyles. This need is met by plant-based sweeteners including erythritol, stevia, and monk fruit, which provide substitutes for table sugar and artificial sweeteners. Additionally, the food and beverage sector in North America is seeing a shift toward healthier product formulas and clearer labels. Plant-based sweeteners are used in a variety of items, such as baked goods, snacks, dairy substitutes, and beverages, offering room for market expansion.
North America Region Plant Based Sweeteners Market Share in 2023 - 41.2%
www.thebrainyinsights.com
Check the geographical analysis of this market by requesting a free sample
The Stevia segment dominated the global market in 2023 with a market share of 44.3%. The leaves of the stevia plant are used to make liquid and powdered stevia, which is an all-natural sweetener that is used all over the world. Furthermore, one of the most widely used substitute sweeteners, stevia, is up to 300 times sweeter than ordinary sugar and has no calories, carbs, or chemical additives. The fact that stevia is sweeter than table sugar and monk fruit is just another wonderful advantage. Furthermore, stevia is used in small quantities in formulations and yields the same results, which positively impacts stevia's market presence and encourages the growth of this sector's revenue.
The powder segment dominated the global market in 2023 with a market share of 58.7%. The powder section has a range of plant-based sweeteners, such as erythritol, stevia, and monk fruit, as well as combinations of these. In order to satisfy a wide range of consumer preferences, manufacturers can create and provide a variety of product formulations, such as ones with zero calories, organic certifications, or certain flavor profiles. Additionally, consumers are looking for goods with clear ingredient lists and uncluttered labels. These preferences are met by powdered plant-based sweeteners sourced from natural sources, which also present manufacturers with an opportunity to create clean label formulations devoid of artificial ingredients or preservatives.
The offline segment dominated the global market in 2023 with a market share of 76.1%. Plant-based sweeteners are widely accessible and available to customers in different locations through offline retail channels. Particularly, supermarkets and hypermarkets provide a wide variety of sweeteners, including plant-based alternatives, to suit the tastes of various customer groups. Additionally, manufacturers and brands can increase exposure and draw customer attention to plant-based sweeteners by utilizing in-store promotions, displays, and marketing campaigns. Consumer decisions about plant-based sweeteners can be influenced by visually appealing displays, product demos, and instructional materials.
| Attribute | Description |
|---|---|
| Market Size | Revenue (USD Billion) |
| Market size value in 2023 | USD 3.1 Billion |
| Market size value in 2033 | USD 5.7 Billion |
| CAGR (2024 to 2033) | 6.4% |
| Historical data | 2020-2022 |
| Base Year | 2023 |
| Forecast | 2024-2033 |
| Region | The regions analyzed for the market are Asia Pacific, Europe, South America, North America, and Middle East & Africa. Furthermore, the regions are further analyzed at the country level. |
| Segments | Type, Form, Distribution Channel |
As per The Brainy Insights, the size of the plant based sweeteners market was valued at USD 3.1 billion in 2023 to USD 5.7 billion by 2033.
The global plant based sweeteners market is growing at a CAGR of 6.4% during the forecast period 2024-2033.
The North America region emerged as the largest market for the plant based sweeteners.
The growing health awareness will influence the market's growth.
1. Introduction
1.1. Objectives of the Study
1.2. Market Definition
1.3. Research Scope
1.4. Currency
1.5. Key Target Audience
2. Research Methodology and Assumptions
3. Executive Summary
4. Premium Insights
4.1. Porter’s Five Forces Analysis
4.2. Value Chain Analysis
4.3. Top Investment Pockets
4.3.1. Market Attractiveness Analysis by Type
4.3.2. Market Attractiveness Analysis by Form
4.3.3. Market Attractiveness Analysis by Distribution Channel
4.3.4. Market Attractiveness Analysis by Region
4.4. Industry Trends
5. Market Dynamics
5.1. Market Evaluation
5.2. Drivers
5.2.1. Growing Health Awareness
5.3. Restraints
5.3.1. Taste and Flavor Profile
5.4. Opportunities
5.4.1. Product Innovation and Development
5.5. Challenges
5.5.1. Formulation Challenges
6. Global Plant Based Sweeteners Market Analysis and Forecast, By Type
6.1. Segment Overview
6.2. Stevia
6.3. Monk Fruit Sugar
6.4. Sorbitol
6.5. Xylitol
6.6. Yacon
6.7. Molasses
6.8. Agave
6.9. Lucuma Fruit Sugar
6.10. Others
7. Global Plant Based Sweeteners Market Analysis and Forecast, By Form
7.1. Segment Overview
7.2. Crystal
7.3. Liquid
7.4. Powder
8. Global Plant Based Sweeteners Market Analysis and Forecast, By Distribution Channel
8.1. Segment Overview
8.2. Online
8.3. Offline
9. Global Plant Based Sweeteners Market Analysis and Forecast, By Regional Analysis
9.1. Segment Overview
9.2. North America
9.2.1. U.S.
9.2.2. Canada
9.2.3. Mexico
9.3. Europe
9.3.1. Germany
9.3.2. France
9.3.3. U.K.
9.3.4. Italy
9.3.5. Spain
9.4. Asia-Pacific
9.4.1. Japan
9.4.2. China
9.4.3. India
9.5. South America
9.5.1. Brazil
9.6. Middle East and Africa
9.6.1. UAE
9.6.2. South Africa
10. Global Plant Based Sweeteners Market-Competitive Landscape
10.1. Overview
10.2. Market Share of Key Players in the Plant Based Sweeteners Market
10.2.1. Global Company Market Share
10.2.2. North America Company Market Share
10.2.3. Europe Company Market Share
10.2.4. APAC Company Market Share
10.3. Competitive Situations and Trends
10.3.1. Product Launches and Developments
10.3.2. Partnerships, Collaborations, and Agreements
10.3.3. Mergers & Acquisitions
10.3.4. Expansions
11. Company Profiles
11.1. Pyure Brands LLC.
11.1.1. Business Overview
11.1.2. Company Snapshot
11.1.3. Company Market Share Analysis
11.1.4. Company Product Portfolio
11.1.5. Recent Developments
11.1.6. SWOT Analysis
11.2. Steviahubindia
11.2.1. Business Overview
11.2.2. Company Snapshot
11.2.3. Company Market Share Analysis
11.2.4. Company Product Portfolio
11.2.5. Recent Developments
11.2.6. SWOT Analysis
11.3. Fooditive Group
11.3.1. Business Overview
11.3.2. Company Snapshot
11.3.3. Company Market Share Analysis
11.3.4. Company Product Portfolio
11.3.5. Recent Developments
11.3.6. SWOT Analysis
11.4. Foodchem International Corporation
11.4.1. Business Overview
11.4.2. Company Snapshot
11.4.3. Company Market Share Analysis
11.4.4. Company Product Portfolio
11.4.5. Recent Developments
11.4.6. SWOT Analysis
11.5. Evolva
11.5.1. Business Overview
11.5.2. Company Snapshot
11.5.3. Company Market Share Analysis
11.5.4. Company Product Portfolio
11.5.5. Recent Developments
11.5.6. SWOT Analysis
11.6. Wisdom Natural Brands
11.6.1. Business Overview
11.6.2. Company Snapshot
11.6.3. Company Market Share Analysis
11.6.4. Company Product Portfolio
11.6.5. Recent Developments
11.6.6. SWOT Analysis
11.7. GLG Life Tech Corp.
11.7.1. Business Overview
11.7.2. Company Snapshot
11.7.3. Company Market Share Analysis
11.7.4. Company Product Portfolio
11.7.5. Recent Developments
11.7.6. SWOT Analysis
11.8. MacAndrews & Forbes Incorporated.
11.8.1. Business Overview
11.8.2. Company Snapshot
11.8.3. Company Market Share Analysis
11.8.4. Company Product Portfolio
11.8.5. Recent Developments
11.8.6. SWOT Analysis
11.9. Cargill Incorporated
11.9.1. Business Overview
11.9.2. Company Snapshot
11.9.3. Company Market Share Analysis
11.9.4. Company Product Portfolio
11.9.5. Recent Developments
11.9.6. SWOT Analysis
11.10. Archer Daniels Midland Company (ADM)
11.10.1. Business Overview
11.10.2. Company Snapshot
11.10.3. Company Market Share Analysis
11.10.4. Company Product Portfolio
11.10.5. Recent Developments
11.10.6. SWOT Analysis
11.11. Ingredion
11.11.1. Business Overview
11.11.2. Company Snapshot
11.11.3. Company Market Share Analysis
11.11.4. Company Product Portfolio
11.11.5. Recent Developments
11.11.6. SWOT Analysis
11.12. DuPont
11.12.1. Business Overview
11.12.2. Company Snapshot
11.12.3. Company Market Share Analysis
11.12.4. Company Product Portfolio
11.12.5. Recent Developments
11.12.6. SWOT Analysis
11.13. Roquetee Freres
11.13.1. Business Overview
11.13.2. Company Snapshot
11.13.3. Company Market Share Analysis
11.13.4. Company Product Portfolio
11.13.5. Recent Developments
11.13.6. SWOT Analysis
List of Table
1. Global Plant Based Sweeteners Market, By Type, 2020-2033 (USD Billion)
2. Global Stevia Plant Based Sweeteners Market, By Region, 2020-2033 (USD Billion)
3. Global Monk Fruit Sugar Plant Based Sweeteners Market, By Region, 2020-2033 (USD Billion)
4. Global Sorbitol Plant Based Sweeteners Market, By Region, 2020-2033 (USD Billion)
5. Global Xylitol Salt Plant Based Sweeteners Market, By Region, 2020-2033 (USD Billion)
6. Global Yacon Plant Based Sweeteners Market, By Region, 2020-2033 (USD Billion)
7. Global Molasses Plant Based Sweeteners Market, By Region, 2020-2033 (USD Billion)
8. Global Agave Plant Based Sweeteners Market, By Region, 2020-2033 (USD Billion)
9. Global Lucuma Fruit Sugar Plant Based Sweeteners Market, By Region, 2020-2033 (USD Billion)
10. Global Others Plant Based Sweeteners Market, By Region, 2020-2033 (USD Billion)
11. Global Plant Based Sweeteners Market, By Form, 2020-2033 (USD Billion)
12. Global Crystal Plant Based Sweeteners Market, By Region, 2020-2033 (USD Billion)
13. Global Liquid Plant Based Sweeteners Market, By Region, 2020-2033 (USD Billion)
14. Global Powder Plant Based Sweeteners Market, By Region, 2020-2033 (USD Billion)
15. Global Plant Based Sweeteners Market, By Distribution Channel, 2020-2033 (USD Billion)
16. Global Online Plant Based Sweeteners Market, By Region, 2020-2033 (USD Billion)
17. Global Offline Plant Based Sweeteners Market, By Region, 2020-2033 (USD Billion)
18. Global Plant Based Sweeteners Market, By Region, 2020-2033 (USD Billion)
19. North America Plant Based Sweeteners Market, By Type, 2020-2033 (USD Billion)
20. North America Plant Based Sweeteners Market, By Form, 2020-2033 (USD Billion)
21. North America Plant Based Sweeteners Market, By Distribution Channel, 2020-2033 (USD Billion)
22. U.S. Plant Based Sweeteners Market, By Type, 2020-2033 (USD Billion)
23. U.S. Plant Based Sweeteners Market, By Form, 2020-2033 (USD Billion)
24. U.S. Plant Based Sweeteners Market, By Distribution Channel, 2020-2033 (USD Billion)
25. Canada Plant Based Sweeteners Market, By Type, 2020-2033 (USD Billion)
26. Canada Plant Based Sweeteners Market, By Form, 2020-2033 (USD Billion)
27. Canada Plant Based Sweeteners Market, By Distribution Channel, 2020-2033 (USD Billion)
28. Mexico Plant Based Sweeteners Market, By Type, 2020-2033 (USD Billion)
29. Mexico Plant Based Sweeteners Market, By Form, 2020-2033 (USD Billion)
30. Mexico Plant Based Sweeteners Market, By Distribution Channel, 2020-2033 (USD Billion)
31. Europe Plant Based Sweeteners Market, By Type, 2020-2033 (USD Billion)
32. Europe Plant Based Sweeteners Market, By Form, 2020-2033 (USD Billion)
33. Europe Plant Based Sweeteners Market, By Distribution Channel, 2020-2033 (USD Billion)
34. Germany Plant Based Sweeteners Market, By Type, 2020-2033 (USD Billion)
35. Germany Plant Based Sweeteners Market, By Form, 2020-2033 (USD Billion)
36. Germany Plant Based Sweeteners Market, By Distribution Channel, 2020-2033 (USD Billion)
37. France Plant Based Sweeteners Market, By Type, 2020-2033 (USD Billion)
38. France Plant Based Sweeteners Market, By Form, 2020-2033 (USD Billion)
39. France Plant Based Sweeteners Market, By Distribution Channel, 2020-2033 (USD Billion)
40. U.K. Plant Based Sweeteners Market, By Type, 2020-2033 (USD Billion)
41. U.K. Plant Based Sweeteners Market, By Form, 2020-2033 (USD Billion)
42. U.K. Plant Based Sweeteners Market, By Distribution Channel, 2020-2033 (USD Billion)
43. Italy Plant Based Sweeteners Market, By Type, 2020-2033 (USD Billion)
44. Italy Plant Based Sweeteners Market, By Form, 2020-2033 (USD Billion)
45. Italy Plant Based Sweeteners Market, By Distribution Channel, 2020-2033 (USD Billion)
46. Spain Plant Based Sweeteners Market, By Type, 2020-2033 (USD Billion)
47. Spain Plant Based Sweeteners Market, By Form, 2020-2033 (USD Billion)
48. Spain Plant Based Sweeteners Market, By Distribution Channel, 2020-2033 (USD Billion)
49. Asia Pacific Plant Based Sweeteners Market, By Type, 2020-2033 (USD Billion)
50. Asia Pacific Plant Based Sweeteners Market, By Form, 2020-2033 (USD Billion)
51. Asia Pacific Plant Based Sweeteners Market, By Distribution Channel, 2020-2033 (USD Billion)
52. Japan Plant Based Sweeteners Market, By Type, 2020-2033 (USD Billion)
53. Japan Plant Based Sweeteners Market, By Form, 2020-2033 (USD Billion)
54. Japan Plant Based Sweeteners Market, By Distribution Channel, 2020-2033 (USD Billion)
55. China Plant Based Sweeteners Market, By Type, 2020-2033 (USD Billion)
56. China Plant Based Sweeteners Market, By Form, 2020-2033 (USD Billion)
57. China Plant Based Sweeteners Market, By Distribution Channel, 2020-2033 (USD Billion)
58. India Plant Based Sweeteners Market, By Type, 2020-2033 (USD Billion)
59. India Plant Based Sweeteners Market, By Form, 2020-2033 (USD Billion)
60. India Plant Based Sweeteners Market, By Distribution Channel, 2020-2033 (USD Billion)
61. South America Plant Based Sweeteners Market, By Type, 2020-2033 (USD Billion)
62. South America Plant Based Sweeteners Market, By Form, 2020-2033 (USD Billion)
63. South America Plant Based Sweeteners Market, By Distribution Channel, 2020-2033 (USD Billion)
64. Brazil Plant Based Sweeteners Market, By Type, 2020-2033 (USD Billion)
65. Brazil Plant Based Sweeteners Market, By Form, 2020-2033 (USD Billion)
66. Brazil Plant Based Sweeteners Market, By Distribution Channel, 2020-2033 (USD Billion)
67. Middle East and Africa Plant Based Sweeteners Market, By Type, 2020-2033 (USD Billion)
68. Middle East and Africa Plant Based Sweeteners Market, By Form, 2020-2033 (USD Billion)
69. Middle East and Africa Plant Based Sweeteners Market, By Distribution Channel, 2020-2033 (USD Billion)
70. UAE Plant Based Sweeteners Market, By Type, 2020-2033 (USD Billion)
71. UAE Plant Based Sweeteners Market, By Form, 2020-2033 (USD Billion)
72. UAE Plant Based Sweeteners Market, By Distribution Channel, 2020-2033 (USD Billion)
73. South Africa Plant Based Sweeteners Market, By Type, 2020-2033 (USD Billion)
74. South Africa Plant Based Sweeteners Market, By Form, 2020-2033 (USD Billion)
75. South Africa Plant Based Sweeteners Market, By Distribution Channel, 2020-2033 (USD Billion)
List of Figures
1. Global Plant Based Sweeteners Market Segmentation
2. Plant Based Sweeteners Market: Research Methodology
3. Market Size Estimation Methodology: Bottom-Up Approach
4. Market Size Estimation Methodology: Top-Down Approach
5. Data Triangulation
6. Porter’s Five Forces Analysis
7. Value Chain Analysis
8. Global Plant Based Sweeteners Market Attractiveness Analysis by Type
9. Global Plant Based Sweeteners Market Attractiveness Analysis by Form
10. Global Plant Based Sweeteners Market Attractiveness Analysis by Distribution Channel
11. Global Plant Based Sweeteners Market Attractiveness Analysis by Region
12. Global Plant Based Sweeteners Market: Dynamics
13. Global Plant Based Sweeteners Market Share by Type (2023 & 2033)
14. Global Plant Based Sweeteners Market Share by Form (2023 & 2033)
15. Global Plant Based Sweeteners Market Share by Distribution Channel (2023 & 2033)
16. Global Plant Based Sweeteners Market Share by Regions (2023 & 2033)
17. Global Plant Based Sweeteners Market Share by Company (2023)
This study forecasts revenue at global, regional, and country levels from 2020 to 2033. The Brainy Insights has segmented the global plant based sweeteners market based on below-mentioned segments:
Global Plant Based Sweeteners Market by Type:
Global Plant Based Sweeteners Market by Form:
Global Plant Based Sweeteners Market by Distribution Channel:
Global Plant Based Sweeteners Market by Region:
Research has its special purpose to undertake marketing efficiently. In this competitive scenario, businesses need information across all industry verticals; the information about customer wants, market demand, competition, industry trends, distribution channels etc. This information needs to be updated regularly because businesses operate in a dynamic environment. Our organization, The Brainy Insights incorporates scientific and systematic research procedures in order to get proper market insights and industry analysis for overall business success. The analysis consists of studying the market from a miniscule level wherein we implement statistical tools which helps us in examining the data with accuracy and precision.
Our research reports feature both; quantitative and qualitative aspects for any market. Qualitative information for any market research process are fundamental because they reveal the customer needs and wants, usage and consumption for any product/service related to a specific industry. This in turn aids the marketers/investors in knowing certain perceptions of the customers. Qualitative research can enlighten about the different product concepts and designs along with unique service offering that in turn, helps define marketing problems and generate opportunities. On the other hand, quantitative research engages with the data collection process through interviews, e-mail interactions, surveys and pilot studies. Quantitative aspects for the market research are useful to validate the hypotheses generated during qualitative research method, explore empirical patterns in the data with the help of statistical tools, and finally make the market estimations.
The Brainy Insights offers comprehensive research and analysis, based on a wide assortment of factual insights gained through interviews with CXOs and global experts and secondary data from reliable sources. Our analysts and industry specialist assume vital roles in building up statistical tools and analysis models, which are used to analyse the data and arrive at accurate insights with exceedingly informative research discoveries. The data provided by our organization have proven precious to a diverse range of companies, facilitating them to address issues such as determining which products/services are the most appealing, whether or not customers use the product in the manner anticipated, the purchasing intentions of the market and many others.
Our research methodology encompasses an idyllic combination of primary and secondary initiatives. Key phases involved in this process are listed below:

The phase involves the gathering and collecting of market data and its related information with the help of different sources & research procedures.

The data procurement stage involves in data gathering and collecting through various data sources.
This stage involves in extensive research. These data sources includes:
Purchased Database: Purchased databases play a crucial role in estimating the market sizes irrespective of the domain. Our purchased database includes:
Primary Research: The Brainy Insights interacts with leading companies and experts of the concerned domain to develop the analyst team’s market understanding and expertise. It improves and substantiates every single data presented in the market reports. Primary research mainly involves in telephonic interviews, E-mail interactions and face-to-face interviews with the raw material providers, manufacturers/producers, distributors, & independent consultants. The interviews that we conduct provides valuable data on market size and industry growth trends prevailing in the market. Our organization also conducts surveys with the various industry experts in order to gain overall insights of the industry/market. For instance, in healthcare industry we conduct surveys with the pharmacists, doctors, surgeons and nurses in order to gain insights and key information of a medical product/device/equipment which the customers are going to usage. Surveys are conducted in the form of questionnaire designed by our own analyst team. Surveys plays an important role in primary research because surveys helps us to identify the key target audiences of the market. Additionally, surveys helps to identify the key target audience engaged with the market. Our survey team conducts the survey by targeting the key audience, thus gaining insights from them. Based on the perspectives of the customers, this information is utilized to formulate market strategies. Moreover, market surveys helps us to understand the current competitive situation of the industry. To be precise, our survey process typically involve with the 360 analysis of the market. This analytical process begins by identifying the prospective customers for a product or service related to the market/industry to obtain data on how a product/service could fit into customers’ lives.

Secondary Research: The secondary data sources includes information published by the on-profit organizations such as World bank, WHO, company fillings, investor presentations, annual reports, national government documents, statistical databases, blogs, articles, white papers and others. From the annual report, we analyse a company’s revenue to understand the key segment and market share of that organization in a particular region. We analyse the company websites and adopt the product mapping technique which is important for deriving the segment revenue. In the product mapping method, we select and categorize the products offered by the companies catering to domain specific market, deduce the product revenue for each of the companies so as to get overall estimation of the market size. We also source data and analyses trends based on information received from supply side and demand side intermediaries in the value chain. The supply side denotes the data gathered from supplier, distributor, wholesaler and the demand side illustrates the data gathered from the end customers for respective market domain.

The supply side for a domain specific market is analysed by:
The demand side for the market is estimated through:
In-house Library: Apart from these third-party sources, we have our in-house library of qualitative and quantitative information. Our in-house database includes market data for various industry and domains. These data are updated on regular basis as per the changing market scenario. Our library includes, historic databases, internal audit reports and archives.
Sometimes there are instances where there is no metadata or raw data available for any domain specific market. For those cases, we use our expertise to forecast and estimate the market size in order to generate comprehensive data sets. Our analyst team adopt a robust research technique in order to produce the estimates:
Data Synthesis: This stage involves the analysis & mapping of all the information obtained from the previous step. It also involves in scrutinizing the data for any discrepancy observed while data gathering related to the market. The data is collected with consideration to the heterogeneity of sources. Robust scientific techniques are in place for synthesizing disparate data sets and provide the essential contextual information that can orient market strategies. The Brainy Insights has extensive experience in data synthesis where the data passes through various stages:


Market Deduction & Formulation: The final stage comprises of assigning data points at appropriate market spaces so as to deduce feasible conclusions. Analyst perspective & subject matter expert based holistic form of market sizing coupled with industry analysis also plays a crucial role in this stage.
This stage involves in finalization of the market size and numbers that we have collected from data integration step. With data interpolation, it is made sure that there is no gap in the market data. Successful trend analysis is done by our analysts using extrapolation techniques, which provide the best possible forecasts for the market.
Data Validation & Market Feedback: Validation is the most important step in the process. Validation & re-validation via an intricately designed process helps us finalize data-points to be used for final calculations.

The Brainy Insights interacts with leading companies and experts of the concerned domain to develop the analyst team’s market understanding and expertise. It improves and substantiates every single data presented in the market reports. The data validation interview and discussion panels are typically composed of the most experienced industry members. The participants include, however, are not limited to:
Moreover, we always validate our data and findings through primary respondents from all the major regions we are working on.


Free Customization
Fortune 500 Clients
Free Yearly Update On Purchase Of Multi/Corporate License
Companies Served Till Date