- +1-315-215-1633
- sales@thebrainyinsights.com

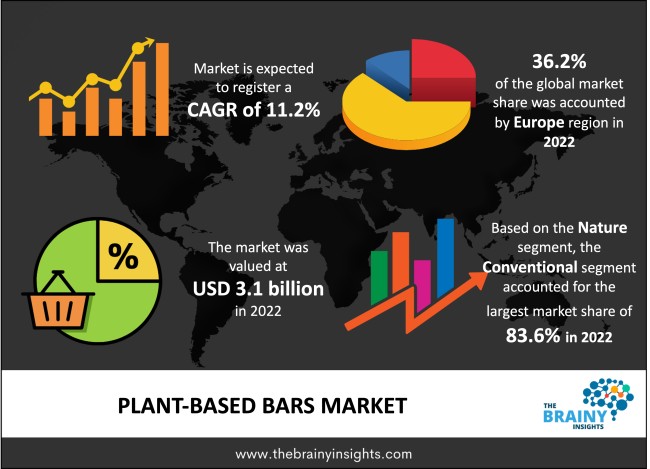
The global plant-based bars market was valued at USD 3.1 billion in 2022 and grew at a CAGR of 11.2% from 2023 to 2032. The market is expected to reach USD 8.9 billion by 2032. The growing focus that customers are placing on health and wellbeing is one of the main drivers of the expansion of plant-based bars. Many individuals are seeking for better snack alternatives that will give them the nutrition and energy they need to stay healthy in light of the growth in chronic health concerns including diabetes, overweight, and heart disease. Plant-based bars frequently have fewer calories and less sugar than conventional snack bars and are an excellent source of fiber, protein, and healthy fats.
In order to provide consumers with rapid dietary energy, plant-based bars are supplementary bars that just contain sources of protein from plants such as cereals, fruits, nuts, and flavors. In order to give people their preferred fuel source (glycogen), these vegan bars are often more protein-enriched and carbohydrate-dense. This keeps people energized and satisfied until their next meal. Additionally, the market is expanding significantly due to changing lifestyles, soaring demand for products with plant-based proteins, and a rise in consumer health consciousness.
Get an overview of this study by requesting a free sample
More health-conscious consumers are actively looking for wholesome and clean-label snack choices. These needs are frequently met by plant-based bars since they don't include artificial chemicals or preservatives. They are also considered to be a good source of protein, fiber, and other necessary nutrients. The demand for plant-based bars has also increased as vegetarian, vegan, and flexible diets become more popular. Plant-based bars are a desirable option for these diets because they don't include animal products and depend instead on sources of protein and minerals from plants.
Compared to traditional snack bars, plant-based bars might be more expensive, especially when created with premium ingredients. Prices may increase as a result of rising costs for ingredients, production procedures, and packaging. Consumer price sensitivity, particularly among budget-conscious populations, may prevent plant-based bars from becoming widely popular.
The desire for healthier snack alternatives is being driven by the growing awareness of health and well-being. Plant-based bars are well-positioned to benefit from this trend since they place a strong focus on natural ingredients, nutritional density, and functional benefits. To meet a variety of customer demands, manufacturers can create cutting-edge formulas with specialized nutrition profiles, like high protein, dietary fiber, or certain vitamins and minerals.
Europe led the market in 2022 with the largest market share of 36.2%. Customers in the area are making the decision to consume fewer animal products and are increasingly selecting plant-based substitutes, such as plant-based bars. Throughout recent years, there have been more plant-based bars throughout Europe. The availability of a wide selection of plant-based bars in many supermarkets as well as health food stores has made it simpler for customers to locate and buy these goods. This has increased consumer interest in and knowledge of plant-based bars.
Europe Region Plant- Based Bars Market Share in 2022 - 36.2%
www.thebrainyinsights.com
Check the geographical analysis of this market by requesting a free sample
The conventional segment dominated the global market in 2022 with a market share of 83.6%. For consumers on a restricted budget, traditional plant-based bars are frequently less expensive and more readily available. Consumers have easier access to conventional plant-based foods since they are widely available and often sold in grocery shops and online merchants. These bars' manufacturers frequently spend a lot of money on marketing initiatives, some of which may involve influencer relationships, online advertising, and television advertisements. Consumers become more familiar with traditional plant-based bars as a result of this exposure, increasing their propensity to select them over competing goods. As a result, the aforementioned elements support category growth.
The Protein Bars segment held a significant market share of 56.3% in 2022. In recent years, many individuals have chosen to live a more plant-based lifestyle, increasing the demand for plant-based diets. As a result, demand for plant-based protein sources, such as plant-based protein bars, has surged. In response to this need, several producers have produced a huge selection of tasty and nutrient-dense plant-based protein bars. Plant-based protein bars' flavor and texture were a big factor in why they weren't as well-liked in the past. However, because of improvements in manufacturing and food technology, most plant-based protein bars now feel and taste equally as wonderful as conventional snack bars. Because of this, more people are choosing plant-based protein bars as a healthy alternative.
The hypermarkets & supermarkets segment dominated the global market in 2022 with a market share of 31.5%. Customers may find a large range of plant-based items at supermarkets and hypermarkets. These merchants can accommodate their client’s requirements and preferences since they have a huge footprint and can carry a wide variety of goods. Customers may conveniently discover plant-based goods that meet their dietary choices and needs in one place as a consequence. Additionally, the cost of plant-based goods is frequently competitive in supermarkets and hypermarkets. These shops may provide goods to customers at lower rates than smaller retail establishments since they buy goods in bulk. As a result, a larger spectrum of customers may now afford and access plant-based bars.
| Attribute | Description |
|---|---|
| Market Size | Revenue (USD Billion) |
| Market size value in 2022 | USD 3.1 Billion |
| Market size value in 2032 | USD 8.9 Billion |
| CAGR (2023 to 2032) | 11.2% |
| Historical data | 2019-2021 |
| Base Year | 2022 |
| Forecast | 2023-2032 |
| Region | The regions analyzed for the market are Asia Pacific, Europe, South America, North America, and Middle East & Africa. Furthermore, the regions are further analyzed at the country level. |
| Segments | Nature, Product, Distribution channel |
As per The Brainy Insights, the size of the plant-based bars market was valued at USD 3.1 billion in 2022 to USD 8.9 billion by 2032.
The global plant-based bars market is growing at a CAGR of 11.2% during the forecast period 2023-2032.
The Europe region emerged as the largest market for the plant-based bars.
Rising health consciousness among the consumers will influence the market's growth.
1. Introduction
1.1. Objectives of the Study
1.2. Market Definition
1.3. Research Scope
1.4. Currency
1.5. Key Target Audience
2. Research Methodology and Assumptions
3. Executive Summary
4. Premium Insights
4.1. Porter’s Five Forces Analysis
4.2. Value Chain Analysis
4.3. Top Investment Pockets
4.3.1. Market Attractiveness Analysis by Nature
4.3.2. Market Attractiveness Analysis by Product
4.3.3. Market Attractiveness Analysis by Distribution Channel
4.3.4. Market Attractiveness Analysis by Region
4.4. Industry Trends
5. Market Dynamics
5.1. Market Evaluation
5.2. Drivers
5.2.1. Rising health consciousness among the consumers
5.3. Restraints
5.3.1. High Cost
5.4. Opportunities
5.4.1. Rise in demand of healthy snacks
5.5. Challenges
5.5.1. Presence of substitute products
6. Global Plant-Based Bars Market Analysis and Forecast, By Nature
6.1. Segment Overview
6.2. Conventional
6.3. Organic
7. Global Plant-Based Bars Market Analysis and Forecast, By Product
7.1. Segment Overview
7.2. Granola/Cereal Bars
7.3. Protein Bars
8. Global Plant-Based Bars Market Analysis and Forecast, By Distribution Channel
8.1. Segment Overview
8.2. Hypermarkets & Supermarkets
8.3. Convenience Stores
8.4. Specialty Stores
8.5. Online
8.6. Others
9. Global Plant-Based Bars Market Analysis and Forecast, By Regional Analysis
9.1. Segment Overview
9.2. North America
9.2.1. U.S.
9.2.2. Canada
9.2.3. Mexico
9.3. Europe
9.3.1. Germany
9.3.2. France
9.3.3. U.K.
9.3.4. Italy
9.3.5. Spain
9.4. Asia-Pacific
9.4.1. Japan
9.4.2. China
9.4.3. India
9.5. South America
9.5.1. Brazil
9.6. Middle East and Africa
9.6.1. UAE
9.6.2. South Africa
10. Global Plant-Based Bars Market-Competitive Landscape
10.1. Overview
10.2. Market Share of Key Players in the Plant-Based Bars Market
10.2.1. Global Company Market Share
10.2.2. North America Company Market Share
10.2.3. Europe Company Market Share
10.2.4. APAC Company Market Share
10.3. Competitive Situations and Trends
10.3.1. Product Launches and Developments
10.3.2. Partnerships, Collaborations, and Agreements
10.3.3. Mergers & Acquisitions
10.3.4. Expansions
11. Company Profiles
11.1. GNC Holdings, LLC
11.1.1. Business Overview
11.1.2. Company Snapshot
11.1.3. Company Market Share Analysis
11.1.4. Company Product Portfolio
11.1.5. Recent Developments
11.1.6. SWOT Analysis
11.2. Rise Bar
11.2.1. Business Overview
11.2.2. Company Snapshot
11.2.3. Company Market Share Analysis
11.2.4. Company Product Portfolio
11.2.5. Recent Developments
11.2.6. SWOT Analysis
11.3. MadeGood
11.3.1. Business Overview
11.3.2. Company Snapshot
11.3.3. Company Market Share Analysis
11.3.4. Company Product Portfolio
11.3.5. Recent Developments
11.3.6. SWOT Analysis
11.4. Växa Bars
11.4.1. Business Overview
11.4.2. Company Snapshot
11.4.3. Company Market Share Analysis
11.4.4. Company Product Portfolio
11.4.5. Recent Developments
11.4.6. SWOT Analysis
11.5. Clif Bar & Company
11.5.1. Business Overview
11.5.2. Company Snapshot
11.5.3. Company Market Share Analysis
11.5.4. Company Product Portfolio
11.5.5. Recent Developments
11.5.6. SWOT Analysis
11.6. GoMacro, LLC
11.6.1. Business Overview
11.6.2. Company Snapshot
11.6.3. Company Market Share Analysis
11.6.4. Company Product Portfolio
11.6.5. Recent Developments
11.6.6. SWOT Analysis
11.7. Kellogg's
11.7.1. Business Overview
11.7.2. Company Snapshot
11.7.3. Company Market Share Analysis
11.7.4. Company Product Portfolio
11.7.5. Recent Developments
11.7.6. SWOT Analysis
11.8. Greens Gone Wild, LLC.
11.8.1. Business Overview
11.8.2. Company Snapshot
11.8.3. Company Market Share Analysis
11.8.4. Company Product Portfolio
11.8.5. Recent Developments
11.8.6. SWOT Analysis
11.9. General Mills Inc. (LÄRABAR)
11.9.1. Business Overview
11.9.2. Company Snapshot
11.9.3. Company Market Share Analysis
11.9.4. Company Product Portfolio
11.9.5. Recent Developments
11.9.6. SWOT Analysis
11.10. 88 ACRES
11.10.1. Business Overview
11.10.2. Company Snapshot
11.10.3. Company Market Share Analysis
11.10.4. Company Product Portfolio
11.10.5. Recent Developments
11.10.6. SWOT Analysis
List of Table
1. Global Plant-Based Bars Market, By Nature, 2019-2032 (USD Billion)
2. Global Conventional Plant-Based Bars Market, By Region, 2019-2032 (USD Billion)
3. Global Organic Plant-Based Bars Market, By Region, 2019-2032 (USD Billion)
4. Global Plant-Based Bars Market, By Product, 2019-2032 (USD Billion)
5. Global Granola/Cereal Bars Plant-Based Bars Market, By Region, 2019-2032 (USD Billion)
6. Global Protein Bars Plant-Based Bars Market, By Region, 2019-2032 (USD Billion)
7. Global Plant-Based Bars Market, By Distribution Channel, 2019-2032 (USD Billion)
8. Global Hypermarkets & Supermarkets Plant-Based Bars Market, By Region, 2019-2032 (USD Billion)
9. Global Convenience Stores Plant-Based Bars Market, By Region, 2019-2032 (USD Billion)
10. Global Specialty Stores Plant-Based Bars Market, By Region, 2019-2032 (USD Billion)
11. Global Online Plant-Based Bars Market, By Region, 2019-2032 (USD Billion)
12. Global Others Plant-Based Bars Market, By Region, 2019-2032 (USD Billion)
13. Global Plant-Based Bars Market, By Region, 2019-2032 (USD Billion)
14. North America Plant-Based Bars Market, By Nature, 2019-2032 (USD Billion)
15. North America Plant-Based Bars Market, By Product, 2019-2032 (USD Billion)
16. North America Plant-Based Bars Market, By Distribution Channel, 2019-2032 (USD Billion)
17. U.S. Plant-Based Bars Market, By Nature, 2019-2032 (USD Billion)
18. U.S. Plant-Based Bars Market, By Product, 2019-2032 (USD Billion)
19. U.S. Plant-Based Bars Market, By Distribution Channel, 2019-2032 (USD Billion)
20. Canada Plant-Based Bars Market, By Nature, 2019-2032 (USD Billion)
21. Canada Plant-Based Bars Market, By Product, 2019-2032 (USD Billion)
22. Canada Plant-Based Bars Market, By Distribution Channel, 2019-2032 (USD Billion)
23. Mexico Plant-Based Bars Market, By Nature, 2019-2032 (USD Billion)
24. Mexico Plant-Based Bars Market, By Product, 2019-2032 (USD Billion)
25. Mexico Plant-Based Bars Market, By Distribution Channel, 2019-2032 (USD Billion)
26. Europe Plant-Based Bars Market, By Nature, 2019-2032 (USD Billion)
27. Europe Plant-Based Bars Market, By Product, 2019-2032 (USD Billion)
28. Europe Plant-Based Bars Market, By Distribution Channel, 2019-2032 (USD Billion)
29. Germany Plant-Based Bars Market, By Nature, 2019-2032 (USD Billion)
30. Germany Plant-Based Bars Market, By Product, 2019-2032 (USD Billion)
31. Germany Plant-Based Bars Market, By Distribution Channel, 2019-2032 (USD Billion)
32. France Plant-Based Bars Market, By Nature, 2019-2032 (USD Billion)
33. France Plant-Based Bars Market, By Product, 2019-2032 (USD Billion)
34. France Plant-Based Bars Market, By Distribution Channel, 2019-2032 (USD Billion)
35. U.K. Plant-Based Bars Market, By Nature, 2019-2032 (USD Billion)
36. U.K. Plant-Based Bars Market, By Product, 2019-2032 (USD Billion)
37. U.K. Plant-Based Bars Market, By Distribution Channel, 2019-2032 (USD Billion)
38. Italy Plant-Based Bars Market, By Nature, 2019-2032 (USD Billion)
39. Italy Plant-Based Bars Market, By Product, 2019-2032 (USD Billion)
40. Italy Plant-Based Bars Market, By Distribution Channel, 2019-2032 (USD Billion)
41. Spain Plant-Based Bars Market, By Nature, 2019-2032 (USD Billion)
42. Spain Plant-Based Bars Market, By Product, 2019-2032 (USD Billion)
43. Spain Plant-Based Bars Market, By Distribution Channel, 2019-2032 (USD Billion)
44. Asia Pacific Plant-Based Bars Market, By Nature, 2019-2032 (USD Billion)
45. Asia Pacific Plant-Based Bars Market, By Product, 2019-2032 (USD Billion)
46. Asia Pacific Plant-Based Bars Market, By Distribution Channel, 2019-2032 (USD Billion)
47. Japan Plant-Based Bars Market, By Nature, 2019-2032 (USD Billion)
48. Japan Plant-Based Bars Market, By Product, 2019-2032 (USD Billion)
49. Japan Plant-Based Bars Market, By Distribution Channel, 2019-2032 (USD Billion)
50. China Plant-Based Bars Market, By Nature, 2019-2032 (USD Billion)
51. China Plant-Based Bars Market, By Product, 2019-2032 (USD Billion)
52. China Plant-Based Bars Market, By Distribution Channel, 2019-2032 (USD Billion)
53. India Plant-Based Bars Market, By Nature, 2019-2032 (USD Billion)
54. India Plant-Based Bars Market, By Product, 2019-2032 (USD Billion)
55. India Plant-Based Bars Market, By Distribution Channel, 2019-2032 (USD Billion)
56. South America Plant-Based Bars Market, By Nature, 2019-2032 (USD Billion)
57. South America Plant-Based Bars Market, By Product, 2019-2032 (USD Billion)
58. South America Plant-Based Bars Market, By Distribution Channel, 2019-2032 (USD Billion)
59. Brazil Plant-Based Bars Market, By Nature, 2019-2032 (USD Billion)
60. Brazil Plant-Based Bars Market, By Product, 2019-2032 (USD Billion)
61. Brazil Plant-Based Bars Market, By Distribution Channel, 2019-2032 (USD Billion)
62. Middle East and Africa Plant-Based Bars Market, By Nature, 2019-2032 (USD Billion)
63. Middle East and Africa Plant-Based Bars Market, By Product, 2019-2032 (USD Billion)
64. Middle East and Africa Plant-Based Bars Market, By Distribution Channel, 2019-2032 (USD Billion)
65. UAE Plant-Based Bars Market, By Nature, 2019-2032 (USD Billion)
66. UAE Plant-Based Bars Market, By Product, 2019-2032 (USD Billion)
67. UAE Plant-Based Bars Market, By Distribution Channel, 2019-2032 (USD Billion)
68. South Africa Plant-Based Bars Market, By Nature, 2019-2032 (USD Billion)
69. South Africa Plant-Based Bars Market, By Product, 2019-2032 (USD Billion)
70. South Africa Plant-Based Bars Market, By Distribution Channel, 2019-2032 (USD Billion)
List of Figures
1. Global Plant-Based Bars Market Segmentation
2. Plant-Based Bars Market: Research Methodology
3. Market Size Estimation Methodology: Bottom-Up Approach
4. Market Size Estimation Methodology: Top-Down Approach
5. Data Triangulation
6. Porter’s Five Forces Analysis
7. Value Chain Analysis
8. Global Plant-Based Bars Market Attractiveness Analysis by Nature
9. Global Plant-Based Bars Market Attractiveness Analysis by Product
10. Global Plant-Based Bars Market Attractiveness Analysis by Distribution Channel
11. Global Plant-Based Bars Market Attractiveness Analysis by Region
12. Global Plant-Based Bars Market: Dynamics
13. Global Plant-Based Bars Market Share by Nature (2022 & 2032)
14. Global Plant-Based Bars Market Share by Product (2022 & 2032)
15. Global Plant-Based Bars Market Share by Distribution Channel (2022 & 2032)
16. Global Plant-Based Bars Market Share by Regions (2022 & 2032)
17. Global Plant-Based Bars Market Share by Company (2022)
This study forecasts revenue at global, regional, and country levels from 2019 to 2032. The Brainy Insights has segmented the global plant-based bars market based on below-mentioned segments:
Global Plant-Based Bars Market by Nature:
Global Plant-Based Bars Market by Product:
Global Plant-Based Bars Market by Distribution Channel:
Global Plant-Based Bars Market by Region:
Research has its special purpose to undertake marketing efficiently. In this competitive scenario, businesses need information across all industry verticals; the information about customer wants, market demand, competition, industry trends, distribution channels etc. This information needs to be updated regularly because businesses operate in a dynamic environment. Our organization, The Brainy Insights incorporates scientific and systematic research procedures in order to get proper market insights and industry analysis for overall business success. The analysis consists of studying the market from a miniscule level wherein we implement statistical tools which helps us in examining the data with accuracy and precision.
Our research reports feature both; quantitative and qualitative aspects for any market. Qualitative information for any market research process are fundamental because they reveal the customer needs and wants, usage and consumption for any product/service related to a specific industry. This in turn aids the marketers/investors in knowing certain perceptions of the customers. Qualitative research can enlighten about the different product concepts and designs along with unique service offering that in turn, helps define marketing problems and generate opportunities. On the other hand, quantitative research engages with the data collection process through interviews, e-mail interactions, surveys and pilot studies. Quantitative aspects for the market research are useful to validate the hypotheses generated during qualitative research method, explore empirical patterns in the data with the help of statistical tools, and finally make the market estimations.
The Brainy Insights offers comprehensive research and analysis, based on a wide assortment of factual insights gained through interviews with CXOs and global experts and secondary data from reliable sources. Our analysts and industry specialist assume vital roles in building up statistical tools and analysis models, which are used to analyse the data and arrive at accurate insights with exceedingly informative research discoveries. The data provided by our organization have proven precious to a diverse range of companies, facilitating them to address issues such as determining which products/services are the most appealing, whether or not customers use the product in the manner anticipated, the purchasing intentions of the market and many others.
Our research methodology encompasses an idyllic combination of primary and secondary initiatives. Key phases involved in this process are listed below:

The phase involves the gathering and collecting of market data and its related information with the help of different sources & research procedures.

The data procurement stage involves in data gathering and collecting through various data sources.
This stage involves in extensive research. These data sources includes:
Purchased Database: Purchased databases play a crucial role in estimating the market sizes irrespective of the domain. Our purchased database includes:
Primary Research: The Brainy Insights interacts with leading companies and experts of the concerned domain to develop the analyst team’s market understanding and expertise. It improves and substantiates every single data presented in the market reports. Primary research mainly involves in telephonic interviews, E-mail interactions and face-to-face interviews with the raw material providers, manufacturers/producers, distributors, & independent consultants. The interviews that we conduct provides valuable data on market size and industry growth trends prevailing in the market. Our organization also conducts surveys with the various industry experts in order to gain overall insights of the industry/market. For instance, in healthcare industry we conduct surveys with the pharmacists, doctors, surgeons and nurses in order to gain insights and key information of a medical product/device/equipment which the customers are going to usage. Surveys are conducted in the form of questionnaire designed by our own analyst team. Surveys plays an important role in primary research because surveys helps us to identify the key target audiences of the market. Additionally, surveys helps to identify the key target audience engaged with the market. Our survey team conducts the survey by targeting the key audience, thus gaining insights from them. Based on the perspectives of the customers, this information is utilized to formulate market strategies. Moreover, market surveys helps us to understand the current competitive situation of the industry. To be precise, our survey process typically involve with the 360 analysis of the market. This analytical process begins by identifying the prospective customers for a product or service related to the market/industry to obtain data on how a product/service could fit into customers’ lives.

Secondary Research: The secondary data sources includes information published by the on-profit organizations such as World bank, WHO, company fillings, investor presentations, annual reports, national government documents, statistical databases, blogs, articles, white papers and others. From the annual report, we analyse a company’s revenue to understand the key segment and market share of that organization in a particular region. We analyse the company websites and adopt the product mapping technique which is important for deriving the segment revenue. In the product mapping method, we select and categorize the products offered by the companies catering to domain specific market, deduce the product revenue for each of the companies so as to get overall estimation of the market size. We also source data and analyses trends based on information received from supply side and demand side intermediaries in the value chain. The supply side denotes the data gathered from supplier, distributor, wholesaler and the demand side illustrates the data gathered from the end customers for respective market domain.

The supply side for a domain specific market is analysed by:
The demand side for the market is estimated through:
In-house Library: Apart from these third-party sources, we have our in-house library of qualitative and quantitative information. Our in-house database includes market data for various industry and domains. These data are updated on regular basis as per the changing market scenario. Our library includes, historic databases, internal audit reports and archives.
Sometimes there are instances where there is no metadata or raw data available for any domain specific market. For those cases, we use our expertise to forecast and estimate the market size in order to generate comprehensive data sets. Our analyst team adopt a robust research technique in order to produce the estimates:
Data Synthesis: This stage involves the analysis & mapping of all the information obtained from the previous step. It also involves in scrutinizing the data for any discrepancy observed while data gathering related to the market. The data is collected with consideration to the heterogeneity of sources. Robust scientific techniques are in place for synthesizing disparate data sets and provide the essential contextual information that can orient market strategies. The Brainy Insights has extensive experience in data synthesis where the data passes through various stages:


Market Deduction & Formulation: The final stage comprises of assigning data points at appropriate market spaces so as to deduce feasible conclusions. Analyst perspective & subject matter expert based holistic form of market sizing coupled with industry analysis also plays a crucial role in this stage.
This stage involves in finalization of the market size and numbers that we have collected from data integration step. With data interpolation, it is made sure that there is no gap in the market data. Successful trend analysis is done by our analysts using extrapolation techniques, which provide the best possible forecasts for the market.
Data Validation & Market Feedback: Validation is the most important step in the process. Validation & re-validation via an intricately designed process helps us finalize data-points to be used for final calculations.

The Brainy Insights interacts with leading companies and experts of the concerned domain to develop the analyst team’s market understanding and expertise. It improves and substantiates every single data presented in the market reports. The data validation interview and discussion panels are typically composed of the most experienced industry members. The participants include, however, are not limited to:
Moreover, we always validate our data and findings through primary respondents from all the major regions we are working on.


Free Customization
Fortune 500 Clients
Free Yearly Update On Purchase Of Multi/Corporate License
Companies Served Till Date