- +1-315-215-1633
- sales@thebrainyinsights.com

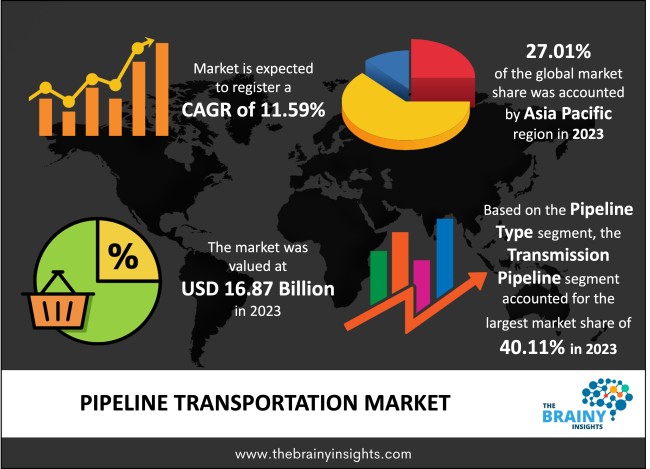
Global pipeline transportation market is expected to reach USD 50.51 billion by 2033, at a CAGR of 11.59% from 2024 to 2033. Global Pipeline Transportation market is witnessing a considerable growth owing to low operating costs, and environmental friendliness of pipeline transportation.
Pipeline transportation is an essential part of the economy as it is safe, efficient, and economical to transport energy resources from exploration areas to end-users, such as military bases, airports and others. The effectiveness of the pipeline also depends on technological solutions such as automation, networking, security, control, and tracking. Pipeline transportation has many advantages such as low operational cost, flexibility and environment-friendly. These pipes are perfect for unidirectional flow of goods, and inflationary influences have slight effect on the overall cost. Pipeline systems play a crucial part in transportation of fuels, chemical and water supply across the world, with connections to other critical infrastructure such as oilfields, power plants and airports. Pipeline systems have been used since 1880s due to its nature of being cost-effective and secure. Many pipelines across the globe transport chemically stable and flammable materials across long distances and have to cross all the physical regions like water expansions, terrains and hills. These pipelines also show an important role in the growth of any country and securing these organizations and providing connectivity options is of serious importance. The pipeline transportation market manufacturers and operators are putting very progressive technology in the control centers and pumping center, so that they don't need to have many people on the site. These days’ companies are putting huge amounts on pipeline infrastructure owing to government regulations and compliance issues. The system such as SCADA assist the operator to monitor and control industrial processing functions such as refining, tracking and pressure control. The companies have also established comprehensive pipeline solutions for better real time view of pipeline integrity over the wide system of pipelines. The advance technologies such as sensors, batch trackers and intrusion detection assist in the management of the pipeline as the operator that can make right decisions at the right time as wrong decision can lead to huge losses.
Get an overview of this study by requesting a free sample
Pipeline systems are in use since late 19th century owing to its nature of being economical and secure. Many of the pipelines across the world transport chemically stable and flammable materials over long distances and have to cross various physical features such as water expansions, terrains and hills. These pipelines also play a huge role in the development of any country and securing the infrastructures and providing connectivity options is of serious importance. The pipeline are used because of its low operating cost ant its friendliness. The pipeline transportation market manufacturers and operators are putting very progressive technology in the control centers and pumping center, so that they don't need to have many people on the site.
Increased demand for oil and natural gas, rise in the production of offshore production and the demand for cheaper methods of transportation have encouraged the companies to accelerate the process of building the pipelines for transportation of their products. Long-distance pipelines are efficient and are an economical mode of transport for natural resources, especially oil and gas. For example, 70% of the oil produced in Canada is shipped to the refineries in the U.S. through pipelines as it is cheaper than rail.
Major worries for the pipelines are explosive material and conveying flammable materials such as oil and natural gas. Pipelines are also an objective for sabotage and vandalism. Pipeline needs maintenance and surveillance. Information and communication technology helps reduce cost, streamline the management process, ensure safety and security, and improve communication efficiency.
Pricing, costs, financing, and politics are main among the issues that can hamper construction of major, cross-border gas-pipeline projects trying to connect plentiful reserves with unsatisfied market demand. Also, the major worry of safety arises when pipelines are carrying flammable or explosive material, such as natural gas or oil. Pipelines can be the target for destruction or sabotage.
Information communication technology (ICT) can help reduce the costs, streamline the management process, improve communication efficiency, and ensure safety and security. All these issues pose lucrative opportunities for companies providing ICT solutions and services in the market. Offerings of the market players revolve around automation and digitization of pipeline operations, minimization of downtimes, supervisory control and data acquisition, safety and security solutions along with others. Leading market players such as ABB, Siemens, Schneider Electric and many more are already providing comprehensive solutions based on the type of pipelines and the challenges faced by them. They also offer unique solutions to enhance the pipeline operations by providing solutions such as Pipeline Integrity Management Solutions (PIMS), SCADA and other pipeline management system software.
The global pipeline transportation market has been segmented based on type, pipeline type, solution, services, end user and regions.
The regions analyzed for the market include North America, Europe, South America, Asia Pacific, and the Middle East and Africa. Asia Pacific was the largest region in the global pipeline transportation market, accounting for 27.01% of the market in 2023.
Asia Pacific Pipeline Transportation Market Share in 2023 - 27.01%
www.thebrainyinsights.com
Check the geographical analysis of this market by requesting a free sample
Developing and developed countries are offering greater opportunities and major players are continuously focused on new developments, strategic partnerships, acquisitions and venture capital investments to obtain high growth in the market.
In September 2019, Arkad-ABB SpA, as a member of the consortium led by the Saudi engineering and construction group Arkad, has signed a contract with Bulgartransgaz EAD, a natural gas combined operator, to engineer, procure, construct and fund (EPC&F) a gas pipeline system expansion in Bulgaria.
In September 2017, Schneider Electric Software hosted its midstream industry user conference, Innovation Summit: Digital Pipelines 2017. At this event, Schneider Electric Software made a number of significant product release announcements that deliver enhanced functionality and usability to users of Schneider Electric's pipeline management software.
As per The Brainy Insights, the size of the pipeline transportation market was valued at USD 16.87 billion in 2023 and is anticipated to reach USD 50.51 billion by 2033.
Global pipeline transportation market is growing at a CAGR of 11.59% during the forecast period 2024-2033.
The Asia Pacific region emerged as the largest market for the pipeline transportation.
Low operating costs, and environmental friendliness is the key driving factor for the pipeline transportation market.
Safety issues when pipelines are conveying flammable or explosive material is likely to hamper the market growth.
Demand for offshore oilfield communication solution will provide huge opportunities to the market.
Key players are Alstom, ABB Ltd, Schneider Electric, Siemens, ESRI, Emerson, Trimble Navigation Limited, Rockwell Automation.
1. Introduction
1.1. Objectives of the Study
1.2. Market Definition
1.3. Research Scope
1.4. Currency
1.5. Key Target Audience
2. Research Methodology and Assumptions
3. Executive Summary
4. Premium Insights
4.1. Porter’s Five Forces Analysis
4.2. Value Chain Analysis
4.3. Top Investment Pockets
4.3.1. Market Attractiveness Analysis By Type
4.3.2. Market Attractiveness Analysis By Pipeline Types
4.3.3. Market Attractiveness Analysis By Services
4.3.4. Market Attractiveness Analysis By Solution
4.3.5. Market Attractiveness Analysis By End User
4.3.6. Market Attractiveness Analysis By Region
4.4. Industry Trends
5. Market Dynamics
5.1. Market Evaluation
5.2. Drivers
5.2.1. Low operating costs, and environmental friendliness
5.2.2. The increase in oil demand
5.3. Restrains
5.3.1. Safety issues when pipelines are conveying flammable or explosive material
5.3.2. Problems in Cross-Border Pipelines Transportation
5.4. Opportunities
5.4.1. Demand for offshore oilfield communication solution
6. Global Pipeline Transportation Market Analysis and Forecast, By Type
6.1. Segment Overview
6.2. Oil and Gas
6.3. Coal
6.4. Water
6.5. Others
7. Global Pipeline Transportation Market Analysis and Forecast, By Pipeline Types
7.1. Segment Overview
7.2. Gathering Pipeline
7.3. Transmission Pipeline
7.4. Distribution Pipeline
8. Global Pipeline Transportation Market Analysis and Forecast, By Services
8.1. Segment Overview
8.2. Consulting Services
8.3. Management Services
8.4. Maintenance and Support Services
9. Global Pipeline Transportation Market Analysis and Forecast, By Solution
9.1. Segment Overview
9.2. Security Solution
9.3. Automation and Control Solution
9.4. Integrity and Tracking Solution
9.5. Network Communication Solution
10. Global Pipeline Transportation Market Analysis and Forecast, By End User
10.1. Segment Overview
10.2. Transportation Industry
10.3. Refiners & Manufacturers
10.4. Agriculture Industry
10.5. Heating Resources
11. Global Pipeline Transportation Market Analysis and Forecast, By Regional Analysis
11.1. Segment Overview
11.2. North America
11.2.1. U.S.
11.2.2. Canada
11.2.3. Mexico
11.3. Europe
11.3.1. Germany
11.3.2. France
11.3.3. U.K.
11.3.4. Italy
11.3.5. Spain
11.4. Asia-Pacific
11.4.1. Japan
11.4.2. China
11.4.3. India
11.5. South America
11.5.1. Brazil
11.6. Middle East and Africa
11.6.1. UAE
11.6.2. South Africa
12. Global Pipeline Transportation Market-Competitive Landscape
12.1. Overview
12.2. Market Share of Key Players in Global Pipeline Transportation Market
12.2.1. Global Company Market Share
12.2.2. North America Company Market Share
12.2.3. Europe Company Market Share
12.2.4. APAC Company Market Share
12.3. Competitive Situations and Trends
12.3.1. Product Launches and Developments
12.3.2. Partnerships, Collaborations, and Agreements
12.3.3. Mergers & Acquisitions
12.3.4. Expansions
13. Company Profiles
13.1. Alstom
13.1.1. Business Overview
13.1.2. Company Snapshot
13.1.3. Company Market Share Analysis
13.1.4. Company Product Portfolio
13.1.5. Recent Developments
13.1.6. SWOT Analysis
13.2. ABB Ltd
13.2.1. Business Overview
13.2.2. Company Snapshot
13.2.3. Company Market Share Analysis
13.2.4. Company Product Portfolio
13.2.5. Recent Developments
13.2.6. SWOT Analysis
13.3. Schneider Electric
13.3.1. Business Overview
13.3.2. Company Snapshot
13.3.3. Company Market Share Analysis
13.3.4. Company Product Portfolio
13.3.5. Recent Developments
13.3.6. SWOT Analysis
13.4. Siemens
13.4.1. Business Overview
13.4.2. Company Snapshot
13.4.3. Company Market Share Analysis
13.4.4. Company Product Portfolio
13.4.5. Recent Developments
13.4.6. SWOT Analysis
13.5. ESRI
13.5.1. Business Overview
13.5.2. Company Snapshot
13.5.3. Company Market Share Analysis
13.5.4. Company Product Portfolio
13.5.5. Recent Developments
13.5.6. SWOT Analysis
13.6. Emerson
13.6.1. Business Overview
13.6.2. Company Snapshot
13.6.3. Company Market Share Analysis
13.6.4. Company Product Portfolio
13.6.5. Recent Developments
13.6.6. SWOT Analysis
13.7. Trimble Navigation Limited
13.7.1. Business Overview
13.7.2. Company Snapshot
13.7.3. Company Market Share Analysis
13.7.4. Company Product Portfolio
13.7.5. Recent Developments
13.7.6. SWOT Analysis
13.8. Rockwell Automation
13.8.1. Business Overview
13.8.2. Company Snapshot
13.8.3. Company Market Share Analysis
13.8.4. Company Product Portfolio
13.8.5. Recent Developments
13.8.6. SWOT Analysis
13.9. FMC Technologies
13.9.1. Business Overview
13.9.2. Company Snapshot
13.9.3. Company Market Share Analysis
13.9.4. Company Product Portfolio
13.9.5. Recent Developments
13.9.6. SWOT Analysis
13.10. Alcatel-Lucent
13.10.1. Business Overview
13.10.2. Company Snapshot
13.10.3. Company Market Share Analysis
13.10.4. Company Product Portfolio
13.10.5. Recent Developments
13.10.6. SWOT Analysis
List of Table
1. Global Pipeline Transportation Market, By Type, 2020–2033 (USD Billion)
2. Global Oil and Gas, Pipeline Transportation Market, By Region, 2020–2033 (USD Billion)
3. Global Coal, Pipeline Transportation Market, By Region, 2020–2033 (USD Billion)
4. Global Water, Pipeline Transportation Market, By Region, 2020–2033 (USD Billion)
5. Global Others, Pipeline Transportation Market, By Region, 2020–2033 (USD Billion)
6. Global Pipeline Transportation Market, By Pipeline Types, 2020–2033 (USD Billion)
7. Global Gathering Pipeline Pipeline Transportation Market, By Region, 2020–2033 (USD Billion)
8. Global Transmission Pipeline Pipeline Transportation Market, By Region, 2020–2033 (USD Billion)
9. Global Distribution Pipeline Pipeline Transportation Market, By Region, 2020–2033 (USD Billion)
10. Global Pipeline Transportation Market, By Services, 2020–2033 (USD Billion)
11. Global Consulting Services Pipeline Transportation Market, By Region, 2020–2033 (USD Billion)
12. Global Management Services Pipeline Transportation Market, By Region, 2020–2033 (USD Billion)
13. Global Maintenance and Support Services Pipeline Transportation Market, By Region, 2020–2033 (USD Billion)
14. Global Pipeline Transportation Market, By Solution, 2020–2033 (USD Billion)
15. Global Security Solution Pipeline Transportation Market, By Region, 2020–2033 (USD Billion)
16. Global Automation and Control Solution Pipeline Transportation Market, By Region, 2020–2033 (USD Billion)
17. Global Integrity and Tracking Solution, Aircraft Pipeline Transportation Market, By Region, 2020–2033 (USD Billion)
18. Global Network Communication Solution, Aircraft Pipeline Transportation Market, By Region, 2020–2033 (USD Billion)
19. Global Pipeline Transportation Market, By End User, 2020–2033 (USD Billion)
20. Global Transportation Industry Pipeline Transportation Market, By Region, 2020–2033 (USD Billion)
21. Global Refiners & Manufacturers Pipeline Transportation Market, By Region, 2020–2033 (USD Billion)
22. Global Agriculture Industry Pipeline Transportation Market, By Region, 2020–2033 (USD Billion)
23. Global Heating Resources Pipeline Transportation Market, By Region, 2020–2033 (USD Billion)
24. Global Pipeline Transportation Market, By Region, 2020–2033 (USD Billion)
25. Global Pipeline Transportation Market, By North America, 2020–2033 (USD Billion)
26. North America Pipeline Transportation Market, By Type, 2020–2033 (USD Billion)
27. North America Pipeline Transportation Market, By Pipeline Types, 2020–2033 (USD Billion)
28. North America Pipeline Transportation Market, By Services, 2020–2033 (USD Billion)
29. North America Pipeline Transportation Market, By Solution, 2020–2033 (USD Billion)
30. North America Pipeline Transportation Market, By End User, 2020–2033 (USD Billion)
31. U.S. Pipeline Transportation Market, By Type, 2020–2033 (USD Billion)
32. U.S. Pipeline Transportation Market, By Pipeline Types, 2020–2033 (USD Billion)
33. U.S. Pipeline Transportation Market, By Services, 2020–2033 (USD Billion)
34. U.S. Pipeline Transportation Market, By Solution, 2020–2033 (USD Billion)
35. U.S. Pipeline Transportation Market, By End User, 2020–2033 (USD Billion)
36. Canada Pipeline Transportation Market, By Type, 2020–2033 (USD Billion)
37. Canada Pipeline Transportation Market, By Pipeline Types, 2020–2033 (USD Billion)
38. Canada Pipeline Transportation Market, By Services, 2020–2033 (USD Billion)
39. Canada Pipeline Transportation Market, By Solution, 2020–2033 (USD Billion)
40. Canada Pipeline Transportation Market, By End User, 2020–2033 (USD Billion)
41. Mexico Pipeline Transportation Market, By Type, 2020–2033 (USD Billion)
42. Mexico Pipeline Transportation Market, By Pipeline Types, 2020–2033 (USD Billion)
43. Mexico Pipeline Transportation Market, By Services, 2020–2033 (USD Billion)
44. Mexico Pipeline Transportation Market, By Solution, 2020–2033 (USD Billion)
45. Mexico Pipeline Transportation Market, By End User, 2020–2033 (USD Billion)
46. Europe Pipeline Transportation Market, By Type, 2020–2033 (USD Billion)
47. Europe Pipeline Transportation Market, By Pipeline Types, 2020–2033 (USD Billion)
48. Europe Pipeline Transportation Market, By Services, 2020–2033 (USD Billion)
49. Europe Pipeline Transportation Market, By Solution, 2020–2033 (USD Billion)
50. Europe Pipeline Transportation Market, By End User, 2020–2033 (USD Billion)
51. Germany Pipeline Transportation Market, By Type, 2020–2033 (USD Billion)
52. Germany Pipeline Transportation Market, By Pipeline Types, 2020–2033 (USD Billion)
53. Germany Pipeline Transportation Market, By Services, 2020–2033 (USD Billion)
54. Germany Pipeline Transportation Market, By Solution, 2020–2033 (USD Billion)
55. Germany Pipeline Transportation Market, By End User, 2020–2033 (USD Billion)
56. France Pipeline Transportation Market, By Type, 2020–2033 (USD Billion)
57. France Pipeline Transportation Market, By Pipeline Types, 2020–2033 (USD Billion)
58. France Pipeline Transportation Market, By Services, 2020–2033 (USD Billion)
59. France Pipeline Transportation Market, By Solution, 2020–2033 (USD Billion)
60. France Pipeline Transportation Market, By End User, 2020–2033 (USD Billion)
61. U.K. Pipeline Transportation Market, By Type, 2020–2033 (USD Billion)
62. U.K. Pipeline Transportation Market, By Pipeline Types, 2020–2033 (USD Billion)
63. U.K. Pipeline Transportation Market, By Services, 2020–2033 (USD Billion)
64. U.K. Pipeline Transportation Market, By Solution, 2020–2033 (USD Billion)
65. U.K. Pipeline Transportation Market, By End User, 2020–2033 (USD Billion)
66. Italy Pipeline Transportation Market, By Type, 2020–2033 (USD Billion)
67. Italy Pipeline Transportation Market, By Pipeline Types, 2020–2033 (USD Billion)
68. Italy Pipeline Transportation Market, By Services, 2020–2033 (USD Billion)
69. Italy Pipeline Transportation Market, By Solution, 2020–2033 (USD Billion)
70. Italy Pipeline Transportation Market, By End User, 2020–2033 (USD Billion)
71. Spain Pipeline Transportation Market, By Type, 2020–2033 (USD Billion)
72. Spain Pipeline Transportation Market, By Pipeline Types, 2020–2033 (USD Billion)
73. Spain Pipeline Transportation Market, By Services, 2020–2033 (USD Billion)
74. Spain Pipeline Transportation Market, By Solution, 2020–2033 (USD Billion)
75. Spain Pipeline Transportation Market, By End User, 2020–2033 (USD Billion)
76. Asia Pacific Pipeline Transportation Market, By Type, 2020–2033 (USD Billion)
77. Asia Pacific Pipeline Transportation Market, By Pipeline Types, 2020–2033 (USD Billion)
78. Asia Pacific Pipeline Transportation Market, By Services, 2020–2033 (USD Billion)
79. Asia Pacific Pipeline Transportation Market, By Solution, 2020–2033 (USD Billion)
80. Asia Pacific Pipeline Transportation Market, By End User, 2020–2033 (USD Billion)
81. Japan Pipeline Transportation Market, By Type, 2020–2033 (USD Billion)
82. Japan Pipeline Transportation Market, By Pipeline Types, 2020–2033 (USD Billion)
83. Japan Pipeline Transportation Market, By Services, 2020–2033 (USD Billion)
84. Japan Pipeline Transportation Market, By Solution, 2020–2033 (USD Billion)
85. Japan Pipeline Transportation Market, By End User, 2020–2033 (USD Billion)
86. China Pipeline Transportation Market, By Type, 2020–2033 (USD Billion)
87. China Pipeline Transportation Market, By Pipeline Types, 2020–2033 (USD Billion)
88. China Pipeline Transportation Market, By Services, 2020–2033 (USD Billion)
89. China Pipeline Transportation Market, By Solution, 2020–2033 (USD Billion)
90. China Pipeline Transportation Market, By End User, 2020–2033 (USD Billion)
91. India Pipeline Transportation Market, By Type, 2020–2033 (USD Billion)
92. India Pipeline Transportation Market, By Pipeline Types, 2020–2033 (USD Billion)
93. India Pipeline Transportation Market, By Services, 2020–2033 (USD Billion)
94. India Pipeline Transportation Market, By Solution, 2020–2033 (USD Billion)
95. India Pipeline Transportation Market, By End User, 2020–2033 (USD Billion)
96. South America Pipeline Transportation Market, By Type, 2020–2033 (USD Billion)
97. South America Pipeline Transportation Market, By Pipeline Types, 2020–2033 (USD Billion)
98. South America Pipeline Transportation Market, By Services, 2020–2033 (USD Billion)
99. South America Pipeline Transportation Market, By Solution, 2020–2033 (USD Billion)
100. South America Pipeline Transportation Market, By End User, 2020–2033 (USD Billion)
101. Brazil Pipeline Transportation Market, By Type, 2020–2033 (USD Billion)
102. Brazil Pipeline Transportation Market, By Pipeline Types, 2020–2033 (USD Billion)
103. Brazil Pipeline Transportation Market, By Services, 2020–2033 (USD Billion)
104. Brazil Pipeline Transportation Market, By Solution, 2020–2033 (USD Billion)
105. Brazil Pipeline Transportation Market, By End User, 2020–2033 (USD Billion)
106. Middle East and Africa Pipeline Transportation Market, By Type, 2020–2033 (USD Billion)
107. Middle East and Africa Pipeline Transportation Market, By Pipeline Types, 2020–2033 (USD Billion)
108. Middle East and Africa Pipeline Transportation Market, By Services, 2020–2033 (USD Billion)
109. Middle East and Africa Pipeline Transportation Market, By Solution, 2020–2033 (USD Billion)
110. Middle East and Africa Pipeline Transportation Market, By End User, 2020–2033 (USD Billion)
111. UAE Pipeline Transportation Market, By Type, 2020–2033 (USD Billion)
112. UAE Pipeline Transportation Market, By Pipeline Types, 2020–2033 (USD Billion)
113. UAE Pipeline Transportation Market, By Services, 2020–2033 (USD Billion)
114. UAE Pipeline Transportation Market, By Solution, 2020–2033 (USD Billion)
115. UAE Pipeline Transportation Market, By End User, 2020–2033 (USD Billion)
116. South Africa Pipeline Transportation Market, By Type, 2020–2033 (USD Billion)
117. South Africa Pipeline Transportation Market, By Pipeline Types, 2020–2033 (USD Billion)
118. South Africa Pipeline Transportation Market, By Services, 2020–2033 (USD Billion)
119. South Africa Pipeline Transportation Market, By Solution, 2020–2033 (USD Billion)
120. South Africa Pipeline Transportation Market, By End User, 2020–2033 (USD Billion)
List of Figures
1. Global Pipeline Transportation Market Segmentation
2. Pipeline Transportation Market: Research Methodology
3. Market Size Estimation Methodology: Bottom-Up Approach
4. Market Size Estimation Methodology: Top-Down Approach
5. Data Triangulation
6. Porter’s Five Forces Analysis
7. Value Chain Analysis
8. Global Pipeline Transportation Market Attractiveness Analysis By Type
9. Global Pipeline Transportation Market Attractiveness Analysis By Pipeline Types
10. Global Pipeline Transportation Market Attractiveness Analysis By Services
11. Global Pipeline Transportation Market Attractiveness Analysis By Solution
12. Global Pipeline Transportation Market Attractiveness Analysis By End User
13. Global Pipeline Transportation Market Attractiveness Analysis By Region
14. Global Pipeline Transportation Market: Dynamics
15. Global Pipeline Transportation Market Share By Type (2023 & 2033)
16. Global Pipeline Transportation Market Share By Pipeline Types (2023 & 2033)
17. Global Pipeline Transportation Market Share By Services (2023 & 2033)
18. Global Pipeline Transportation Market Share By Solution (2023 & 2033)
19. Global Pipeline Transportation Market Share By End User (2023 & 2033)
20. Global Pipeline Transportation Market Share by Regions (2023 & 2033)
21. Global Pipeline Transportation Market Share by Company (2023)
This study forecasts revenue at global, regional, and country levels from 2020 to 2033. The Brainy Insights has segmented the global Pipeline Transportation market on the basis of below mentioned segments:
Global Pipeline Transportation Market by Type:
Global Pipeline Transportation Market by Pipeline Types:
Global Pipeline Transportation Market by Services:
Global Pipeline Transportation Market by Solution:
Global Pipeline Transportation Market by End User:
Global Pipeline Transportation Market by Region:
Research has its special purpose to undertake marketing efficiently. In this competitive scenario, businesses need information across all industry verticals; the information about customer wants, market demand, competition, industry trends, distribution channels etc. This information needs to be updated regularly because businesses operate in a dynamic environment. Our organization, The Brainy Insights incorporates scientific and systematic research procedures in order to get proper market insights and industry analysis for overall business success. The analysis consists of studying the market from a miniscule level wherein we implement statistical tools which helps us in examining the data with accuracy and precision.
Our research reports feature both; quantitative and qualitative aspects for any market. Qualitative information for any market research process are fundamental because they reveal the customer needs and wants, usage and consumption for any product/service related to a specific industry. This in turn aids the marketers/investors in knowing certain perceptions of the customers. Qualitative research can enlighten about the different product concepts and designs along with unique service offering that in turn, helps define marketing problems and generate opportunities. On the other hand, quantitative research engages with the data collection process through interviews, e-mail interactions, surveys and pilot studies. Quantitative aspects for the market research are useful to validate the hypotheses generated during qualitative research method, explore empirical patterns in the data with the help of statistical tools, and finally make the market estimations.
The Brainy Insights offers comprehensive research and analysis, based on a wide assortment of factual insights gained through interviews with CXOs and global experts and secondary data from reliable sources. Our analysts and industry specialist assume vital roles in building up statistical tools and analysis models, which are used to analyse the data and arrive at accurate insights with exceedingly informative research discoveries. The data provided by our organization have proven precious to a diverse range of companies, facilitating them to address issues such as determining which products/services are the most appealing, whether or not customers use the product in the manner anticipated, the purchasing intentions of the market and many others.
Our research methodology encompasses an idyllic combination of primary and secondary initiatives. Key phases involved in this process are listed below:

The phase involves the gathering and collecting of market data and its related information with the help of different sources & research procedures.

The data procurement stage involves in data gathering and collecting through various data sources.
This stage involves in extensive research. These data sources includes:
Purchased Database: Purchased databases play a crucial role in estimating the market sizes irrespective of the domain. Our purchased database includes:
Primary Research: The Brainy Insights interacts with leading companies and experts of the concerned domain to develop the analyst team’s market understanding and expertise. It improves and substantiates every single data presented in the market reports. Primary research mainly involves in telephonic interviews, E-mail interactions and face-to-face interviews with the raw material providers, manufacturers/producers, distributors, & independent consultants. The interviews that we conduct provides valuable data on market size and industry growth trends prevailing in the market. Our organization also conducts surveys with the various industry experts in order to gain overall insights of the industry/market. For instance, in healthcare industry we conduct surveys with the pharmacists, doctors, surgeons and nurses in order to gain insights and key information of a medical product/device/equipment which the customers are going to usage. Surveys are conducted in the form of questionnaire designed by our own analyst team. Surveys plays an important role in primary research because surveys helps us to identify the key target audiences of the market. Additionally, surveys helps to identify the key target audience engaged with the market. Our survey team conducts the survey by targeting the key audience, thus gaining insights from them. Based on the perspectives of the customers, this information is utilized to formulate market strategies. Moreover, market surveys helps us to understand the current competitive situation of the industry. To be precise, our survey process typically involve with the 360 analysis of the market. This analytical process begins by identifying the prospective customers for a product or service related to the market/industry to obtain data on how a product/service could fit into customers’ lives.

Secondary Research: The secondary data sources includes information published by the on-profit organizations such as World bank, WHO, company fillings, investor presentations, annual reports, national government documents, statistical databases, blogs, articles, white papers and others. From the annual report, we analyse a company’s revenue to understand the key segment and market share of that organization in a particular region. We analyse the company websites and adopt the product mapping technique which is important for deriving the segment revenue. In the product mapping method, we select and categorize the products offered by the companies catering to domain specific market, deduce the product revenue for each of the companies so as to get overall estimation of the market size. We also source data and analyses trends based on information received from supply side and demand side intermediaries in the value chain. The supply side denotes the data gathered from supplier, distributor, wholesaler and the demand side illustrates the data gathered from the end customers for respective market domain.

The supply side for a domain specific market is analysed by:
The demand side for the market is estimated through:
In-house Library: Apart from these third-party sources, we have our in-house library of qualitative and quantitative information. Our in-house database includes market data for various industry and domains. These data are updated on regular basis as per the changing market scenario. Our library includes, historic databases, internal audit reports and archives.
Sometimes there are instances where there is no metadata or raw data available for any domain specific market. For those cases, we use our expertise to forecast and estimate the market size in order to generate comprehensive data sets. Our analyst team adopt a robust research technique in order to produce the estimates:
Data Synthesis: This stage involves the analysis & mapping of all the information obtained from the previous step. It also involves in scrutinizing the data for any discrepancy observed while data gathering related to the market. The data is collected with consideration to the heterogeneity of sources. Robust scientific techniques are in place for synthesizing disparate data sets and provide the essential contextual information that can orient market strategies. The Brainy Insights has extensive experience in data synthesis where the data passes through various stages:


Market Deduction & Formulation: The final stage comprises of assigning data points at appropriate market spaces so as to deduce feasible conclusions. Analyst perspective & subject matter expert based holistic form of market sizing coupled with industry analysis also plays a crucial role in this stage.
This stage involves in finalization of the market size and numbers that we have collected from data integration step. With data interpolation, it is made sure that there is no gap in the market data. Successful trend analysis is done by our analysts using extrapolation techniques, which provide the best possible forecasts for the market.
Data Validation & Market Feedback: Validation is the most important step in the process. Validation & re-validation via an intricately designed process helps us finalize data-points to be used for final calculations.

The Brainy Insights interacts with leading companies and experts of the concerned domain to develop the analyst team’s market understanding and expertise. It improves and substantiates every single data presented in the market reports. The data validation interview and discussion panels are typically composed of the most experienced industry members. The participants include, however, are not limited to:
Moreover, we always validate our data and findings through primary respondents from all the major regions we are working on.


Free Customization
Fortune 500 Clients
Free Yearly Update On Purchase Of Multi/Corporate License
Companies Served Till Date