- +1-315-215-1633
- sales@thebrainyinsights.com

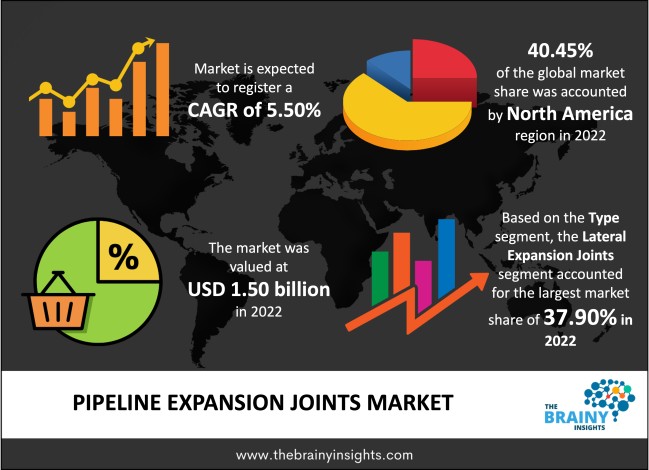
The global pipeline expansion joints market is expected to reach USD 2.56 billion by 2032, at a CAGR of 5.50% during the forecast period 2023 to 2032. Asia Pacific is expected to grow the fastest during the forecast period.
Pipeline expansion joints are an essential part of pipe systems as they are used in several industries for thermal expansion. These joints are manufactured uniquely to safely absorb the dimensional variations of steel pipe systems and dust. Dimensional changes can occur due to pressure deformations, heat-induced expansion and contraction, installation misalignment, vibrations caused by moving machinery, or building settlements. Pipeline expansion joints absorb all these changes for better performance of the pipe system. These joints also reduce dimensional changes and thermal expansion strains in pipe systems. As well as pipe loads connections to sensitive equipment such as pumps and steam turbines. Taken collectively, this decreases the likelihood of downtime for extra maintenance and repair by increasing the service life of pipe systems. A pipeline expansion joint helps remove the electrolysis between dissimilar metals. In addition to this, it also helps to reduce vibration and mechanical noise.
Get an overview of this study by requesting a free sample
The Rise in Metal Expansion Joints Market- Metal expansion joints are commonly utilized in pipeline systems. The expanding industrial use of pipeline infrastructure drives the market for metal expansion joints. Furthermore, low-pressure bellows, which make pipe flow easier, are a recent breakthrough in the pipeline expansion joints market. The ability of pipeline expansion joints to withstand severe pressures and temperatures drives the market growth. Furthermore, pipeline expansion joints take up less space when fitted and require less maintenance. This reason is expected to drive the market’s growth.
Damage due to Extra Weight- Damage may occur if the pipeline expansion joints are too close together or are being loaded with extra weight. As the joints cannot bear extra weight, it acts like a restraint to the market.
Technological Advancements- Rising end-user sector demand, infrastructure development investments, and technological advancements represent considerable growth opportunities for the global pipeline expansion joint market during the forecast period. Furthermore, pipeline expansion joints are increasingly employed in renewable energy installations, which is also expected to boost market growth during the forecast period.
Designing Issues- Pump nozzles, valve bodies, and pipe anchors may experience excessive loading and vibrational fatigue if pipeline expansion joints are not well-designed and well-placed. This rationale is expected to challenge the market’s growth over the forecast period.
The regions analyzed for the market include North America, Europe, South America, Asia Pacific, the Middle East, and Africa. North America emerged as the largest market for the global pipeline expansion joints market, with a 40.45% market revenue share in 2022.
North America dominates the pipeline expansion joints market with a 40.45% market revenue share in 2022. The rising demand for oil and gas, which is causing an increase in construction activities related to infrastructure development, may help the region's growth. Furthermore, pipeline expansion joints are in high demand since they are widely used in various industries, including power plants, petrochemical plants, etc.
Asia Pacific is expected to witness the fastest growth during the forecast period. The expansion of the petrochemical industry and the rise in demand for pipeline expansion joint products in various applications are the primary drivers of market growth.
North America Region Pipeline Expansion Joints Market Share in 2022 - 40.45%
www.thebrainyinsights.com
Check the geographical analysis of this market by requesting a free sample
The type segment is divided into axial expansion joints, angular expansion joints, lateral expansion joints, and universal expansion joints. The lateral expansion joints segment dominated the market, with a market share of around 37.90% in 2022. Lateral expansion joints have a simple design, making them more prominent among the market players. Despite the relatively low fixed point load, its movements on a plane are absorbed in all directions, which propels the segment’s growth.
The application segment is divided into the petrochemical industry, heavy industry, power generation industry, and others. The power generation industry segment dominated the market, with a market share of around 41.79% in 2022. The power generation industry uses pipeline expansion joints to connect equipment, pipes, and other components. However, thermal stresses, vibrations, and mechanical stress are some damages in the power generation industry.
| Attribute | Description |
|---|---|
| Market Size | Revenue (USD Billion) |
| Market size value in 2022 | USD 1.50 billion |
| Market size value in 2032 | USD 2.56 billion |
| CAGR (2023 to 2032) | 5.50% |
| Historical data | 2019-2021 |
| Base Year | 2022 |
| Forecast | 2023-2032 |
| Regional Segments | North America, Asia Pacific, Europe, Latin America, Middle East and Africa |
| Segments | Type, Application |
As per The Brainy Insights, the size of the pipeline expansion joints market was valued at USD 1.50 billion in 2022 to USD 2.56 billion by 2032.
The global pipeline expansion joints market is growing at a CAGR of 5.50% during the forecast period 2023-2032.
North America emerged as the largest pipeline expansion joints market.
1. Introduction
1.1. Objectives of the Study
1.2. Market Definition
1.3. Research Scope
1.4. Currency
1.5. Key Target Audience
2. Research Methodology and Assumptions
3. Executive Summary
4. Premium Insights
4.1. Porter’s Five Forces Analysis
4.2. Value Chain Analysis
4.3. Top Investment Pockets
4.3.1. Market Attractiveness Analysis by Type
4.3.2. Market Attractiveness Analysis by Application
4.3.3. Market Attractiveness Analysis by Region
4.4. Industry Trends
5. Market Dynamics
5.1. Market Evaluation
5.2. Drivers
5.2.1. The Rise in Metal Expansion Joints Market
5.3. Restraints
5.3.1. Damage due to extra weight
5.4. Opportunities
5.4.1. Technological Advancements
5.5. Challenges
5.5.1. Designing Issues
6. Global Pipeline Expansion Joints Market Analysis and Forecast, By Type
6.1. Segment Overview
6.2. Angular Expansion Joints
6.3. Axial Expansion Joints
6.4. Universal Expansion Joints
6.5. Lateral Expansion Joints
7. Global Pipeline Expansion Joints Market Analysis and Forecast, By Application
7.1. Segment Overview
7.2. Power Generation Industry
7.3. Heavy Industry
7.4. Petrochemical Industry
7.5. Others
8. Global Pipeline Expansion Joints Market Analysis and Forecast, By Regional Analysis
8.1. Segment Overview
8.2. North America
8.2.1. U.S.
8.2.2. Canada
8.2.3. Mexico
8.3. Europe
8.3.1. Germany
8.3.2. France
8.3.3. U.K.
8.3.4. Italy
8.3.5. Spain
8.4. Asia-Pacific
8.4.1. Japan
8.4.2. China
8.4.3. India
8.5. South America
8.5.1. Brazil
8.6. Middle East and Africa
8.6.1. UAE
8.6.2. South Africa
9. Global Pipeline Expansion Joints Market-Competitive Landscape
9.1. Overview
9.2. Market Share of Key Players in Global Pipeline Expansion Joints Market
9.2.1. Global Company Market Share
9.2.2. North America Company Market Share
9.2.3. Europe Company Market Share
9.2.4. APAC Company Market Share
9.3. Competitive Situations and Trends
9.3.1. Product Launches and Developments
9.3.2. Partnerships, Collaborations, and Agreements
9.3.3. Mergers & Acquisitions
9.3.4. Expansions
10. Company Profiles
10.1. EagleBurgmann
10.1.1. Business Overview
10.1.2. Company Snapshot
10.1.3. Company Market Share Analysis
10.1.4. Company Product Portfolio
10.1.5. Recent Developments
10.1.6. SWOT Analysis
10.2. BIKAR-METALLE GMBH
10.2.1. Business Overview
10.2.2. Company Snapshot
10.2.3. Company Market Share Analysis
10.2.4. Company Product Portfolio
10.2.5. Recent Developments
10.2.6. SWOT Analysis
10.3. Triad Bellows
10.3.1. Business Overview
10.3.2. Company Snapshot
10.3.3. Company Market Share Analysis
10.3.4. Company Product Portfolio
10.3.5. Recent Developments
10.3.6. SWOT Analysis
10.4. Senior Flexonics
10.4.1. Business Overview
10.4.2. Company Snapshot
10.4.3. Company Market Share Analysis
10.4.4. Company Product Portfolio
10.4.5. Recent Developments
10.4.6. SWOT Analysis
10.5. Garlock
10.5.1. Business Overview
10.5.2. Company Snapshot
10.5.3. Company Market Share Analysis
10.5.4. Company Product Portfolio
10.5.5. Recent Developments
10.5.6. SWOT Analysis
10.6. American BOA
10.6.1. Business Overview
10.6.2. Company Snapshot
10.6.3. Company Market Share Analysis
10.6.4. Company Product Portfolio
10.6.5. Recent Developments
10.6.6. SWOT Analysis
10.7. Metraflex
10.7.1. Business Overview
10.7.2. Company Snapshot
10.7.3. Company Market Share Analysis
10.7.4. Company Product Portfolio
10.7.5. Recent Developments
10.7.6. SWOT Analysis
10.8. NiCoForm
10.8.1. Business Overview
10.8.2. Company Snapshot
10.8.3. Company Market Share Analysis
10.8.4. Company Product Portfolio
10.8.5. Recent Developments
10.8.6. SWOT Analysis
10.9. AEROSUN-TOLA
10.9.1. Business Overview
10.9.2. Company Snapshot
10.9.3. Company Market Share Analysis
10.9.4. Company Product Portfolio
10.9.5. Recent Developments
10.9.6. SWOT Analysis
10.10. Witzenmann GmbH
10.10.1. Business Overview
10.10.2. Company Snapshot
10.10.3. Company Market Share Analysis
10.10.4. Company Product Portfolio
10.10.5. Recent Developments
10.10.6. SWOT Analysis
10.11. Macoga
10.11.1. Business Overview
10.11.2. Company Snapshot
10.11.3. Company Market Share Analysis
10.11.4. Company Product Portfolio
10.11.5. Recent Developments
10.11.6. SWOT Analysis
10.12. Gongyi Runda Pipeline
10.12.1. Business Overview
10.12.2. Company Snapshot
10.12.3. Company Market Share Analysis
10.12.4. Company Product Portfolio
10.12.5. Recent Developments
10.12.6. SWOT Analysis
10.13. U.S. Bellows
10.13.1. Business Overview
10.13.2. Company Snapshot
10.13.3. Company Market Share Analysis
10.13.4. Company Product Portfolio
10.13.5. Recent Developments
10.13.6. SWOT Analysis
10.14. FlexEJ
10.14.1. Business Overview
10.14.2. Company Snapshot
10.14.3. Company Market Share Analysis
10.14.4. Company Product Portfolio
10.14.5. Recent Developments
10.14.6. SWOT Analysis
10.15. Beijing Hangtian Taizhou Bellow
10.15.1. Business Overview
10.15.2. Company Snapshot
10.15.3. Company Market Share Analysis
10.15.4. Company Product Portfolio
10.15.5. Recent Developments
10.15.6. SWOT Analysis
10.16. Shandong Hnegtong Expansion Joint Manufacturing
10.16.1. Business Overview
10.16.2. Company Snapshot
10.16.3. Company Market Share Analysis
10.16.4. Company Product Portfolio
10.16.5. Recent Developments
10.16.6. SWOT Analysis
List of Table
1. Global Pipeline Expansion Joints Market, By Type, 2019-2032 (USD Billion)
2. Global Angular Expansion Joints, Pipeline Expansion Joints Market, By Region, 2019-2032 (USD Billion)
3. Global Axial Expansion Joints, Pipeline Expansion Joints Market, By Region, 2019-2032 (USD Billion)
4. Global Universal Expansion Joints, Pipeline Expansion Joints Market, By Region, 2019-2032 (USD Billion)
5. Global Lateral Expansion Joints, Pipeline Expansion Joints Market, By Region, 2019-2032 (USD Billion)
6. Global Pipeline Expansion Joints Market, By Application, 2019-2032 (USD Billion)
7. Global Power Generation Industry, Pipeline Expansion Joints Market, By Region, 2019-2032 (USD Billion)
8. Global Heavy Industry, Pipeline Expansion Joints Market, By Region, 2019-2032 (USD Billion)
9. Global Petrochemical Industry, Pipeline Expansion Joints Market, By Region, 2019-2032 (USD Billion)
10. Global Others, Pipeline Expansion Joints Market, By Region, 2019-2032 (USD Billion)
11. North America Pipeline Expansion Joints Market, By Type, 2019-2032 (USD Billion)
12. North America Pipeline Expansion Joints Market, By Application, 2019-2032 (USD Billion)
13. U.S. Pipeline Expansion Joints Market, By Type, 2019-2032 (USD Billion)
14. U.S. Pipeline Expansion Joints Market, By Application, 2019-2032 (USD Billion)
15. Canada Pipeline Expansion Joints Market, By Type, 2019-2032 (USD Billion)
16. Canada Pipeline Expansion Joints Market, By Application, 2019-2032 (USD Billion)
17. Mexico Pipeline Expansion Joints Market, By Type, 2019-2032 (USD Billion)
18. Mexico Pipeline Expansion Joints Market, By Application, 2019-2032 (USD Billion)
19. Europe Pipeline Expansion Joints Market, By Type, 2019-2032 (USD Billion)
20. Europe Pipeline Expansion Joints Market, By Application, 2019-2032 (USD Billion)
21. Germany Pipeline Expansion Joints Market, By Type, 2019-2032 (USD Billion)
22. Germany Pipeline Expansion Joints Market, By Application, 2019-2032 (USD Billion)
23. France Pipeline Expansion Joints Market, By Type, 2019-2032 (USD Billion)
24. France Pipeline Expansion Joints Market, By Application, 2019-2032 (USD Billion)
25. U.K. Pipeline Expansion Joints Market, By Type, 2019-2032 (USD Billion)
26. U.K. Pipeline Expansion Joints Market, By Application, 2019-2032 (USD Billion)
27. Italy Pipeline Expansion Joints Market, By Type, 2019-2032 (USD Billion)
28. Italy Pipeline Expansion Joints Market, By Application, 2019-2032 (USD Billion)
29. Spain Pipeline Expansion Joints Market, By Type, 2019-2032 (USD Billion)
30. Spain Pipeline Expansion Joints Market, By Application, 2019-2032 (USD Billion)
31. Asia Pacific Pipeline Expansion Joints Market, By Type, 2019-2032 (USD Billion)
32. Asia Pacific Pipeline Expansion Joints Market, By Application, 2019-2032 (USD Billion)
33. Japan Pipeline Expansion Joints Market, By Type, 2019-2032 (USD Billion)
34. Japan Pipeline Expansion Joints Market, By Application, 2019-2032 (USD Billion)
35. China Pipeline Expansion Joints Market, By Type, 2019-2032 (USD Billion)
36. China Pipeline Expansion Joints Market, By Application, 2019-2032 (USD Billion)
37. India Pipeline Expansion Joints Market, By Type, 2019-2032 (USD Billion)
38. India Pipeline Expansion Joints Market, By Application, 2019-2032 (USD Billion)
39. South America Pipeline Expansion Joints Market, By Type, 2019-2032 (USD Billion)
40. South America Pipeline Expansion Joints Market, By Application, 2019-2032 (USD Billion)
41. Brazil Pipeline Expansion Joints Market, By Type, 2019-2032 (USD Billion)
42. Brazil Pipeline Expansion Joints Market, By Application, 2019-2032 (USD Billion)
43. Middle East and Africa Pipeline Expansion Joints Market, By Type, 2019-2032 (USD Billion)
44. Middle East and Africa Pipeline Expansion Joints Market, By Application, 2019-2032 (USD Billion)
45. UAE Pipeline Expansion Joints Market, By Type, 2019-2032 (USD Billion)
46. UAE Pipeline Expansion Joints Market, By Application, 2019-2032 (USD Billion)
47. South Africa Pipeline Expansion Joints Market, By Type, 2019-2032 (USD Billion)
48. South Africa Pipeline Expansion Joints Market, By Application, 2019-2032 (USD Billion)
List of Figures
1. Global Pipeline Expansion Joints Market Segmentation
2. Global Pipeline Expansion Joints Market: Research Methodology
3. Market Size Estimation Methodology: Bottom-Up Approach
4. Market Size Estimation Methodology: Top-Down Approach
5. Data Triangulation
6. Porter’s Five Forces Analysis
7. Value Chain Analysis
8. Global Pipeline Expansion Joints Market Attractiveness Analysis by Type
9. Global Pipeline Expansion Joints Market Attractiveness Analysis by Application
10. Global Pipeline Expansion Joints Market Attractiveness Analysis by Region
11. Global Pipeline Expansion Joints Market: Dynamics
12. Global Pipeline Expansion Joints Market Share by Type (2023 & 2032)
13. Global Pipeline Expansion Joints Market Share by Application (2023 & 2032)
14. Global Pipeline Expansion Joints Market Share by Regions (2023 & 2032)
15. Global Pipeline Expansion Joints Market Share by Company (2022)
This study forecasts global, regional, and country revenue from 2019 to 2032. The Brainy Insights has segmented the global pipeline expansion joints market based on the below-mentioned segments:
Global Pipeline Expansion Joints Market By Type:
Global Pipeline Expansion Joints Market By Application:
Global Pipeline Expansion Joints Market By Region:
Research has its special purpose to undertake marketing efficiently. In this competitive scenario, businesses need information across all industry verticals; the information about customer wants, market demand, competition, industry trends, distribution channels etc. This information needs to be updated regularly because businesses operate in a dynamic environment. Our organization, The Brainy Insights incorporates scientific and systematic research procedures in order to get proper market insights and industry analysis for overall business success. The analysis consists of studying the market from a miniscule level wherein we implement statistical tools which helps us in examining the data with accuracy and precision.
Our research reports feature both; quantitative and qualitative aspects for any market. Qualitative information for any market research process are fundamental because they reveal the customer needs and wants, usage and consumption for any product/service related to a specific industry. This in turn aids the marketers/investors in knowing certain perceptions of the customers. Qualitative research can enlighten about the different product concepts and designs along with unique service offering that in turn, helps define marketing problems and generate opportunities. On the other hand, quantitative research engages with the data collection process through interviews, e-mail interactions, surveys and pilot studies. Quantitative aspects for the market research are useful to validate the hypotheses generated during qualitative research method, explore empirical patterns in the data with the help of statistical tools, and finally make the market estimations.
The Brainy Insights offers comprehensive research and analysis, based on a wide assortment of factual insights gained through interviews with CXOs and global experts and secondary data from reliable sources. Our analysts and industry specialist assume vital roles in building up statistical tools and analysis models, which are used to analyse the data and arrive at accurate insights with exceedingly informative research discoveries. The data provided by our organization have proven precious to a diverse range of companies, facilitating them to address issues such as determining which products/services are the most appealing, whether or not customers use the product in the manner anticipated, the purchasing intentions of the market and many others.
Our research methodology encompasses an idyllic combination of primary and secondary initiatives. Key phases involved in this process are listed below:

The phase involves the gathering and collecting of market data and its related information with the help of different sources & research procedures.

The data procurement stage involves in data gathering and collecting through various data sources.
This stage involves in extensive research. These data sources includes:
Purchased Database: Purchased databases play a crucial role in estimating the market sizes irrespective of the domain. Our purchased database includes:
Primary Research: The Brainy Insights interacts with leading companies and experts of the concerned domain to develop the analyst team’s market understanding and expertise. It improves and substantiates every single data presented in the market reports. Primary research mainly involves in telephonic interviews, E-mail interactions and face-to-face interviews with the raw material providers, manufacturers/producers, distributors, & independent consultants. The interviews that we conduct provides valuable data on market size and industry growth trends prevailing in the market. Our organization also conducts surveys with the various industry experts in order to gain overall insights of the industry/market. For instance, in healthcare industry we conduct surveys with the pharmacists, doctors, surgeons and nurses in order to gain insights and key information of a medical product/device/equipment which the customers are going to usage. Surveys are conducted in the form of questionnaire designed by our own analyst team. Surveys plays an important role in primary research because surveys helps us to identify the key target audiences of the market. Additionally, surveys helps to identify the key target audience engaged with the market. Our survey team conducts the survey by targeting the key audience, thus gaining insights from them. Based on the perspectives of the customers, this information is utilized to formulate market strategies. Moreover, market surveys helps us to understand the current competitive situation of the industry. To be precise, our survey process typically involve with the 360 analysis of the market. This analytical process begins by identifying the prospective customers for a product or service related to the market/industry to obtain data on how a product/service could fit into customers’ lives.

Secondary Research: The secondary data sources includes information published by the on-profit organizations such as World bank, WHO, company fillings, investor presentations, annual reports, national government documents, statistical databases, blogs, articles, white papers and others. From the annual report, we analyse a company’s revenue to understand the key segment and market share of that organization in a particular region. We analyse the company websites and adopt the product mapping technique which is important for deriving the segment revenue. In the product mapping method, we select and categorize the products offered by the companies catering to domain specific market, deduce the product revenue for each of the companies so as to get overall estimation of the market size. We also source data and analyses trends based on information received from supply side and demand side intermediaries in the value chain. The supply side denotes the data gathered from supplier, distributor, wholesaler and the demand side illustrates the data gathered from the end customers for respective market domain.

The supply side for a domain specific market is analysed by:
The demand side for the market is estimated through:
In-house Library: Apart from these third-party sources, we have our in-house library of qualitative and quantitative information. Our in-house database includes market data for various industry and domains. These data are updated on regular basis as per the changing market scenario. Our library includes, historic databases, internal audit reports and archives.
Sometimes there are instances where there is no metadata or raw data available for any domain specific market. For those cases, we use our expertise to forecast and estimate the market size in order to generate comprehensive data sets. Our analyst team adopt a robust research technique in order to produce the estimates:
Data Synthesis: This stage involves the analysis & mapping of all the information obtained from the previous step. It also involves in scrutinizing the data for any discrepancy observed while data gathering related to the market. The data is collected with consideration to the heterogeneity of sources. Robust scientific techniques are in place for synthesizing disparate data sets and provide the essential contextual information that can orient market strategies. The Brainy Insights has extensive experience in data synthesis where the data passes through various stages:


Market Deduction & Formulation: The final stage comprises of assigning data points at appropriate market spaces so as to deduce feasible conclusions. Analyst perspective & subject matter expert based holistic form of market sizing coupled with industry analysis also plays a crucial role in this stage.
This stage involves in finalization of the market size and numbers that we have collected from data integration step. With data interpolation, it is made sure that there is no gap in the market data. Successful trend analysis is done by our analysts using extrapolation techniques, which provide the best possible forecasts for the market.
Data Validation & Market Feedback: Validation is the most important step in the process. Validation & re-validation via an intricately designed process helps us finalize data-points to be used for final calculations.

The Brainy Insights interacts with leading companies and experts of the concerned domain to develop the analyst team’s market understanding and expertise. It improves and substantiates every single data presented in the market reports. The data validation interview and discussion panels are typically composed of the most experienced industry members. The participants include, however, are not limited to:
Moreover, we always validate our data and findings through primary respondents from all the major regions we are working on.


Free Customization
Fortune 500 Clients
Free Yearly Update On Purchase Of Multi/Corporate License
Companies Served Till Date