- +1-315-215-1633
- sales@thebrainyinsights.com

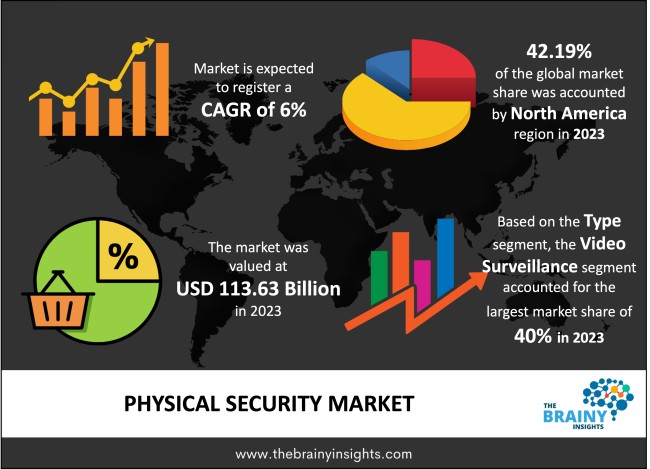
The global physical security market is expected to grow from USD 113.63 billion in 2023 to USD 203.49 billion by 2033, at a CAGR of 6% from 2024-2033. The Asia Pacific physical security market is expected to grow the fastest during the forecast period. The demand for physical security is increasing, especially for high-profile people, so physical security is very important. There is always a threat to the life of these high-profile people, and they keep getting threats of attacks. Due to this, the awareness of physical security is increasing and people are investing in it.
Security is the state of being protected from any danger or harm. Physical security defines the measures taken in the form of sensors, alarms or surveillance to safeguard personnel, software, hardware, data, and systems from physical threats. The physical threats can be fire, theft, floods, vandalism, or other natural and manmade threats. Such threats can cause severe damage and lead to capital or material losses. A list of a few measures is a guiding text to achieving robust physical security infrastructure. These measures include CCTV surveillance, protective barriers, access control, deterrent systems, sensors, alarms, security guards, locks, perimeter intrusion detection and other systems. These systems allow organizations or institutions to detect intrusions, monitor their activity and trigger appropriate responses to counter-attack intruders or deter them. Physical security is used by individuals, organizations, military establishments, prisons or important events. The rising instances of natural calamities like fires, floods and storms have increased the threat to personnel, software and hardware which has emphasized the need for physical security globally. The increasing instances of robberies and thefts at ATMs and banks have also increased the demand for physical security. Physical security is required in public institutions like schools, hospitals and government buildings to avoid chaos and maintain order. Furthermore, the increasing automation and digitization have led to the growing threat of cyberattacks, which are catastrophic in the absence of physical security measures. Similarly, the importance of physical security in every realm is being recognized, which will bode well for the market. Organizations use physical security in combination with cyber security. This makes it easier for security officers to monitor and do their work well. With the increasing infrastructure development, the need for physical security is huge. When this development happens and the public starts using that place, security is needed both times so that that place can be made safe, and no wrong activity can occur.
Get an overview of this study by requesting a free sample
November 2022 - Alcatraz AI has expanded its market by introducing its products in Europe and the Middle East. The demand for biometric access solutions has increased in the market, and groundwork for establishing extensive distribution channels to make their products accessible to consumers has gained momentum. That increases security while also simplifying the administrator and end-user experience rises. The Rock, Alcatraz's facial authentication solution, integrates easily into current access control systems, improving the security and ease of authentication at access points while addressing the enduring problems with access control without using up personnel or resources or impeding effective operations.
October 2022 – With the USD 21 million Series B fundraising round, SecuriThings has raised a total of USD 39 million for their business. SecuriThings is revolutionizing how companies manage and secure physical security devices at scale to ensure device functionality while cutting costs. With the help of its IoTOps platform, many enterprises may enhance system availability, organizational compliance, and cyber security. It also offers real-time visibility, protection, and predictive maintenance capabilities for IoT devices. IoTOps reduces the need for human labour and on-site visits while increasing process cost efficiency by using automation, analytics, and actionable alerts to free up teams' time for more strategic duties. To guarantee device functioning while reducing costs, SecuriThings is redefining how businesses manage and secure physical security devices at scale. Many businesses may improve system availability, organisational compliance, and cyber security with the aid of its IoTOps platform. Additionally, it provides IoT devices with real-time visibility, security, and preventative maintenance capabilities. By utilising automation, analytics, and actionable alerts to increase process cost efficiency while decreasing the need for human labour and on-site visits, IoTOps frees up teams' time to focus on more important tasks.
The growing terror attacks – An all-out war is not ideal for any party involved in the conflict. Therefore, most of the time, these candidates are engaged in proxy wars that are less costly with greater benefits. The increase in proxy wars leads to the emergence of several clandestine organizations or terror outfits. The rising global uncertainty, territorial conflicts, and nationalist and radical outfits have increased terror attacks. The lack of international cooperation is contributing to its growing rise worldwide. In some cases, these organizations have access to funds, technology, ammunition and state support, making them a lethal adversary. Therefore, governments of each country plagued with terror attacks are investing heavily in building a robust physical security infrastructure. The increasing fiscal investment will drive the global physical security market.
High cost of physical security - The broad scope of threats and their evolving nature require a similar scale physical security infrastructure. Such an extensive network, followed by its integration, installation and maintenance, can be costly. The high costs are not viable for many organizations or institutions. Therefore, the high cost of physical security will hamper the market's growth.
Integration of artificial intelligence – The paradigm shifts of security threats from physical thefts or attacks to digital modes, given the growing automation and digitization of economies, have called for an overhaul of the physical security measures. Furthermore, technological advancement enables better surveillance, monitoring and defensive systems/devices. Integrating artificial intelligence with existing physical security measures improves the safety and security of assets. They also reduce the costs in the long term and the personnel required to operate or monitor them. For instance, the innovations of IoTs in surveillance cameras, access control systems and other security devices enable better and wider control over security. Therefore, as the threats evolve, the need for advanced security measures will follow, offering the market players lucrative opportunities in the future.
Privacy concerns – The first and foremost need for physical security is to protect something vital or sensitive. The asset, personnel, data, system or infrastructure that needs to be protected is not exposed to the public given the obvious reasons. In some cases, it is not possible or viable for the institution to have in-house physical security, given its size or capital concerns. They have to outsource their security from a professional third-party service provider. The confidential and sensitive form of such institutions increases the risk of a security breach when a third party for their security is involved. The likelihood of privacy invasion is high despite the multiple measures in place. Therefore, privacy concerns will limit the growth of the market.
The regions analyzed for the market include North America, Europe, South America, Asia Pacific, the Middle East, and Africa. The North American region emerged as the most significant global physical security market, with a 42.19% market revenue share in 2023. The developed economies of the region have access to advanced security infrastructure to protect critical national assets. The use of physical security measures by private players including individuals is a growing trend in the region. Residential houses, apartment complexes, supermarkets, and other service institutes deploy physical security measures to make residents and customers feel safe. The presence of several security service providers and an extensive, accessible and affordable market of new security gadgets propel the market's growth. The rising threat of cyber-attacks from adversaries on critical public infrastructure like power grids and defence establishments has shored up the funding for ramping up physical security measures. The increased private and public financing will bode well for the market. The Asia Pacific market is expected to grow the fastest during the forecast period. The increasing instances of theft in residential areas, banks, ATMs and other high-end non-commercial spaces have intensified the demand for physical security measures. The rising threat of terrorist attacks or other state-backed non-state actors attacking the countries' personnel, hardware, software, data and systems has led to an expanding physical security market. Several breaches in the security infrastructure have led to an overhaul in security measures, resulting in technological advancement and product innovations. The large consumer market of India and China, with rising disposable income, are willing to spend on physical security measures for safety, driving the growth of the market.
North America Physical Security Market Share in 2023 - 42.19%
www.thebrainyinsights.com
Check the geographical analysis of this market by requesting a free sample
The type segment is divided into video surveillance, perimeter intrusion & detection, security systems integration, access & entrance control, remote monitoring, safe security system, fire & light safety, and others. The video surveillance segment dominated the market with a revenue share of around 40% in 2023. The primary driver for the segment's dominance is that most governments mandate installing and maintaining these systems in residential areas, hospitals, homes, roads, schools, and commercial areas like malls and shopping centres. For instance, they are used to control road traffic violations. They are also helpful to law and enforcement agencies for surveillance and monitoring. The increasing demand for video surveillance systems from individuals to protect their homes is attributed to the decreasing costs of the installation/set-up, and maintenance of these systems. Video surveillance offers a live feed of areas and records these recordings, offering peace of mind to the owners of these systems. The systems are easy to install, operate and control ensuring their continuing dominance in the segment.
The industry type is divided into retail, residential, BFSI, transportation, it & telecom, government, commercial, industrial, energy & utilities, hospitality, and others. The government segment dominated the market with a market share of around 36% in 2023. The global uncertainties, rising territorial conflicts and other face-offs have recently translated into cyber-warfare. Attacks on the crucial infrastructure of enemy entities as become a new war strategy of global players. The alleged Chinese attacks on US entities, India's transport network and the electric grid, are a few examples. The physical missile attacks of Russia on Ukrainian energy infrastructure resulting in loss of power across 40% of the country, has persuaded governments worldwide to shore up their security investments. The looming threat of terror attacks, internal insurgencies and other conflicts has led to the rising government presence in the physical security market.
The component is divided into systems and services. The systems segment dominated the market with a market share of around 59% in 2023. The systems include CCTV or video surveillance, access control systems, physical identity management, fire safety, physical security information management, and remote monitoring systems. Both commercial and non-commercial entities utilize systems as they offer a wide of products suited according to each one's requirements. Technological advancements enhance production features while driving down costs, which will bode well for the segment.
The organization size is divided into large enterprises and small & medium enterprises. The large enterprises' segment dominated the market with a market share of around 55% in 2023. Large enterprises are targeted more than SMEs, given their market share and revenue. The impact on one large entity disrupts the whole market with a domino effect and could be catastrophic for the nation. The extensive network of these entities increases the risk and threat to their devices, systems, data and personnel. Therefore, they deploy advanced security measures to avoid any breach or attack. The vast capital with them enables them to undertake such security measures.
| Attribute | Description |
|---|---|
| Market Size | Revenue (USD Billion) |
| Market size value in 2023 | USD 113.63 Billion |
| Market size value in 2033 | USD 203.49 Billion |
| CAGR (2024 to 2033) | 6% |
| Historical data | 2020-2022 |
| Base Year | 2023 |
| Forecast | 2024-2033 |
| Region | The regions examined for the market are Europe, Asia Pacific, North America, South America, and Middle East & Africa. |
| Segments | The research segment is based on type, industry vertical, component and organization size. |
As per The Brainy Insights, the size of the physical security market was valued at USD 113.63 billion in 2023 to USD 203.49 billion by 2033.
The global physical security market is growing at a CAGR of 6% during the forecast period 2024-2033.
The North American region emerged as the largest market for the physical security.
The Increasing thefts will influence the market's growth.
1. Introduction
1.1. Objectives of the Study
1.2. Market Definition
1.3. Research Scope
1.4. Currency
1.5. Key Target Audience
2. Research Methodology and Assumptions
3. Executive Summary
4. Premium Insights
4.1. Porter’s Five Forces Analysis
4.2. Value Chain Analysis
4.3. Top Investment Pockets
4.3.1. Market Attractiveness Analysis by Type
4.3.2. Market Attractiveness Analysis by Industry Vertical
4.3.3. Market Attractiveness Analysis by Component
4.3.4. Market Attractiveness Analysis by Organization Size
4.3.5. Market Attractiveness Analysis by Region
4.4. Industry Trends
5. Market Dynamics
5.1. Market Evaluation
5.2. Drivers
5.2.1. Increasing thefts
5.3. Restraints
5.3.1. Integration is difficult
5.4. Opportunities
5.4.1. Technological advancements and product innovations
5.5. Challenges
5.5.1. The debate over threat to privacy from physical security measures
6. Global Physical Security Market Analysis and Forecast, By Type
6.1. Segment Overview
6.2. Video Surveillance
6.3. Perimeter Intrusion & Detection
6.4. Security Systems Integration
6.5. Access & Entrance Control
6.6. Remote Monitoring
6.7. Safe Security System
6.8. Fire & Light Safety
6.9. Others
7. Global Physical Security Market Analysis and Forecast, By Industry Vertical
7.1. Segment Overview
7.2. Retail
7.3. Residential
7.4. BFSI
7.5. Transportation
7.6. IT & Telecom
7.7. Government
7.8. Commercial
7.9. Industrial
7.10. Energy & Utilities
7.11. Hospitality
7.12. Others
8. Global Physical Security Market Analysis and Forecast, By Component
8.1. Segment Overview
8.2. Systems
8.3. Services
9. Global Physical Security Market Analysis and Forecast, By Organization Size
9.1. Segment Overview
9.2. Large Enterprises
9.3. Small & Medium Enterprises
10. Global Physical Security Market Analysis and Forecast, By Regional Analysis
10.1. Segment Overview
10.2. North America
10.2.1. U.S.
10.2.2. Canada
10.2.3. Mexico
10.3. Europe
10.3.1. Germany
10.3.2. France
10.3.3. U.K.
10.3.4. Italy
10.3.5. Spain
10.4. Asia-Pacific
10.4.1. Japan
10.4.2. China
10.4.3. India
10.5. South America
10.5.1. Brazil
10.6. Middle East and Africa
10.6.1. UAE
10.6.2. South Africa
11. Global Physical Security Market-Competitive Landscape
11.1. Overview
11.2. Market Share of Key Players in the Physical Security Market
11.2.1. Global Company Market Share
11.2.2. North America Company Market Share
11.2.3. Europe Company Market Share
11.2.4. APAC Company Market Share
11.3. Competitive Situations and Trends
11.3.1. Product Launches and Developments
11.3.2. Partnerships, Collaborations, and Agreements
11.3.3. Mergers & Acquisitions
11.3.4. Expansions
12. Company Profiles
12.1. ADT Corporation
12.1.1. Business Overview
12.1.2. Company Snapshot
12.1.3. Company Market Share Analysis
12.1.4. Company Product Portfolio
12.1.5. Recent Developments
12.1.6. SWOT Analysis
12.2. BAE Systems Plc
12.2.1. Business Overview
12.2.2. Company Snapshot
12.2.3. Company Market Share Analysis
12.2.4. Company Product Portfolio
12.2.5. Recent Developments
12.2.6. SWOT Analysis
12.3. Cisco System Inc.
12.3.1. Business Overview
12.3.2. Company Snapshot
12.3.3. Company Market Share Analysis
12.3.4. Company Product Portfolio
12.3.5. Recent Developments
12.3.6. SWOT Analysis
12.4. Genetec Inc.
12.4.1. Business Overview
12.4.2. Company Snapshot
12.4.3. Company Market Share Analysis
12.4.4. Company Product Portfolio
12.4.5. Recent Developments
12.4.6. SWOT Analysis
12.5. Honeywell International Inc.
12.5.1. Business Overview
12.5.2. Company Snapshot
12.5.3. Company Market Share Analysis
12.5.4. Company Product Portfolio
12.5.5. Recent Developments
12.5.6. SWOT Analysis
12.6. Johnson Controls
12.6.1. Business Overview
12.6.2. Company Snapshot
12.6.3. Company Market Share Analysis
12.6.4. Company Product Portfolio
12.6.5. Recent Developments
12.6.6. SWOT Analysis
12.7. PELCO Corporation
12.7.1. Business Overview
12.7.2. Company Snapshot
12.7.3. Company Market Share Analysis
12.7.4. Company Product Portfolio
12.7.5. Recent Developments
12.7.6. SWOT Analysis
12.8. Robert Bosch GmbH
12.8.1. Business Overview
12.8.2. Company Snapshot
12.8.3. Company Market Share Analysis
12.8.4. Company Product Portfolio
12.8.5. Recent Developments
12.8.6. SWOT Analysis
12.9. Hangzhou Hikvision Digital Technology Co. Ltd.
12.9.1. Business Overview
12.9.2. Company Snapshot
12.9.3. Company Market Share Analysis
12.9.4. Company Product Portfolio
12.9.5. Recent Developments
12.9.6. SWOT Analysis
12.10. Stanley Government Security Solutions Inc.
12.10.1. Business Overview
12.10.2. Company Snapshot
12.10.3. Company Market Share Analysis
12.10.4. Company Product Portfolio
12.10.5. Recent Developments
12.10.6. SWOT Analysis
List of Table
1. Global Physical Security Market, By Type, 2020-2033 (USD Billion)
2. Global Video Surveillance Physical Security Market, By Region, 2020-2033 (USD Billion)
3. Global Perimeter Intrusion & Detection Physical Security Market, By Region, 2020-2033 (USD Billion)
4. Global Security Systems Integration Physical Security Market, By Region, 2020-2033 (USD Billion)
5. Global Access & Entrance Control Physical Security Market, By Region, 2020-2033 (USD Billion)
6. Global Remote Monitoring Physical Security Market, By Region, 2020-2033 (USD Billion)
7. Global Safe Security System Physical Security Market, By Region, 2020-2033 (USD Billion)
8. Global Fire & Light Safety Physical Security Market, By Region, 2020-2033 (USD Billion)
9. Global Others Physical Security Market, By Region, 2020-2033 (USD Billion)
10. Global Physical Security Market, By Industry Vertical, 2020-2033 (USD Billion)
11. Global Retail Physical Security Market, By Region, 2020-2033 (USD Billion)
12. Global Residential Physical Security Market, By Region, 2020-2033 (USD Billion)
13. Global BFSI Physical Security Market, By Region, 2020-2033 (USD Billion)
14. Global Transportation Physical Security Market, By Region, 2020-2033 (USD Billion)
15. Global IT & Telecom Physical Security Market, By Region, 2020-2033 (USD Billion)
16. Global Government Physical Security Market, By Region, 2020-2033 (USD Billion)
17. Global Commercial Physical Security Market, By Region, 2020-2033 (USD Billion)
18. Global Industrial Physical Security Market, By Region, 2020-2033 (USD Billion)
19. Global Energy & Utilities Physical Security Market, By Region, 2020-2033 (USD Billion)
20. Global Hospitality Physical Security Market, By Region, 2020-2033 (USD Billion)
21. Global Others Physical Security Market, By Region, 2020-2033 (USD Billion)
22. Global Physical Security Market, By Component, 2020-2033 (USD Billion)
23. Global Systems Physical Security Market, By Region, 2020-2033 (USD Billion)
24. Global Services Physical Security Market, By Region, 2020-2033 (USD Billion)
25. Global Physical Security Market, By Organization Size, 2020-2033 (USD Billion)
26. Global Large Enterprises Physical Security Market, By Region, 2020-2033 (USD Billion)
27. Global Small & Medium Enterprises Physical Security Market, By Region, 2020-2033 (USD Billion)
28. Global Physical Security Market, By Region, 2020-2033 (USD Billion)
29. North America Physical Security Market, By Type, 2020-2033 (USD Billion)
30. North America Physical Security Market, By Industry Vertical, 2020-2033 (USD Billion)
31. North America Physical Security Market, By Component, 2020-2033 (USD Billion)
32. North America Physical Security Market, By Organization Size, 2020-2033 (USD Billion)
33. U.S. Physical Security Market, By Type, 2020-2033 (USD Billion)
34. U.S. Physical Security Market, By Industry Vertical, 2020-2033 (USD Billion)
35. U.S. Physical Security Market, By Component, 2020-2033 (USD Billion)
36. U.S. Physical Security Market, By Organization Size, 2020-2033 (USD Billion)
37. Canada Physical Security Market, By Type, 2020-2033 (USD Billion)
38. Canada Physical Security Market, By Industry Vertical, 2020-2033 (USD Billion)
39. Canada Physical Security Market, By Component, 2020-2033 (USD Billion)
40. Canada Physical Security Market, By Organization Size, 2020-2033 (USD Billion)
41. Mexico Physical Security Market, By Type, 2020-2033 (USD Billion)
42. Mexico Physical Security Market, By Industry Vertical, 2020-2033 (USD Billion)
43. Mexico Physical Security Market, By Component, 2020-2033 (USD Billion)
44. Mexico Physical Security Market, By Organization Size, 2020-2033 (USD Billion)
45. Europe Physical Security Market, By Type, 2020-2033 (USD Billion)
46. Europe Physical Security Market, By Industry Vertical, 2020-2033 (USD Billion)
47. Europe Physical Security Market, By Component, 2020-2033 (USD Billion)
48. Europe Physical Security Market, By Organization Size, 2020-2033 (USD Billion)
49. Germany Physical Security Market, By Type, 2020-2033 (USD Billion)
50. Germany Physical Security Market, By Industry Vertical, 2020-2033 (USD Billion)
51. Germany Physical Security Market, By Component, 2020-2033 (USD Billion)
52. Germany Physical Security Market, By Organization Size, 2020-2033 (USD Billion)
53. France Physical Security Market, By Type, 2020-2033 (USD Billion)
54. France Physical Security Market, By Industry Vertical, 2020-2033 (USD Billion)
55. France Physical Security Market, By Component, 2020-2033 (USD Billion)
56. France Physical Security Market, By Organization Size, 2020-2033 (USD Billion)
57. U.K. Physical Security Market, By Type, 2020-2033 (USD Billion)
58. U.K. Physical Security Market, By Industry Vertical, 2020-2033 (USD Billion)
59. U.K. Physical Security Market, By Component, 2020-2033 (USD Billion)
60. U.K. Physical Security Market, By Organization Size, 2020-2033 (USD Billion)
61. Italy Physical Security Market, By Type, 2020-2033 (USD Billion)
62. Italy Physical Security Market, By Industry Vertical, 2020-2033 (USD Billion)
63. Italy Physical Security Market, By Component, 2020-2033 (USD Billion)
64. Italy Physical Security Market, By Organization Size, 2020-2033 (USD Billion)
65. Spain Physical Security Market, By Type, 2020-2033 (USD Billion)
66. Spain Physical Security Market, By Industry Vertical, 2020-2033 (USD Billion)
67. Spain Physical Security Market, By Component, 2020-2033 (USD Billion)
68. Spain Physical Security Market, By Organization Size, 2020-2033 (USD Billion)
69. Asia Pacific Physical Security Market, By Type, 2020-2033 (USD Billion)
70. Asia Pacific Physical Security Market, By Industry Vertical, 2020-2033 (USD Billion)
71. Asia Pacific Physical Security Market, By Component, 2020-2033 (USD Billion)
72. Asia Pacific Physical Security Market, By Organization Size, 2020-2033 (USD Billion)
73. Japan Physical Security Market, By Type, 2020-2033 (USD Billion)
74. Japan Physical Security Market, By Industry Vertical, 2020-2033 (USD Billion)
75. Japan Physical Security Market, By Component, 2020-2033 (USD Billion)
76. Japan Physical Security Market, By Organization Size, 2020-2033 (USD Billion)
77. China Physical Security Market, By Type, 2020-2033 (USD Billion)
78. China Physical Security Market, By Industry Vertical, 2020-2033 (USD Billion)
79. China Physical Security Market, By Component, 2020-2033 (USD Billion)
80. China Physical Security Market, By Organization Size, 2020-2033 (USD Billion)
81. India Physical Security Market, By Type, 2020-2033 (USD Billion)
82. India Physical Security Market, By Industry Vertical, 2020-2033 (USD Billion)
83. India Physical Security Market, By Component, 2020-2033 (USD Billion)
84. India Physical Security Market, By Organization Size, 2020-2033 (USD Billion)
85. South America Physical Security Market, By Type, 2020-2033 (USD Billion)
86. South America Physical Security Market, By Industry Vertical, 2020-2033 (USD Billion)
87. South America Physical Security Market, By Component, 2020-2033 (USD Billion)
88. South America Physical Security Market, By Organization Size, 2020-2033 (USD Billion)
89. Brazil Physical Security Market, By Type, 2020-2033 (USD Billion)
90. Brazil Physical Security Market, By Industry Vertical, 2020-2033 (USD Billion)
91. Brazil Physical Security Market, By Component, 2020-2033 (USD Billion)
92. Brazil Physical Security Market, By Organization Size, 2020-2033 (USD Billion)
93. Middle East and Africa Physical Security Market, By Type, 2020-2033 (USD Billion)
94. Middle East and Africa Physical Security Market, By Industry Vertical, 2020-2033 (USD Billion)
95. Middle East and Africa Physical Security Market, By Component, 2020-2033 (USD Billion)
96. Middle East and Africa Physical Security Market, By Organization Size, 2020-2033 (USD Billion)
97. UAE Physical Security Market, By Type, 2020-2033 (USD Billion)
98. UAE Physical Security Market, By Industry Vertical, 2020-2033 (USD Billion)
99. UAE Physical Security Market, By Component, 2020-2033 (USD Billion)
100. UAE Physical Security Market, By Organization Size, 2020-2033 (USD Billion)
101. South Africa Physical Security Market, By Type, 2020-2033 (USD Billion)
102. South Africa Physical Security Market, By Industry Vertical, 2020-2033 (USD Billion)
103. South Africa Physical Security Market, By Component, 2020-2033 (USD Billion)
104. South Africa Physical Security Market, By Organization Size, 2020-2033 (USD Billion)
List of Figures
1. Global Physical Security Market Segmentation
2. Physical Security Market: Research Methodology
3. Market Size Estimation Methodology: Bottom-Up Approach
4. Market Size Estimation Methodology: Top-Down Approach
5. Data Triangulation
6. Porter’s Five Forces Analysis
7. Value Chain Analysis
8. Global Physical Security Market Attractiveness Analysis by Type
9. Global Physical Security Market Attractiveness Analysis by Industry Vertical
10. Global Physical Security Market Attractiveness Analysis by Component
11. Global Physical Security Market Attractiveness Analysis by Organization Size
12. Global Physical Security Market Attractiveness Analysis by Region
13. Global Physical Security Market: Dynamics
14. Global Physical Security Market Share by Type (2023 & 2033)
15. Global Physical Security Market Share by Industry Vertical (2023 & 2033)
16. Global Physical Security Market Share by Component (2023 & 2033)
17. Global Physical Security Market Share by Organization Size (2023 & 2033)
18. Global Physical Security Market Share by Regions (2023 & 2033)
19. Global Physical Security Market Share by Company (2023)
This study forecasts revenue at global, regional, and country levels from 2020 to 2033. The Brainy Insights has segmented the global physical security market based on below-mentioned segments:
Global Physical Security Market by Type:
Global Physical Security Market by Industry Vertical:
Global Physical Security Market by Component:
Global Physical Security Market by Organization Size:
Global Physical Security Market by Region:
Research has its special purpose to undertake marketing efficiently. In this competitive scenario, businesses need information across all industry verticals; the information about customer wants, market demand, competition, industry trends, distribution channels etc. This information needs to be updated regularly because businesses operate in a dynamic environment. Our organization, The Brainy Insights incorporates scientific and systematic research procedures in order to get proper market insights and industry analysis for overall business success. The analysis consists of studying the market from a miniscule level wherein we implement statistical tools which helps us in examining the data with accuracy and precision.
Our research reports feature both; quantitative and qualitative aspects for any market. Qualitative information for any market research process are fundamental because they reveal the customer needs and wants, usage and consumption for any product/service related to a specific industry. This in turn aids the marketers/investors in knowing certain perceptions of the customers. Qualitative research can enlighten about the different product concepts and designs along with unique service offering that in turn, helps define marketing problems and generate opportunities. On the other hand, quantitative research engages with the data collection process through interviews, e-mail interactions, surveys and pilot studies. Quantitative aspects for the market research are useful to validate the hypotheses generated during qualitative research method, explore empirical patterns in the data with the help of statistical tools, and finally make the market estimations.
The Brainy Insights offers comprehensive research and analysis, based on a wide assortment of factual insights gained through interviews with CXOs and global experts and secondary data from reliable sources. Our analysts and industry specialist assume vital roles in building up statistical tools and analysis models, which are used to analyse the data and arrive at accurate insights with exceedingly informative research discoveries. The data provided by our organization have proven precious to a diverse range of companies, facilitating them to address issues such as determining which products/services are the most appealing, whether or not customers use the product in the manner anticipated, the purchasing intentions of the market and many others.
Our research methodology encompasses an idyllic combination of primary and secondary initiatives. Key phases involved in this process are listed below:

The phase involves the gathering and collecting of market data and its related information with the help of different sources & research procedures.

The data procurement stage involves in data gathering and collecting through various data sources.
This stage involves in extensive research. These data sources includes:
Purchased Database: Purchased databases play a crucial role in estimating the market sizes irrespective of the domain. Our purchased database includes:
Primary Research: The Brainy Insights interacts with leading companies and experts of the concerned domain to develop the analyst team’s market understanding and expertise. It improves and substantiates every single data presented in the market reports. Primary research mainly involves in telephonic interviews, E-mail interactions and face-to-face interviews with the raw material providers, manufacturers/producers, distributors, & independent consultants. The interviews that we conduct provides valuable data on market size and industry growth trends prevailing in the market. Our organization also conducts surveys with the various industry experts in order to gain overall insights of the industry/market. For instance, in healthcare industry we conduct surveys with the pharmacists, doctors, surgeons and nurses in order to gain insights and key information of a medical product/device/equipment which the customers are going to usage. Surveys are conducted in the form of questionnaire designed by our own analyst team. Surveys plays an important role in primary research because surveys helps us to identify the key target audiences of the market. Additionally, surveys helps to identify the key target audience engaged with the market. Our survey team conducts the survey by targeting the key audience, thus gaining insights from them. Based on the perspectives of the customers, this information is utilized to formulate market strategies. Moreover, market surveys helps us to understand the current competitive situation of the industry. To be precise, our survey process typically involve with the 360 analysis of the market. This analytical process begins by identifying the prospective customers for a product or service related to the market/industry to obtain data on how a product/service could fit into customers’ lives.

Secondary Research: The secondary data sources includes information published by the on-profit organizations such as World bank, WHO, company fillings, investor presentations, annual reports, national government documents, statistical databases, blogs, articles, white papers and others. From the annual report, we analyse a company’s revenue to understand the key segment and market share of that organization in a particular region. We analyse the company websites and adopt the product mapping technique which is important for deriving the segment revenue. In the product mapping method, we select and categorize the products offered by the companies catering to domain specific market, deduce the product revenue for each of the companies so as to get overall estimation of the market size. We also source data and analyses trends based on information received from supply side and demand side intermediaries in the value chain. The supply side denotes the data gathered from supplier, distributor, wholesaler and the demand side illustrates the data gathered from the end customers for respective market domain.

The supply side for a domain specific market is analysed by:
The demand side for the market is estimated through:
In-house Library: Apart from these third-party sources, we have our in-house library of qualitative and quantitative information. Our in-house database includes market data for various industry and domains. These data are updated on regular basis as per the changing market scenario. Our library includes, historic databases, internal audit reports and archives.
Sometimes there are instances where there is no metadata or raw data available for any domain specific market. For those cases, we use our expertise to forecast and estimate the market size in order to generate comprehensive data sets. Our analyst team adopt a robust research technique in order to produce the estimates:
Data Synthesis: This stage involves the analysis & mapping of all the information obtained from the previous step. It also involves in scrutinizing the data for any discrepancy observed while data gathering related to the market. The data is collected with consideration to the heterogeneity of sources. Robust scientific techniques are in place for synthesizing disparate data sets and provide the essential contextual information that can orient market strategies. The Brainy Insights has extensive experience in data synthesis where the data passes through various stages:


Market Deduction & Formulation: The final stage comprises of assigning data points at appropriate market spaces so as to deduce feasible conclusions. Analyst perspective & subject matter expert based holistic form of market sizing coupled with industry analysis also plays a crucial role in this stage.
This stage involves in finalization of the market size and numbers that we have collected from data integration step. With data interpolation, it is made sure that there is no gap in the market data. Successful trend analysis is done by our analysts using extrapolation techniques, which provide the best possible forecasts for the market.
Data Validation & Market Feedback: Validation is the most important step in the process. Validation & re-validation via an intricately designed process helps us finalize data-points to be used for final calculations.

The Brainy Insights interacts with leading companies and experts of the concerned domain to develop the analyst team’s market understanding and expertise. It improves and substantiates every single data presented in the market reports. The data validation interview and discussion panels are typically composed of the most experienced industry members. The participants include, however, are not limited to:
Moreover, we always validate our data and findings through primary respondents from all the major regions we are working on.


Free Customization
Fortune 500 Clients
Free Yearly Update On Purchase Of Multi/Corporate License
Companies Served Till Date