- +1-315-215-1633
- sales@thebrainyinsights.com

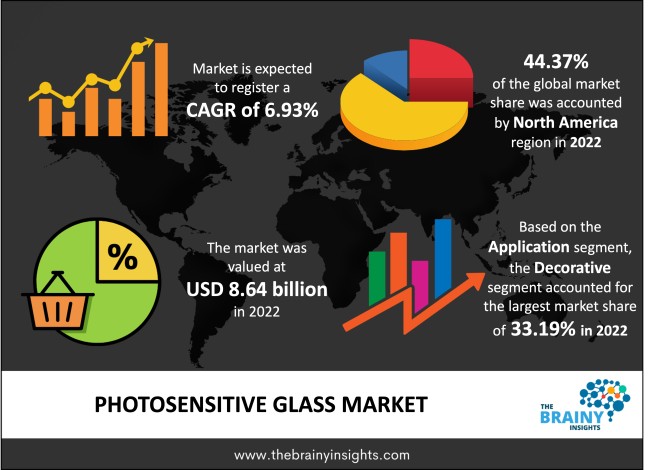
The global photosensitive glass market generated USD 8.64 billion revenue in 2022 and is projected to grow at a CAGR of 6.93% from 2023 to 2032. Due to its distinctive visual appeal, the construction industry increasingly recognizes photosensitive glass's potential as a valuable material. This type of glass finds applications in ornamental tiles, enhancing the aesthetic appeal of walls and partitions and creating expansive windowpanes for architectural purposes. This growing adoption within the construction sector is a significant driver of market expansion. Additionally, the expanding utilization of photosensitive glass for fabricating microcircuits in the electronic industry further propels market growth. This innovative use of photosensitive glass in electronic applications contributes to market advancement.
Photosensitive glass, often called photosensitive or photosensitive dichroic glass, is a unique type that can change its appearance and optical properties when exposed to various forms of light or radiation. This glass is engineered with special compounds, such as silver halides or other photosensitive materials, which distinctly react to light. When photosensitive glass is subjected to ultraviolet (UV) or other specific wavelengths of light, it undergoes a chemical reaction that alters its colour, transparency, or opacity. This transformation creates intricate and dynamic visual effects within the glass itself. As a result, photosensitive glass is highly valued in artistic, architectural, and decorative applications. In the artistic realm, this glass is utilized by glass artists and artisans to craft captivating and ever-changing art pieces. When illuminated with different lighting conditions, these artworks exhibit a range of colours and patterns, adding a captivating and interactive element to the art form. Within architecture and design, photosensitive glass is employed for various purposes. It is often used in decorative tiles, wall panels, and partitions to imbue spaces with an adaptable and aesthetic quality. Large architectural windowpanes offer the capability to adjust the level of privacy and light transmission based on external lighting conditions, providing both functionality and visual intrigue. Furthermore, photosensitive glass has found a niche in the electronics industry. It produces microcircuits and electronic components by leveraging its light-sensitive properties for precise and controlled etching and patterning processes.
Get an overview of this study by requesting a free sample
Growing Demand for Photonic Devices - The growing need for photonic devices such as modulators, optical switches, and sensors has boosted the photosensitive glass market. These devices rely on photosensitive glass for their optical components, driving the market's growth.
Telecommunications Expansion - The expansion of the telecommunications industry has increased the demand for photosensitive glass. This glass is essential for producing fiber optic components and ensuring efficient data transmission.
Rising Interest in Holography - Holography has gained popularity in various applications, from entertainment and art to security and data storage. Photosensitive glass is crucial in holographic imaging, contributing to the market's growth.
High Production Costs - One of the primary restraints of the photosensitive glass market is the relatively high production costs associated with manufacturing photosensitive glass. The specialized materials and processes required can make these products expensive, limiting their adoption in cost-sensitive industries.
Limited Awareness and Education - Many potential end-users and industries may need to be fully aware of the benefits and applications of photosensitive glass. The lack of awareness can hamper the market's growth, as potential buyers may need to recognize the benefits of using photosensitive glass in their applications.
Growth in Optical Communications - The ongoing expansion of optical communication networks, including 5G and data center infrastructure, presents a significant opportunity for photosensitive glass. This glass is crucial for manufacturing high-performance optical components in data transmission and telecommunications.
Emerging Technologies - Rapid technological advancements such as augmented reality (AR), virtual reality (VR), and autonomous vehicles require advanced optical components. Photosensitive glass can find applications in these industries, driving market growth.
Competition from Alternative Materials - Traditional optical materials, such as standard glasses and polymers, compete with photosensitive glass. These materials may provide similar optical properties at a lower cost, making it challenging for photosensitive glass to gain market share.
Limited Customization - Photosensitive glass can be customized to some extent. It may not offer the same degree of flexibility as other optical materials. This limitation can be a challenge for industries requiring highly specialized optical properties.
The regions analyzed for the market include North America, Europe, South America, Asia Pacific, the Middle East, and Africa. The North American region emerged as the most prominent global photosensitive glass market, with a 44.37% market revenue share in 2022.
North America boasts a well-developed infrastructure and a long history of technological innovation. This region has invested heavily in research and development, enabling the development and production of advanced photosensitive glass products. The region has a robust industrial base, including the electronics, telecommunications, aerospace, and healthcare sectors. These industries have a significant demand for photosensitive glass for applications such as optical communications, aerospace optics, and medical imaging. Additionally, the presence of world-renowned research institutions, universities, and technology companies in North America has led to substantial investments in research and development. This factor has resulted in the continuous improvement of photosensitive glass technology and the creation of new applications. Besides, North America has a thriving innovation ecosystem that encourages collaboration between academia and industry. This collaborative environment fosters the development of cutting-edge technologies and facilitates the commercialization of photosensitive glass products. The Europe region is projected to see modest growth during the forecast years. Many European countries have adopted photosensitive glass in various industries, including telecommunications, healthcare, and aerospace. As a result, the market in these regions may reach a saturation point, leading to slower growth. The region has faced economic challenges in recent years, including the financial crisis and, more recently, the economic impact of the COVID-19 pandemic. These challenges can lead to reduced investments in research and development, affecting market growth.
North America Region Photosensitive Glass Market Share in 2022 - 44.37%
www.thebrainyinsights.com
Check the geographical analysis of this market by requesting a free sample
The type segment includes transparent glass and opacified glass. The transparent glass segment dominated the market, with a share of 72.85% in 2022. Transparent photosensitive glass has excellent optical properties, including high transparency, low dispersion, and minimal optical distortion. These qualities make it ideal for precision optics, lenses, and optical fibers. In addition, transparent photosensitive glass offers various applications across various industries. Its versatility allows it to be used in optical components for telecommunications, medical devices, automotive displays, and many other applications, making it a preferred choice for a broad customer base. Furthermore, the telecommunications industry relies heavily on transparent photosensitive glass for manufacturing optical fibers, switches, and other components. The growth of data traffic and the deployment of high-speed networks drive demand for transparent glass.
The application segment is classified into construction, ornaments, decorative, electronic, automotive and others. The decorative segment dominated the market, with a share of around 33.19% in 2022. Decorative photosensitive glass offers a unique and aesthetically pleasing appearance. It can enhance the visual appeal of buildings, homes, and interior spaces, contributing to its popularity in the architectural and interior design sectors. Decorative photosensitive glass is commonly used in homes for shower enclosures, room dividers, and decorative windows. The growing need for interior design and home improvement projects drives the residential market. Additionally, decorative photosensitive glass can be customized to create various patterns, textures, and designs. This level of customization allows it to cater to diverse design preferences and project requirements.
The sales channel segment is split into online and offline. The offline segment dominated the market, with a share of around 71.59% in 2022. Offline distribution channels, including brick-and-mortar stores, have existed for a long time. These channels have well-established networks, relationships with manufacturers, and a history of serving customers in the glass industry. Offline channels also offer a personalized customer experience, where customers can interact with sales representatives, see physical samples, and receive expert guidance. This personalized approach is valued, especially in industries where technical knowledge is essential. Photosensitive glass is a specialized product; customers often require in-depth information and technical support. Offline channels provide a platform for manufacturers and distributors to educate customers about the product's features, benefits, and applications. Additionally, offline channels can provide customers with a direct view of the product's quality through physical inspections. Quality assurance is particularly important in industries where precision and reliability are critical, such as optics and photonics.
| Attribute | Description |
|---|---|
| Market Size | Revenue (USD Billion) |
| Market size value in 2022 | USD 8.64 Billion |
| Market size value in 2032 | USD 16.89 Billion |
| CAGR (2023 to 2032) | 6.93% |
| Historical data | 2019-2021 |
| Base Year | 2022 |
| Forecast | 2023-2032 |
| Region | The regions analyzed for the market are Asia Pacific, Europe, South America, North America, and Middle East & Africa. Furthermore, the regions are further analyzed at the country level. |
| Segments | Type, Application and Sales Channel |
As per The Brainy Insights, the size of the photosensitive glass market was valued at USD 8.64 billion in 2022 to USD 16.89 billion by 2032.
The global photosensitive glass market is growing at a CAGR of 6.93% during the forecast period 2023-2032.
The North American region became the largest market for photosensitive glass.
Growing demand for photonic devices and telecommunications expansion are influencing the market's growth.
1. Introduction
1.1. Objectives of the Study
1.2. Market Definition
1.3. Research Scope
1.4. Currency
1.5. Key Target Audience
2. Research Methodology and Assumptions
3. Executive Summary
4. Premium Insights
4.1. Porter’s Five Forces Analysis
4.2. Value Chain Analysis
4.3. Top Investment Pockets
4.3.1. Market Attractiveness Analysis by Type
4.3.2. Market Attractiveness Analysis by Application
4.3.3. Market Attractiveness Analysis by Sales Channel
4.3.4. Market Attractiveness Analysis by Region
4.4. Industry Trends
5. Market Dynamics
5.1. Market Evaluation
5.2. Drivers
5.2.1. Growing Demand for Photonic Devices
5.2.2. Telecommunications Expansion
5.2.3. Rising Interest in Holography
5.3. Restraints
5.3.1. High Production Costs
5.3.2. Limited Awareness and Education
5.4. Opportunities
5.4.1. Growth in Optical Communications
5.4.2. Emerging Technologies
5.5. Challenges
5.5.1. Competition from Alternative Materials
5.5.2. Limited Customization
6. Global Photosensitive Glass Market Analysis and Forecast, By Type
6.1. Segment Overview
6.2. Transparent Glass
6.3. Opacified Glass
7. Global Photosensitive Glass Market Analysis and Forecast, By Application
7.1. Segment Overview
7.2. Construction
7.3. Ornaments
7.4. Decorative
7.5. Electronic
7.6. Automotive
7.7. Others
8. Global Photosensitive Glass Market Analysis and Forecast, By Sales Channel
8.1. Segment Overview
8.2. Online
8.3. Offline
9. Global Photosensitive Glass Market Analysis and Forecast, By Regional Analysis
9.1. Segment Overview
9.2. North America
9.2.1. U.S.
9.2.2. Canada
9.2.3. Mexico
9.3. Europe
9.3.1. Germany
9.3.2. France
9.3.3. U.K.
9.3.4. Italy
9.3.5. Spain
9.4. Asia-Pacific
9.4.1. Japan
9.4.2. China
9.4.3. India
9.5. South America
9.5.1. Brazil
9.6. Middle East and Africa
9.6.1. UAE
9.6.2. South Africa
10. Global Photosensitive Glass Market-Competitive Landscape
10.1. Overview
10.2. Market Share of Key Players in the Photosensitive Glass Market
10.2.1. Global Company Market Share
10.2.2. North America Company Market Share
10.2.3. Europe Company Market Share
10.2.4. APAC Company Market Share
10.3. Competitive Situations and Trends
10.3.1. Product Launches and Developments
10.3.2. Partnerships, Collaborations, and Agreements
10.3.3. Mergers & Acquisitions
10.3.4. Expansions
11. Company Profiles
11.1. OptiGrate Corp.
11.1.1. Business Overview
11.1.2. Company Snapshot
11.1.3. Company Market Share Analysis
11.1.4. Company Product Portfolio
11.1.5. Recent Developments
11.1.6. SWOT Analysis
11.2. Hoya Corporation
11.2.1. Business Overview
11.2.2. Company Snapshot
11.2.3. Company Market Share Analysis
11.2.4. Company Product Portfolio
11.2.5. Recent Developments
11.2.6. SWOT Analysis
11.3. Gaffer Glass
11.3.1. Business Overview
11.3.2. Company Snapshot
11.3.3. Company Market Share Analysis
11.3.4. Company Product Portfolio
11.3.5. Recent Developments
11.3.6. SWOT Analysis
11.4. Schott Corporation
11.4.1. Business Overview
11.4.2. Company Snapshot
11.4.3. Company Market Share Analysis
11.4.4. Company Product Portfolio
11.4.5. Recent Developments
11.4.6. SWOT Analysis
11.5. Invenios
11.5.1. Business Overview
11.5.2. Company Snapshot
11.5.3. Company Market Share Analysis
11.5.4. Company Product Portfolio
11.5.5. Recent Developments
11.5.6. SWOT Analysis
11.6. Lastek
11.6.1. Business Overview
11.6.2. Company Snapshot
11.6.3. Company Market Share Analysis
11.6.4. Company Product Portfolio
11.6.5. Recent Developments
11.6.6. SWOT Analysis
11.7. Corning Incorporated
11.7.1. Business Overview
11.7.2. Company Snapshot
11.7.3. Company Market Share Analysis
11.7.4. Company Product Portfolio
11.7.5. Recent Developments
11.7.6. SWOT Analysis
11.8. Owens-Illinois, Inc.
11.8.1. Business Overview
11.8.2. Company Snapshot
11.8.3. Company Market Share Analysis
11.8.4. Company Product Portfolio
11.8.5. Recent Developments
11.8.6. SWOT Analysis
11.9. Verallia
11.9.1. Business Overview
11.9.2. Company Snapshot
11.9.3. Company Market Share Analysis
11.9.4. Company Product Portfolio
11.9.5. Recent Developments
11.9.6. SWOT Analysis
11.10. IPG Photonics Corporation
11.10.1. Business Overview
11.10.2. Company Snapshot
11.10.3. Company Market Share Analysis
11.10.4. Company Product Portfolio
11.10.5. Recent Developments
11.10.6. SWOT Analysis
11.11. 3D Glass Solutions, Inc.
11.11.1. Business Overview
11.11.2. Company Snapshot
11.11.3. Company Market Share Analysis
11.11.4. Company Product Portfolio
11.11.5. Recent Developments
11.11.6. SWOT Analysis
11.12. Sumita Optical Glass, Inc.
11.12.1. Business Overview
11.12.2. Company Snapshot
11.12.3. Company Market Share Analysis
11.12.4. Company Product Portfolio
11.12.5. Recent Developments
11.12.6. SWOT Analysis
11.13. Ondax Inc.
11.13.1. Business Overview
11.13.2. Company Snapshot
11.13.3. Company Market Share Analysis
11.13.4. Company Product Portfolio
11.13.5. Recent Developments
11.13.6. SWOT Analysis
11.14. Vitayon Fine Chemical Technology Co., Ltd.
11.14.1. Business Overview
11.14.2. Company Snapshot
11.14.3. Company Market Share Analysis
11.14.4. Company Product Portfolio
11.14.5. Recent Developments
11.14.6. SWOT Analysis
List of Table
1. Global Photosensitive Glass Market, By Type, 2019-2032 (USD Billion) (Square Meters)
2. Global Transparent Photosensitive Glass, Photosensitive Glass Market, By Region, 2019-2032 (USD Billion) (Square Meters)
3. Global Opacified Photosensitive Glass, Photosensitive Glass Market, By Region, 2019-2032 (USD Billion) (Square Meters)
4. Global Photosensitive Glass Market, By Application, 2019-2032 (USD Billion) (Square Meters)
5. Global Construction Photosensitive Glass Market, By Region, 2019-2032 (USD Billion) (Square Meters)
6. Global Ornaments Photosensitive Glass Market, By Region, 2019-2032 (USD Billion) (Square Meters)
7. Global Decorative Photosensitive Glass Market, By Region, 2019-2032 (USD Billion) (Square Meters)
8. Global Electronic Photosensitive Glass Market, By Region, 2019-2032 (USD Billion) (Square Meters)
9. Global Automotive Photosensitive Glass Market, By Region, 2019-2032 (USD Billion) (Square Meters)
10. Global Others Photosensitive Glass Market, By Region, 2019-2032 (USD Billion) (Square Meters)
11. Global Photosensitive Glass Market, By Sales Channel, 2019-2032 (USD Billion) (Square Meters)
12. Global Online Photosensitive Glass Market, By Region, 2019-2032 (USD Billion) (Square Meters)
13. Global Offline Photosensitive Glass Market, By Region, 2019-2032 (USD Billion) (Square Meters)
14. Global Photosensitive Glass Market, By Region, 2019-2032 (USD Billion) (Square Meters)
15. North America Photosensitive Glass Market, By Type, 2019-2032 (USD Billion) (Square Meters)
16. North America Photosensitive Glass Market, By Application, 2019-2032 (USD Billion) (Square Meters)
17. North America Photosensitive Glass Market, By Sales Channel, 2019-2032 (USD Billion) (Square Meters)
18. U.S. Photosensitive Glass Market, By Type, 2019-2032 (USD Billion) (Square Meters)
19. U.S. Photosensitive Glass Market, By Application, 2019-2032 (USD Billion) (Square Meters)
20. U.S. Photosensitive Glass Market, By Sales Channel, 2019-2032 (USD Billion) (Square Meters)
21. Canada Photosensitive Glass Market, By Type, 2019-2032 (USD Billion) (Square Meters)
22. Canada Photosensitive Glass Market, By Application, 2019-2032 (USD Billion) (Square Meters)
23. Canada Photosensitive Glass Market, By Sales Channel, 2019-2032 (USD Billion) (Square Meters)
24. Mexico Photosensitive Glass Market, By Type, 2019-2032 (USD Billion) (Square Meters)
25. Mexico Photosensitive Glass Market, By Application, 2019-2032 (USD Billion) (Square Meters)
26. Mexico Photosensitive Glass Market, By Sales Channel, 2019-2032 (USD Billion) (Square Meters)
27. Europe Photosensitive Glass Market, By Type, 2019-2032 (USD Billion) (Square Meters)
28. Europe Photosensitive Glass Market, By Application, 2019-2032 (USD Billion) (Square Meters)
29. Europe Photosensitive Glass Market, By Sales Channel, 2019-2032 (USD Billion) (Square Meters)
30. Germany Photosensitive Glass Market, By Type, 2019-2032 (USD Billion) (Square Meters)
31. Germany Photosensitive Glass Market, By Application, 2019-2032 (USD Billion) (Square Meters)
32. Germany Photosensitive Glass Market, By Sales Channel, 2019-2032 (USD Billion) (Square Meters)
33. France Photosensitive Glass Market, By Type, 2019-2032 (USD Billion) (Square Meters)
34. France Photosensitive Glass Market, By Application, 2019-2032 (USD Billion) (Square Meters)
35. France Photosensitive Glass Market, By Sales Channel, 2019-2032 (USD Billion) (Square Meters)
36. U.K. Photosensitive Glass Market, By Type, 2019-2032 (USD Billion) (Square Meters)
37. U.K. Photosensitive Glass Market, By Application, 2019-2032 (USD Billion) (Square Meters)
38. U.K. Photosensitive Glass Market, By Sales Channel, 2019-2032 (USD Billion) (Square Meters)
39. Italy Photosensitive Glass Market, By Type, 2019-2032 (USD Billion) (Square Meters)
40. Italy Photosensitive Glass Market, By Application, 2019-2032 (USD Billion) (Square Meters)
41. Italy Photosensitive Glass Market, By Sales Channel, 2019-2032 (USD Billion) (Square Meters)
42. Spain Photosensitive Glass Market, By Type, 2019-2032 (USD Billion) (Square Meters)
43. Spain Photosensitive Glass Market, By Application, 2019-2032 (USD Billion) (Square Meters)
44. Spain Photosensitive Glass Market, By Sales Channel, 2019-2032 (USD Billion) (Square Meters)
45. Asia Pacific Photosensitive Glass Market, By Type, 2019-2032 (USD Billion) (Square Meters)
46. Asia Pacific Photosensitive Glass Market, By Application, 2019-2032 (USD Billion) (Square Meters)
47. Asia Pacific Photosensitive Glass Market, By Sales Channel, 2019-2032 (USD Billion) (Square Meters)
48. Japan Photosensitive Glass Market, By Type, 2019-2032 (USD Billion) (Square Meters)
49. Japan Photosensitive Glass Market, By Application, 2019-2032 (USD Billion) (Square Meters)
50. Japan Photosensitive Glass Market, By Sales Channel, 2019-2032 (USD Billion) (Square Meters)
51. China Photosensitive Glass Market, By Type, 2019-2032 (USD Billion) (Square Meters)
52. China Photosensitive Glass Market, By Application, 2019-2032 (USD Billion) (Square Meters)
53. China Photosensitive Glass Market, By Sales Channel, 2019-2032 (USD Billion) (Square Meters)
54. India Photosensitive Glass Market, By Type, 2019-2032 (USD Billion) (Square Meters)
55. India Photosensitive Glass Market, By Application, 2019-2032 (USD Billion) (Square Meters)
56. India Photosensitive Glass Market, By Sales Channel, 2019-2032 (USD Billion) (Square Meters)
57. South America Photosensitive Glass Market, By Type, 2019-2032 (USD Billion) (Square Meters)
58. South America Photosensitive Glass Market, By Application, 2019-2032 (USD Billion) (Square Meters)
59. South America Photosensitive Glass Market, By Sales Channel, 2019-2032 (USD Billion) (Square Meters)
60. Brazil Photosensitive Glass Market, By Type, 2019-2032 (USD Billion) (Square Meters)
61. Brazil Photosensitive Glass Market, By Application, 2019-2032 (USD Billion) (Square Meters)
62. Brazil Photosensitive Glass Market, By Sales Channel, 2019-2032 (USD Billion) (Square Meters)
63. Middle East and Africa Photosensitive Glass Market, By Type, 2019-2032 (USD Billion) (Square Meters)
64. Middle East and Africa Photosensitive Glass Market, By Application, 2019-2032 (USD Billion) (Square Meters)
65. Middle East and Africa Photosensitive Glass Market, By Sales Channel, 2019-2032 (USD Billion) (Square Meters)
66. UAE Photosensitive Glass Market, By Type, 2019-2032 (USD Billion) (Square Meters)
67. UAE Photosensitive Glass Market, By Application, 2019-2032 (USD Billion) (Square Meters)
68. UAE Photosensitive Glass Market, By Sales Channel, 2019-2032 (USD Billion) (Square Meters)
69. South Africa Photosensitive Glass Market, By Type, 2019-2032 (USD Billion) (Square Meters)
70. South Africa Photosensitive Glass Market, By Application, 2019-2032 (USD Billion) (Square Meters)
71. South Africa Photosensitive Glass Market, By Sales Channel, 2019-2032 (USD Billion) (Square Meters)
List of Figures
1. Global Photosensitive Glass Market Segmentation
2. Photosensitive Glass Market: Research Methodology
3. Market Size Estimation Methodology: Bottom-Up Approach
4. Market Size Estimation Methodology: Top-Down Approach
5. Data Triangulation
6. Porter’s Five Forces Analysis
7. Value Chain Analysis
8. Global Photosensitive Glass Market Attractiveness Analysis by Type
9. Global Photosensitive Glass Market Attractiveness Analysis by Application
10. Global Photosensitive Glass Market Attractiveness Analysis by Sales Channel
11. Global Photosensitive Glass Market Attractiveness Analysis by Region
12. Global Photosensitive Glass Market: Dynamics
13. Global Photosensitive Glass Market Share by Type (2023 & 2032)
14. Global Photosensitive Glass Market Share by Application (2023 & 2032)
15. Global Photosensitive Glass Market Share by Sales Channel (2023 & 2032)
16. Global Photosensitive Glass Market Share by Regions (2023 & 2032)
17. Global Photosensitive Glass Market Share by Company (2022)
This study forecasts revenue at global, regional, and country levels from 2019 to 2032. The Brainy Insights has segmented the global photosensitive glass market based on below-mentioned segments:
Global Photosensitive Glass Market by Type:
Global Photosensitive Glass Market by Application:
Global Photosensitive Glass Market by Sales Channel:
Global Photosensitive Glass Market by Region:
Research has its special purpose to undertake marketing efficiently. In this competitive scenario, businesses need information across all industry verticals; the information about customer wants, market demand, competition, industry trends, distribution channels etc. This information needs to be updated regularly because businesses operate in a dynamic environment. Our organization, The Brainy Insights incorporates scientific and systematic research procedures in order to get proper market insights and industry analysis for overall business success. The analysis consists of studying the market from a miniscule level wherein we implement statistical tools which helps us in examining the data with accuracy and precision.
Our research reports feature both; quantitative and qualitative aspects for any market. Qualitative information for any market research process are fundamental because they reveal the customer needs and wants, usage and consumption for any product/service related to a specific industry. This in turn aids the marketers/investors in knowing certain perceptions of the customers. Qualitative research can enlighten about the different product concepts and designs along with unique service offering that in turn, helps define marketing problems and generate opportunities. On the other hand, quantitative research engages with the data collection process through interviews, e-mail interactions, surveys and pilot studies. Quantitative aspects for the market research are useful to validate the hypotheses generated during qualitative research method, explore empirical patterns in the data with the help of statistical tools, and finally make the market estimations.
The Brainy Insights offers comprehensive research and analysis, based on a wide assortment of factual insights gained through interviews with CXOs and global experts and secondary data from reliable sources. Our analysts and industry specialist assume vital roles in building up statistical tools and analysis models, which are used to analyse the data and arrive at accurate insights with exceedingly informative research discoveries. The data provided by our organization have proven precious to a diverse range of companies, facilitating them to address issues such as determining which products/services are the most appealing, whether or not customers use the product in the manner anticipated, the purchasing intentions of the market and many others.
Our research methodology encompasses an idyllic combination of primary and secondary initiatives. Key phases involved in this process are listed below:

The phase involves the gathering and collecting of market data and its related information with the help of different sources & research procedures.

The data procurement stage involves in data gathering and collecting through various data sources.
This stage involves in extensive research. These data sources includes:
Purchased Database: Purchased databases play a crucial role in estimating the market sizes irrespective of the domain. Our purchased database includes:
Primary Research: The Brainy Insights interacts with leading companies and experts of the concerned domain to develop the analyst team’s market understanding and expertise. It improves and substantiates every single data presented in the market reports. Primary research mainly involves in telephonic interviews, E-mail interactions and face-to-face interviews with the raw material providers, manufacturers/producers, distributors, & independent consultants. The interviews that we conduct provides valuable data on market size and industry growth trends prevailing in the market. Our organization also conducts surveys with the various industry experts in order to gain overall insights of the industry/market. For instance, in healthcare industry we conduct surveys with the pharmacists, doctors, surgeons and nurses in order to gain insights and key information of a medical product/device/equipment which the customers are going to usage. Surveys are conducted in the form of questionnaire designed by our own analyst team. Surveys plays an important role in primary research because surveys helps us to identify the key target audiences of the market. Additionally, surveys helps to identify the key target audience engaged with the market. Our survey team conducts the survey by targeting the key audience, thus gaining insights from them. Based on the perspectives of the customers, this information is utilized to formulate market strategies. Moreover, market surveys helps us to understand the current competitive situation of the industry. To be precise, our survey process typically involve with the 360 analysis of the market. This analytical process begins by identifying the prospective customers for a product or service related to the market/industry to obtain data on how a product/service could fit into customers’ lives.

Secondary Research: The secondary data sources includes information published by the on-profit organizations such as World bank, WHO, company fillings, investor presentations, annual reports, national government documents, statistical databases, blogs, articles, white papers and others. From the annual report, we analyse a company’s revenue to understand the key segment and market share of that organization in a particular region. We analyse the company websites and adopt the product mapping technique which is important for deriving the segment revenue. In the product mapping method, we select and categorize the products offered by the companies catering to domain specific market, deduce the product revenue for each of the companies so as to get overall estimation of the market size. We also source data and analyses trends based on information received from supply side and demand side intermediaries in the value chain. The supply side denotes the data gathered from supplier, distributor, wholesaler and the demand side illustrates the data gathered from the end customers for respective market domain.

The supply side for a domain specific market is analysed by:
The demand side for the market is estimated through:
In-house Library: Apart from these third-party sources, we have our in-house library of qualitative and quantitative information. Our in-house database includes market data for various industry and domains. These data are updated on regular basis as per the changing market scenario. Our library includes, historic databases, internal audit reports and archives.
Sometimes there are instances where there is no metadata or raw data available for any domain specific market. For those cases, we use our expertise to forecast and estimate the market size in order to generate comprehensive data sets. Our analyst team adopt a robust research technique in order to produce the estimates:
Data Synthesis: This stage involves the analysis & mapping of all the information obtained from the previous step. It also involves in scrutinizing the data for any discrepancy observed while data gathering related to the market. The data is collected with consideration to the heterogeneity of sources. Robust scientific techniques are in place for synthesizing disparate data sets and provide the essential contextual information that can orient market strategies. The Brainy Insights has extensive experience in data synthesis where the data passes through various stages:


Market Deduction & Formulation: The final stage comprises of assigning data points at appropriate market spaces so as to deduce feasible conclusions. Analyst perspective & subject matter expert based holistic form of market sizing coupled with industry analysis also plays a crucial role in this stage.
This stage involves in finalization of the market size and numbers that we have collected from data integration step. With data interpolation, it is made sure that there is no gap in the market data. Successful trend analysis is done by our analysts using extrapolation techniques, which provide the best possible forecasts for the market.
Data Validation & Market Feedback: Validation is the most important step in the process. Validation & re-validation via an intricately designed process helps us finalize data-points to be used for final calculations.

The Brainy Insights interacts with leading companies and experts of the concerned domain to develop the analyst team’s market understanding and expertise. It improves and substantiates every single data presented in the market reports. The data validation interview and discussion panels are typically composed of the most experienced industry members. The participants include, however, are not limited to:
Moreover, we always validate our data and findings through primary respondents from all the major regions we are working on.


Free Customization
Fortune 500 Clients
Free Yearly Update On Purchase Of Multi/Corporate License
Companies Served Till Date