- +1-315-215-1633
- sales@thebrainyinsights.com

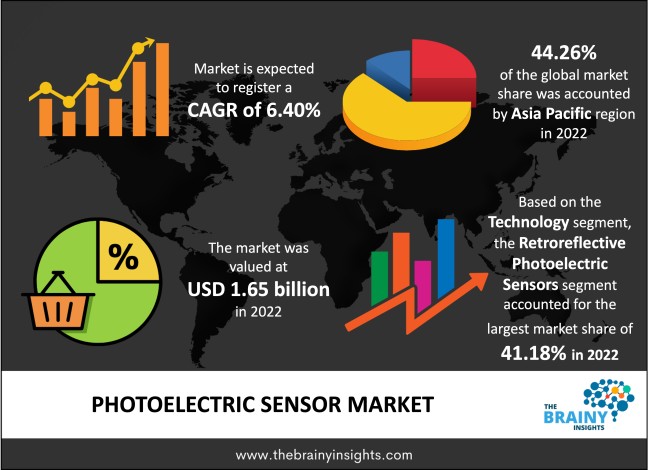
The global photoelectric sensor market was valued at USD 1.65 billion in 2022, increasing at a CAGR of 6.40% from 2023 to 2032 and anticipated to reach USD 3.07 billion by 2032. North America is expected to grow the fastest during the forecast period.
A photoelectric sensor is a gadget that detects a difference in the light level received from the light source. The sensor includes a light source, an amplifier, a signal converter, and an output. A photoelectric sensor detects an object's presence (or absence) or measures the distance between a point and an object. It utilizes a transmitter's visible, infrared, or red light and has a photoelectric receiver. Three major types of photoelectric sensors exist: diffused, thru-beam, and retroreflective. Each sensor has its strengths and can be utilized in different ways. A thru-beam or through-beam photoelectric sensor utilizes two separate modules to function, namely a receiver and a transmitter. These are positioned at either side of the area or object that the sensor is detecting. A retroreflective photoelectric sensor utilizes a separate reflecting module set on the other side of the span, objects, or area being monitored. This bounces the radiated light beam back towards the transmitter module, which houses the photosensor. Pharmaceutical industry applications, like the packaging of medicines, also utilize photoelectric sensors. The sensors can be utilized to avoid discrepancies like empty packaging due to medicine tablets not being on the line, etc., during the packing.
Get an overview of this study by requesting a free sample
The rising use of enhanced technology: The increasing trend of miniaturized sensors, along with rising investments in R&D, are propelling factors of the market growth. Further, the adoption of robotics and complete automation by reprogramming and programming equipment in the food and beverage sector for positioning, cutting, and essential inspection applications, are also expected to drive market growth over the forecast period. Moreover, the increasing government initiatives to favor infrastructure development and smart city construction propel market growth over the forecast period.
The availability of competent alternative technologies: The availability of capable alternative technologies is one of the restraining factors of market growth. Further, the lack of a skilled workforce, rising operational costs, and stringent safety norms hinder the market growth.
The increasing penetration of the Industrial Internet of Things (IIoT): The favourable government policies promoting the manufacturing industry, coupled with the ever-increasing adoption of IIoT solutions, drive market growth. Moreover, industrial & process methods rely on sensors for reliable & accurate data in all aspects of automation and control. The Industrial Internet of Things utilizes this product to measure pressures, positions, and other essential production parameters. Also, the ever-increasing availability of affordable processors & sensors that can provide real-time access to information & technological advancements is helping to boost market growth over the forecast period. Moreover, the essential benefits associated with the industrial internet of things, like automated quality assurance monitoring & large-scale profit margins via productivity improvement, power efficiency, and manufacturing industry efficiency, propel the market growth over the forecast period.
The regions analyzed for the market include Europe, South America, Asia Pacific, North America, the Middle East, and Africa. Asia Pacific emerged as the largest global photoelectric sensor market, with a 44.26% market revenue share in 2022. Asia Pacific dominates the photoelectric sensor market due to the growing penetration of IIoT across numerous industrial facilities. Moreover, the rising use of enhanced technology, increasing activities by key market players, and strong government support for boosting digitalization across the industrial sector are expected to drive market growth over the projection period. North America is expected to grow the fastest during the forecast period due to the region's high popularity of novelty and convenience products, particularly in the U.S. the rising use of enhanced technology and the early adoption and implementation of industrial IoT technology are helping to boost the market growth in this region over the forecast period.
Asia Pacific Region Photoelectric Sensor Market Share in 2022 - 44.26%
www.thebrainyinsights.com
Check the geographical analysis of this market by requesting a free sample
The technology segment is divided into retroreflective photoelectric sensors, reflective photoelectric sensors, through-beam photoelectric sensors, and diffused. The retroreflective photoelectric sensors segment dominated, with a market share of around 41.18% in 2022. This growth is attributed to the increasing use of retroreflective photoelectric sensors in industrial pharmaceuticals, manufacturing, and medical applications. Moreover, retroreflective sensors are utilized in industries like automotive, material handling devices engineering, food and beverage, and access control systems are also helping to promote the segment's market growth.
The beam source segment is divided into standard beam source and laser beam source. In 2022, the laser beam source segment dominated the market with 55.27% and a revenue of USD 0.91 billion. This growth is attributed to the increasing demand for automated process control across different industries.
The range segment is divided into >10,000 MM, 1,000 TO 10,000 MM, 100 TO 1,000 MM, and ≤100 MM. In 2022, the 100 TO 1,000 MM segment dominated the market with 32.26% and a revenue of USD 0.53 billion. This growth is attributed to the rising demand for 100 to 1,000 mm photoelectric sensors from different end-use sectors.
The type segment is divided into fiber optic photoelectric sensor and proximity photoelectric sensor. In 2022, the fiber optic photoelectric sensor segment dominated the market with 57.21% and a revenue of USD 0.94 billion. This growth is attributed to the increasing adoption of digital network technology.
The structure segment is divided into the built-in power supply, built-in amplifier, fiber type, and separate amplifier. In 2022, the built-in amplifier segment dominated the market with 33.11% and a revenue of USD 0.54 billion. This growth is attributed to the extensive usage of built-in amplifier photoelectric sensors in semiconductor manufacturing ICs & wafer detection applications.
The application segment is divided into industrial manufacturing, consumer electronics, building automation, automotive and transportation, packaging, pharmaceuticals and medical, food and beverages, and others. In 2022, the automotive and transportation segment dominated the market with 23.18% and a revenue of USD 0.38 billion. This growth is attributed to the automotive industry's development of new technologies. Further, by 2032, the packaging segment will likely dominate the market due to these devices' increased penetration in the packaging industry.
| Attribute | Description |
|---|---|
| Market Size | Revenue (USD Billion) |
| Market size value in 2022 | USD 1.65 Billion |
| Market size value in 2032 | USD 3.07 Billion |
| CAGR (2023 to 2032) | 6.40% |
| Historical data | 2019-2021 |
| Base Year | 2022 |
| Forecast | 2023-2032 |
| Regional Segments | The key regions are North America, South America, Europe, Asia Pacific, and Middle East & Africa. |
| Segments | Key Segments are technology, beam source, range, type, structure, application and regions |
Asia Pacific region emerged as the largest market for photoelectric sensor.
The market's growth will be influenced by the rising use of enhanced technology.
The lack of a skilled workforce could hamper the market growth.
The increasing penetration of the Industrial Internet of Things (IIoT) will provide huge opportunities to the market.
1. Introduction
1.1. Objectives of the Study
1.2. Market Definition
1.3. Research Scope
1.4. Currency
1.5. Key Target Audience
2. Research Methodology and Assumptions
3. Executive Summary
4. Premium Insights
4.1. Porter’s Five Forces Analysis
4.2. Value Chain Analysis
4.3. Top Investment Pockets
4.3.1. Market Attractiveness Analysis By Technology
4.3.2. Market Attractiveness Analysis By Beam Source
4.3.3. Market Attractiveness Analysis By Range
4.3.4. Market Attractiveness Analysis By Type
4.3.5. Market Attractiveness Analysis By Structure
4.3.6. Market Attractiveness Analysis By Application
4.3.7. Market Attractiveness Analysis By Region
4.4. Industry Trends
5. Market Dynamics
5.1. Market Evaluation
5.2. Drivers
5.2.1. The rapid adoption of the photoelectric sensor
5.2.2. The increasing demand from the automotive industry
5.2.3. The rising use of enhanced technology
5.3. Restraints
5.3.1. The availability of competent alternative technologies
5.3.2. The high maintenance costs of photoelectric sensors
5.4. Opportunities
5.4.1. The increasing penetration of the Industrial Internet of Things (IIoT)
5.4.2. The increasing digitization & connected industries
1. Global Photoelectric Sensor Market Analysis and Forecast, By Technology
1.1. Segment Overview
1.2. Retroreflective Photoelectric Sensors
1.3. Reflective Photoelectric Sensors
1.4. Through-Beam Photoelectric Sensors
1.5. Diffused
2. Global Photoelectric Sensor Market Analysis and Forecast, By Beam Source
2.1. Segment Overview
2.2. Standard Beam Source
2.3. Laser Beam Source
3. Global Photoelectric Sensor Market Analysis and Forecast, By Range
3.1. Segment Overview
3.2. >10,000 MM
3.3. 1,000 TO 10,000 MM
3.4. 100 TO 1,000 MM
3.5. ≤100 MM
4. Global Photoelectric Sensor Market Analysis and Forecast, By Type
4.1. Segment Overview
4.2. Fiber Optic Photoelectric Sensor
4.3. Proximity Photoelectric Sensor
5. Global Photoelectric Sensor Market Analysis and Forecast, By Structure
5.1. Segment Overview
5.2. Built-In Power Supply
5.3. Built-In Amplifier
5.4. Fiber Type
5.5. Separate Amplifier
6. Global Photoelectric Sensor Market Analysis and Forecast, By Application
5.6. Segment Overview
5.7. Industrial Manufacturing
5.8. Consumer Electronics
5.9. Building Automation
5.10. Automotive and Transportation
5.11. Packaging
5.12. Pharmaceuticals and Medical
5.13. Food and Beverages
5.14. Others
7. Global Photoelectric Sensor Market Analysis and Forecast, By Regional Analysis
7.1. Segment Overview
7.2. North America
7.2.1. U.S.
7.2.2. Canada
7.2.3. Mexico
7.3. Europe
7.3.1. Germany
7.3.2. France
7.3.3. U.K.
7.3.4. Italy
7.3.5. Spain
7.4. Asia-Pacific
7.4.1. Japan
7.4.2. China
7.4.3. India
7.5. South America
7.5.1. Brazil
7.6. Middle East and Africa
7.6.1. UAE
7.6.2. South Africa
8. Global Photoelectric Sensor Market-Competitive Landscape
8.1. Overview
8.2. Market Share of Key Players in Global Photoelectric Sensor Market
8.2.1. Global Company Market Share
8.2.2. North America Company Market Share
8.2.3. Europe Company Market Share
8.2.4. APAC Company Market Share
8.3. Competitive Situations and Trends
8.3.1. Product Launches and Developments
8.3.2. Partnerships, Collaborations, and Agreements
8.3.3. Mergers & Acquisitions
8.3.4. Expansions
9. Company Profiles
9.1. Pepperl
9.1.1. Business Overview
9.1.2. Company Snapshot
9.1.3. Company Market Share Analysis
9.1.4. Company Product Portfolio
9.1.5. Recent Developments
9.1.6. SWOT Analysis
9.2. Rockwell
9.2.1. Business Overview
9.2.2. Company Snapshot
9.2.3. Company Market Share Analysis
9.2.4. Company Product Portfolio
9.2.5. Recent Developments
9.2.6. SWOT Analysis
9.3. Banner Engineering
9.3.1. Business Overview
9.3.2. Company Snapshot
9.3.3. Company Market Share Analysis
9.3.4. Company Product Portfolio
9.3.5. Recent Developments
9.3.6. SWOT Analysis
9.4. Balluff
9.4.1. Business Overview
9.4.2. Company Snapshot
9.4.3. Company Market Share Analysis
9.4.4. Company Product Portfolio
9.4.5. Recent Developments
9.4.6. SWOT Analysis
9.5. Omron
9.5.1. Business Overview
9.5.2. Company Snapshot
9.5.3. Company Market Share Analysis
9.5.4. Company Product Portfolio
9.5.5. Recent Developments
9.5.6. SWOT Analysis
9.6. Bernstein
9.6.1. Business Overview
9.6.2. Company Snapshot
9.6.3. Company Market Share Analysis
9.6.4. Company Product Portfolio
9.6.5. Recent Developments
9.6.6. SWOT Analysis
9.7. IFM
9.7.1. Business Overview
9.7.2. Company Snapshot
9.7.3. Company Market Share Analysis
9.7.4. Company Product Portfolio
9.7.5. Recent Developments
9.7.6. SWOT Analysis
9.8. Schneider Electric
9.8.1. Business Overview
9.8.2. Company Snapshot
9.8.3. Company Market Share Analysis
9.8.4. Company Product Portfolio
9.8.5. Recent Developments
9.8.6. SWOT Analysis
9.9. Keyence
9.9.1. Business Overview
9.9.2. Company Snapshot
9.9.3. Company Market Share Analysis
9.9.4. Company Product Portfolio
9.9.5. Recent Developments
9.9.6. SWOT Analysis
9.10. Autonics
9.10.1. Business Overview
9.10.2. Company Snapshot
9.10.3. Company Market Share Analysis
9.10.4. Company Product Portfolio
9.10.5. Recent Developments
9.10.6. SWOT Analysis
9.11. Cntd Electric Technology
9.11.1. Business Overview
9.11.2. Company Snapshot
9.11.3. Company Market Share Analysis
9.11.4. Company Product Portfolio
9.11.5. Recent Developments
9.11.6. SWOT Analysis
9.12. Panasonic
9.12.1. Business Overview
9.12.2. Company Snapshot
9.12.3. Company Market Share Analysis
9.12.4. Company Product Portfolio
9.12.5. Recent Developments
9.12.6. SWOT Analysis
9.13. Sick
9.13.1. Business Overview
9.13.2. Company Snapshot
9.13.3. Company Market Share Analysis
9.13.4. Company Product Portfolio
9.13.5. Recent Developments
9.13.6. SWOT Analysis
9.14. Wenglor Sensoric
9.14.1. Business Overview
9.14.2. Company Snapshot
9.14.3. Company Market Share Analysis
9.14.4. Company Product Portfolio
9.14.5. Recent Developments
9.14.6. SWOT Analysis
9.15. Leuze Electronic
9.15.1. Business Overview
9.15.2. Company Snapshot
9.15.3. Company Market Share Analysis
9.15.4. Company Product Portfolio
9.15.5. Recent Developments
9.15.6. SWOT Analysis
9.16. Avago Corporation
9.16.1. Business Overview
9.16.2. Company Snapshot
9.16.3. Company Market Share Analysis
9.16.4. Company Product Portfolio
9.16.5. Recent Developments
9.16.6. SWOT Analysis
9.17. Sensopart Industriesensorik
9.17.1. Business Overview
9.17.2. Company Snapshot
9.17.3. Company Market Share Analysis
9.17.4. Company Product Portfolio
9.17.5. Recent Developments
9.17.6. SWOT Analysis
9.18. Baumer Group
9.18.1. Business Overview
9.18.2. Company Snapshot
9.18.3. Company Market Share Analysis
9.18.4. Company Product Portfolio
9.18.5. Recent Developments
9.18.6. SWOT Analysis
9.19. HTM Sensors
9.19.1. Business Overview
9.19.2. Company Snapshot
9.19.3. Company Market Share Analysis
9.19.4. Company Product Portfolio
9.19.5. Recent Developments
9.19.6. SWOT Analysis
9.20. Eaton Corporation
9.20.1. Business Overview
9.20.2. Company Snapshot
9.20.3. Company Market Share Analysis
9.20.4. Company Product Portfolio
9.20.5. Recent Developments
9.20.6. SWOT Analysis
9.21. Fargo Controls
9.21.1. Business Overview
9.21.2. Company Snapshot
9.21.3. Company Market Share Analysis
9.21.4. Company Product Portfolio
9.21.5. Recent Developments
9.21.6. SWOT Analysis
List of Table
1. Global Photoelectric Sensor Market, By Technology, 2019-2032 (USD Billion)
2. Global Retroreflective Photoelectric Sensors, Photoelectric Sensor Market, By Region, 2019-2032 (USD Billion)
3. Global Reflective Photoelectric Sensors, Photoelectric Sensor Market, By Region, 2019-2032 (USD Billion)
4. Global Through-Beam Photoelectric Sensors, and Diffused, Photoelectric Sensor Market, By Region, 2019-2032 (USD Billion)
5. Global Diffused, Photoelectric Sensor Market, By Region, 2019-2032 (USD Billion)
6. Global Photoelectric Sensor Market, By Beam Source, 2019-2032 (USD Billion)
7. Global Standard Beam Source, Photoelectric Sensor Market, By Region, 2019-2032 (USD Billion)
8. Global Laser Beam Source, Photoelectric Sensor Market, By Region, 2019-2032 (USD Billion)
9. Global Photoelectric Sensor Market, By Range, 2019-2032 (USD Billion)
10. Global >10,000 MM, Photoelectric Sensor Market, By Region, 2019-2032 (USD Billion)
11. Global 1,000 TO 10,000 MM, Photoelectric Sensor Market, By Region, 2019-2032 (USD Billion)
12. Global 100 TO 1,000 MM, Photoelectric Sensor Market, By Region, 2019-2032 (USD Billion)
13. Global ≤100 MM, Photoelectric Sensor Market, By Region, 2019-2032 (USD Billion)
14. Global Photoelectric Sensor Market, By Type, 2019-2032 (USD Billion)
15. Global Fiber Optic Photoelectric Sensor, Photoelectric Sensor Market, By Region, 2019-2032 (USD Billion)
16. Global Proximity Photoelectric Sensor, Photoelectric Sensor Market, By Region, 2019-2032 (USD Billion)
17. Global Photoelectric Sensor Market, By Structure, 2019-2032 (USD Billion)
18. Global Built-In Power Supply, Photoelectric Sensor Market, By Region, 2019-2032 (USD Billion)
19. Global Built-In Amplifier, Photoelectric Sensor Market, By Region, 2019-2032 (USD Billion)
20. Global Fiber Type, Photoelectric Sensor Market, By Region, 2019-2032 (USD Billion)
21. Global Separate Amplifier, Photoelectric Sensor Market, By Region, 2019-2032 (USD Billion)
22. Global Photoelectric Sensor Market, By Application, 2019-2032 (USD Billion)
23. Global Industrial Manufacturing, Photoelectric Sensor Market, By Region, 2019-2032 (USD Billion)
24. Global Consumer Electronics, Photoelectric Sensor Market, By Region, 2019-2032 (USD Billion)
25. Global Building Automation, Photoelectric Sensor Market, By Region, 2019-2032 (USD Billion)
26. Global Automotive and Transportation, Photoelectric Sensor Market, By Region, 2019-2032 (USD Billion)
27. Global Packaging, Photoelectric Sensor Market, By Region, 2019-2032 (USD Billion)
28. Global Pharmaceuticals and Medical, Photoelectric Sensor Market, By Region, 2019-2032 (USD Billion)
29. Global Food and Beverages, Photoelectric Sensor Market, By Region, 2019-2032 (USD Billion)
30. Global Others, Photoelectric Sensor Market, By Region, 2019-2032 (USD Billion)
31. North America Photoelectric Sensor Market, By Technology, 2019-2032 (USD Billion)
32. North America Photoelectric Sensor Market, By Beam Source, 2019-2032 (USD Billion)
33. North America Photoelectric Sensor Market, By Range, 2019-2032 (USD Billion)
34. North America Photoelectric Sensor Market, By Type, 2019-2032 (USD Billion)
35. North America Photoelectric Sensor Market, By Structure, 2019-2032 (USD Billion)
36. North America Photoelectric Sensor Market, By Application, 2019-2032 (USD Billion)
37. U.S. Photoelectric Sensor Market, By Technology, 2019-2032 (USD Billion)
38. U.S. Photoelectric Sensor Market, By Beam Source, 2019-2032 (USD Billion)
39. U.S. Photoelectric Sensor Market, By Range, 2019-2032 (USD Billion)
40. U.S. Photoelectric Sensor Market, By Type, 2019-2032 (USD Billion)
41. U.S. Photoelectric Sensor Market, By Structure, 2019-2032 (USD Billion)
42. U.S. Photoelectric Sensor Market, By Application, 2019-2032 (USD Billion)
43. Canada Photoelectric Sensor Market, By Technology, 2019-2032 (USD Billion)
44. Canada Photoelectric Sensor Market, By Beam Source, 2019-2032 (USD Billion)
45. Canada Photoelectric Sensor Market, By Range, 2019-2032 (USD Billion)
46. Canada Photoelectric Sensor Market, By Type, 2019-2032 (USD Billion)
47. Canada Photoelectric Sensor Market, By Structure, 2019-2032 (USD Billion)
48. Canada Photoelectric Sensor Market, By Application, 2019-2032 (USD Billion)
49. Mexico Photoelectric Sensor Market, By Technology, 2019-2032 (USD Billion)
50. Mexico Photoelectric Sensor Market, By Beam Source, 2019-2032 (USD Billion)
51. Mexico Photoelectric Sensor Market, By Range, 2019-2032 (USD Billion)
52. Mexico Photoelectric Sensor Market, By Type, 2019-2032 (USD Billion)
53. Mexico Photoelectric Sensor Market, By Structure, 2019-2032 (USD Billion)
54. Mexico Photoelectric Sensor Market, By Application, 2019-2032 (USD Billion)
55. Europe Photoelectric Sensor Market, By Technology, 2019-2032 (USD Billion)
56. Europe Photoelectric Sensor Market, By Beam Source, 2019-2032 (USD Billion)
57. Europe Photoelectric Sensor Market, By Range, 2019-2032 (USD Billion)
58. Europe Photoelectric Sensor Market, By Type, 2019-2032 (USD Billion)
59. Europe Photoelectric Sensor Market, By Structure, 2019-2032 (USD Billion)
60. Europe Photoelectric Sensor Market, By Application, 2019-2032 (USD Billion)
61. Germany Photoelectric Sensor Market, By Technology, 2019-2032 (USD Billion)
62. Germany Photoelectric Sensor Market, By Beam Source, 2019-2032 (USD Billion)
63. Germany Photoelectric Sensor Market, By Range, 2019-2032 (USD Billion)
64. Germany Photoelectric Sensor Market, By Type, 2019-2032 (USD Billion)
65. Germany Photoelectric Sensor Market, By Structure, 2019-2032 (USD Billion)
66. Germany Photoelectric Sensor Market, By Application, 2019-2032 (USD Billion)
67. France Photoelectric Sensor Market, By Technology, 2019-2032 (USD Billion)
68. France Photoelectric Sensor Market, By Beam Source, 2019-2032 (USD Billion)
69. France Photoelectric Sensor Market, By Range, 2019-2032 (USD Billion)
70. France Photoelectric Sensor Market, By Type, 2019-2032 (USD Billion)
71. France Photoelectric Sensor Market, By Structure, 2019-2032 (USD Billion)
72. France Photoelectric Sensor Market, By Application, 2019-2032 (USD Billion)
73. U.K. Photoelectric Sensor Market, By Technology, 2019-2032 (USD Billion)
74. U.K. Photoelectric Sensor Market, By Beam Source, 2019-2032 (USD Billion)
75. U.K. Photoelectric Sensor Market, By Range, 2019-2032 (USD Billion)
76. U.K. Photoelectric Sensor Market, By Type, 2019-2032 (USD Billion)
77. U.K. Photoelectric Sensor Market, By Structure, 2019-2032 (USD Billion)
78. U.K. Photoelectric Sensor Market, By Application, 2019-2032 (USD Billion)
79. Italy Photoelectric Sensor Market, By Technology, 2019-2032 (USD Billion)
80. Italy Photoelectric Sensor Market, By Beam Source, 2019-2032 (USD Billion)
81. Italy Photoelectric Sensor Market, By Range, 2019-2032 (USD Billion)
82. Italy Photoelectric Sensor Market, By Type, 2019-2032 (USD Billion)
83. Italy Photoelectric Sensor Market, By Structure, 2019-2032 (USD Billion)
84. Italy Photoelectric Sensor Market, By Application, 2019-2032 (USD Billion)
85. Spain Photoelectric Sensor Market, By Technology, 2019-2032 (USD Billion)
86. Spain Photoelectric Sensor Market, By Beam Source, 2019-2032 (USD Billion)
87. Spain Photoelectric Sensor Market, By Range, 2019-2032 (USD Billion)
88. Spain Photoelectric Sensor Market, By Type, 2019-2032 (USD Billion)
89. Spain Photoelectric Sensor Market, By Structure, 2019-2032 (USD Billion)
90. Spain Photoelectric Sensor Market, By Application, 2019-2032 (USD Billion)
91. Asia Pacific Photoelectric Sensor Market, By Technology, 2019-2032 (USD Billion)
92. Asia Pacific Photoelectric Sensor Market, By Beam Source, 2019-2032 (USD Billion)
93. Asia Pacific Photoelectric Sensor Market, By Range, 2019-2032 (USD Billion)
94. Asia Pacific Photoelectric Sensor Market, By Type, 2019-2032 (USD Billion)
95. Asia Pacific Photoelectric Sensor Market, By Structure, 2019-2032 (USD Billion)
96. Asia Pacific Photoelectric Sensor Market, By Application, 2019-2032 (USD Billion)
97. Japan Photoelectric Sensor Market, By Technology, 2019-2032 (USD Billion)
98. Japan Photoelectric Sensor Market, By Beam Source, 2019-2032 (USD Billion)
99. Japan Photoelectric Sensor Market, By Range, 2019-2032 (USD Billion)
100. Japan Photoelectric Sensor Market, By Type, 2019-2032 (USD Billion)
101. Japan Photoelectric Sensor Market, By Structure, 2019-2032 (USD Billion)
102. Japan Photoelectric Sensor Market, By Application, 2019-2032 (USD Billion)
103. China Photoelectric Sensor Market, By Technology, 2019-2032 (USD Billion)
104. China Photoelectric Sensor Market, By Beam Source, 2019-2032 (USD Billion)
105. China Photoelectric Sensor Market, By Range, 2019-2032 (USD Billion)
106. China Photoelectric Sensor Market, By Type, 2019-2032 (USD Billion)
107. China Photoelectric Sensor Market, By Structure, 2019-2032 (USD Billion)
108. China Photoelectric Sensor Market, By Application, 2019-2032 (USD Billion)
109. India Photoelectric Sensor Market, By Technology, 2019-2032 (USD Billion)
110. India Photoelectric Sensor Market, By Beam Source, 2019-2032 (USD Billion)
111. India Photoelectric Sensor Market, By Range, 2019-2032 (USD Billion)
112. India Photoelectric Sensor Market, By Type, 2019-2032 (USD Billion)
113. India Photoelectric Sensor Market, By Structure, 2019-2032 (USD Billion)
114. India Photoelectric Sensor Market, By Application, 2019-2032 (USD Billion)
115. South America Photoelectric Sensor Market, By Technology, 2019-2032 (USD Billion)
116. South America Photoelectric Sensor Market, By Beam Source, 2019-2032 (USD Billion)
117. South America Photoelectric Sensor Market, By Range, 2019-2032 (USD Billion)
118. South America Photoelectric Sensor Market, By Type, 2019-2032 (USD Billion)
119. South America Photoelectric Sensor Market, By Structure, 2019-2032 (USD Billion)
120. South America Photoelectric Sensor Market, By Application, 2019-2032 (USD Billion)
121. Brazil Photoelectric Sensor Market, By Technology, 2019-2032 (USD Billion)
122. Brazil Photoelectric Sensor Market, By Beam Source, 2019-2032 (USD Billion)
123. Brazil Photoelectric Sensor Market, By Range, 2019-2032 (USD Billion)
124. Brazil Photoelectric Sensor Market, By Type, 2019-2032 (USD Billion)
125. Brazil Photoelectric Sensor Market, By Structure, 2019-2032 (USD Billion)
126. Brazil Photoelectric Sensor Market, By Application, 2019-2032 (USD Billion)
127. Middle East and Africa Photoelectric Sensor Market, By Technology, 2019-2032 (USD Billion)
128. Middle East and Africa Photoelectric Sensor Market, By Beam Source, 2019-2032 (USD Billion)
129. Middle East and Africa Photoelectric Sensor Market, By Range, 2019-2032 (USD Billion)
130. Middle East and Africa Photoelectric Sensor Market, By Type, 2019-2032 (USD Billion)
131. Middle East and Africa Photoelectric Sensor Market, By Structure, 2019-2032 (USD Billion)
132. Middle East and Africa Photoelectric Sensor Market, By Application, 2019-2032 (USD Billion)
133. UAE Photoelectric Sensor Market, By Technology, 2019-2032 (USD Billion)
134. UAE Photoelectric Sensor Market, By Beam Source, 2019-2032 (USD Billion)
135. UAE Photoelectric Sensor Market, By Range, 2019-2032 (USD Billion)
136. UAE Photoelectric Sensor Market, By Type, 2019-2032 (USD Billion)
137. UAE Photoelectric Sensor Market, By Structure, 2019-2032 (USD Billion)
138. UAE Photoelectric Sensor Market, By Application, 2019-2032 (USD Billion)
139. South Africa Photoelectric Sensor Market, By Technology, 2019-2032 (USD Billion)
140. South Africa Photoelectric Sensor Market, By Beam Source, 2019-2032 (USD Billion)
141. South Africa Photoelectric Sensor Market, By Range, 2019-2032 (USD Billion)
142. South Africa Photoelectric Sensor Market, By Type, 2019-2032 (USD Billion)
143. South Africa Photoelectric Sensor Market, By Structure, 2019-2032 (USD Billion)
144. South Africa Photoelectric Sensor Market, By Application, 2019-2032 (USD Billion)
List of Figures
1. Global Photoelectric Sensor Market Segmentation
2. Global Photoelectric Sensor Market: Research Methodology
3. Market Size Estimation Methodology: Bottom-Up Approach
4. Market Size Estimation Methodology: Top-Down Approach
5. Data Triangulation
6. Porter’s Five Forces Analysis
7. Value Chain Analysis
8. Global Photoelectric Sensor Market Attractiveness Analysis By Technology
9. Global Photoelectric Sensor Market Attractiveness Analysis By Beam Source
10. Global Photoelectric Sensor Market Attractiveness Analysis By Range
11. Global Photoelectric Sensor Market Attractiveness Analysis By Type
12. Global Photoelectric Sensor Market Attractiveness Analysis By Structure
13. Global Photoelectric Sensor Market Attractiveness Analysis By Application
14. Global Photoelectric Sensor Market Attractiveness Analysis By Region
15. Global Photoelectric Sensor Market: Dynamics
16. Global Photoelectric Sensor Market Share By Technology (2023 & 2032)
17. Global Photoelectric Sensor Market Share By Beam Source (2023 & 2032)
18. Global Photoelectric Sensor Market Share By Range (2023 & 2032)
19. Global Photoelectric Sensor Market Share By Type (2023 & 2032)
20. Global Photoelectric Sensor Market Share By Structure (2023 & 2032)
21. Global Photoelectric Sensor Market Share By Application (2023 & 2032)
22. Global Photoelectric Sensor Market Share By Regions (2023 & 2032)
23. Global Photoelectric Sensor Market Share By Company (2022)
This study forecasts revenue at global, regional, and country levels from 2019 to 2032. The Brainy Insights has segmented the global photoelectric sensor based on below mentioned segments:
Global Photoelectric Sensor Market by Technology:
Global Photoelectric Sensor Market by Beam Source:
Global Photoelectric Sensor Market by Range:
Global Photoelectric Sensor Market by Type
Global Photoelectric Sensor Market by Structure
Global Photoelectric Sensor Market by Application
Global Photoelectric Sensor by Region:
Research has its special purpose to undertake marketing efficiently. In this competitive scenario, businesses need information across all industry verticals; the information about customer wants, market demand, competition, industry trends, distribution channels etc. This information needs to be updated regularly because businesses operate in a dynamic environment. Our organization, The Brainy Insights incorporates scientific and systematic research procedures in order to get proper market insights and industry analysis for overall business success. The analysis consists of studying the market from a miniscule level wherein we implement statistical tools which helps us in examining the data with accuracy and precision.
Our research reports feature both; quantitative and qualitative aspects for any market. Qualitative information for any market research process are fundamental because they reveal the customer needs and wants, usage and consumption for any product/service related to a specific industry. This in turn aids the marketers/investors in knowing certain perceptions of the customers. Qualitative research can enlighten about the different product concepts and designs along with unique service offering that in turn, helps define marketing problems and generate opportunities. On the other hand, quantitative research engages with the data collection process through interviews, e-mail interactions, surveys and pilot studies. Quantitative aspects for the market research are useful to validate the hypotheses generated during qualitative research method, explore empirical patterns in the data with the help of statistical tools, and finally make the market estimations.
The Brainy Insights offers comprehensive research and analysis, based on a wide assortment of factual insights gained through interviews with CXOs and global experts and secondary data from reliable sources. Our analysts and industry specialist assume vital roles in building up statistical tools and analysis models, which are used to analyse the data and arrive at accurate insights with exceedingly informative research discoveries. The data provided by our organization have proven precious to a diverse range of companies, facilitating them to address issues such as determining which products/services are the most appealing, whether or not customers use the product in the manner anticipated, the purchasing intentions of the market and many others.
Our research methodology encompasses an idyllic combination of primary and secondary initiatives. Key phases involved in this process are listed below:

The phase involves the gathering and collecting of market data and its related information with the help of different sources & research procedures.

The data procurement stage involves in data gathering and collecting through various data sources.
This stage involves in extensive research. These data sources includes:
Purchased Database: Purchased databases play a crucial role in estimating the market sizes irrespective of the domain. Our purchased database includes:
Primary Research: The Brainy Insights interacts with leading companies and experts of the concerned domain to develop the analyst team’s market understanding and expertise. It improves and substantiates every single data presented in the market reports. Primary research mainly involves in telephonic interviews, E-mail interactions and face-to-face interviews with the raw material providers, manufacturers/producers, distributors, & independent consultants. The interviews that we conduct provides valuable data on market size and industry growth trends prevailing in the market. Our organization also conducts surveys with the various industry experts in order to gain overall insights of the industry/market. For instance, in healthcare industry we conduct surveys with the pharmacists, doctors, surgeons and nurses in order to gain insights and key information of a medical product/device/equipment which the customers are going to usage. Surveys are conducted in the form of questionnaire designed by our own analyst team. Surveys plays an important role in primary research because surveys helps us to identify the key target audiences of the market. Additionally, surveys helps to identify the key target audience engaged with the market. Our survey team conducts the survey by targeting the key audience, thus gaining insights from them. Based on the perspectives of the customers, this information is utilized to formulate market strategies. Moreover, market surveys helps us to understand the current competitive situation of the industry. To be precise, our survey process typically involve with the 360 analysis of the market. This analytical process begins by identifying the prospective customers for a product or service related to the market/industry to obtain data on how a product/service could fit into customers’ lives.

Secondary Research: The secondary data sources includes information published by the on-profit organizations such as World bank, WHO, company fillings, investor presentations, annual reports, national government documents, statistical databases, blogs, articles, white papers and others. From the annual report, we analyse a company’s revenue to understand the key segment and market share of that organization in a particular region. We analyse the company websites and adopt the product mapping technique which is important for deriving the segment revenue. In the product mapping method, we select and categorize the products offered by the companies catering to domain specific market, deduce the product revenue for each of the companies so as to get overall estimation of the market size. We also source data and analyses trends based on information received from supply side and demand side intermediaries in the value chain. The supply side denotes the data gathered from supplier, distributor, wholesaler and the demand side illustrates the data gathered from the end customers for respective market domain.

The supply side for a domain specific market is analysed by:
The demand side for the market is estimated through:
In-house Library: Apart from these third-party sources, we have our in-house library of qualitative and quantitative information. Our in-house database includes market data for various industry and domains. These data are updated on regular basis as per the changing market scenario. Our library includes, historic databases, internal audit reports and archives.
Sometimes there are instances where there is no metadata or raw data available for any domain specific market. For those cases, we use our expertise to forecast and estimate the market size in order to generate comprehensive data sets. Our analyst team adopt a robust research technique in order to produce the estimates:
Data Synthesis: This stage involves the analysis & mapping of all the information obtained from the previous step. It also involves in scrutinizing the data for any discrepancy observed while data gathering related to the market. The data is collected with consideration to the heterogeneity of sources. Robust scientific techniques are in place for synthesizing disparate data sets and provide the essential contextual information that can orient market strategies. The Brainy Insights has extensive experience in data synthesis where the data passes through various stages:


Market Deduction & Formulation: The final stage comprises of assigning data points at appropriate market spaces so as to deduce feasible conclusions. Analyst perspective & subject matter expert based holistic form of market sizing coupled with industry analysis also plays a crucial role in this stage.
This stage involves in finalization of the market size and numbers that we have collected from data integration step. With data interpolation, it is made sure that there is no gap in the market data. Successful trend analysis is done by our analysts using extrapolation techniques, which provide the best possible forecasts for the market.
Data Validation & Market Feedback: Validation is the most important step in the process. Validation & re-validation via an intricately designed process helps us finalize data-points to be used for final calculations.

The Brainy Insights interacts with leading companies and experts of the concerned domain to develop the analyst team’s market understanding and expertise. It improves and substantiates every single data presented in the market reports. The data validation interview and discussion panels are typically composed of the most experienced industry members. The participants include, however, are not limited to:
Moreover, we always validate our data and findings through primary respondents from all the major regions we are working on.


Free Customization
Fortune 500 Clients
Free Yearly Update On Purchase Of Multi/Corporate License
Companies Served Till Date