- +1-315-215-1633
- sales@thebrainyinsights.com

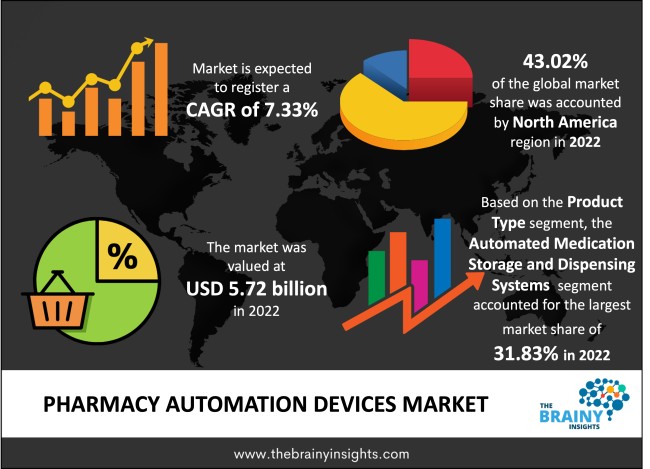
The global pharmacy automation devices market was valued at USD 5.72 Billion in 2022 and grew at a CAGR of 7.33% from 2023 to 2032. The market is expected to reach USD 11.60 Billion by 2032. The increasing demand for pharmacy automation devices can be attributed to the rising automation requirement among end-users. These pharmacy automation devices enable efficient drug sorting, storing and distribution, leading to higher usage in pharmacies and hospitals.
Pharmacy automation devices enable electronic sorting, distribution, packaging, and counting prescription drugs. Among the many benefits of pharmacy automation devices are increased productivity, higher accuracy and lower labour costs. Without manually entering the patients' meds, chemists can sync and keep track of them by using the dispensing equipment. Dispensing pharmaceuticals is a significant challenge for pharmacies because it can introduce numerous errors and impurities. Pharmacy automation devices offer pharmacy managers several advantages, such as better space savings, greater inventory control, improved narcotics security, and increased accuracy and speed.
Get an overview of this study by requesting a free sample
Increasing use of pharmacy automation among end-users: Hospitals use pharmacy automation devices to help patients receive better care and save money over the long run. By introducing automation into the hospital setting, the pharmacy personnel will no longer be required to count drugs in the hospital basement. Hospitals need to be sufficiently young to construct floors to allow pharmacy automation. Thus, new dispensing cabinets are currently being designed around existing hospital floor designs for optimal use of space. The significant advancement in pharmacy automation over the past ten years has been the development of more effective, adaptable drug-dispensing cabinets with high-capacity drawers that can be coupled in various ways to meet a facility's specific requirements. Due to this flexibility, the automation footprint on hospital floors has been significantly decreased, and it is now possible to run more technologies through a single cabinet.
High capital cost: The market for pharmacy automation devices may be hampered by the high installation cost. Pharmacy automation devices are costly as it is equipped with several features. Given the quantity required for manufacturing material requirements, specifically for large-scale pharmacy automation devices, these equipment are erratic and expensive.
Growing technical advancements: The technological advancements in pharmacy automation device production provide lucrative market opportunities, especially in developing regions like Asia-Pacific. Medication dispensing systems, telepharmacy, robotics, and automated inventory management systems are now the most recent trends in the global market for pharmacy automation systems. Many of these gadgets serve distinct functions, yet they all work towards the same objective: to increase patient outcomes and accuracy while lowering prescription errors and costs. Pharmacy robotics are mechanical systems that, once designed, replicate human behaviour without constant assistance from the operator.
The regions analyzed for the market include North America, Europe, South America, Asia Pacific, the Middle East, and Africa. North America emerged as the most significant Pharmacy Automation Devices market, with a 43.02% market revenue share in 2022.
North America region will account for the largest market share with revenue growth. Nations such as the U.S. and Canada have a tremendous demand for pharmacy automation devices due to growing requirements in the pharmacy and healthcare industry. The increasing number of manufacturers developing high-end pharmacy automation devices will provide lucrative opportunities to the market.
North America region Pharmacy Automation Devices Market Share in 2022 - 43.02%
www.thebrainyinsights.com
Check the geographical analysis of this market by requesting a free sample
The product type segment is divided into automated medication storage and dispensing systems, automated tabletop counters, automated labelling and packaging systems, automated medication compounding systems and others. The automated medication storage and dispensing systems segment further includes automated dispensing cabinets, robotic automated dispensing systems and carousels. The automated medication storage and dispensing systems segment dominated the market, with a share of around 31.83% in 2022. Hospitals and healthcare organizations have recently embraced automated medication storage and dispensing systems to enhance patient care and increase performance. Automated medication storage and dispensing systems offer significant advantages over manual systems in the medical setting.
The application segment is divided into inventory management, drug storage and drug packaging and dispensing. The drug packaging and dispensing segment dominated the market, with a share of around 46.02% in 2022. End-users are decentralizing the drug packaging and dispensing function to make it available at the point of service as part of the shift towards greater efficiencies. The automated administration device offers incredibly high levels of task verification, accuracy, and efficiency of drug dispensing.
The end-users segment is divided into retail pharmacies, inpatient pharmacies, outpatient pharmacies and mail order pharmacies & pharmacy benefit management organizations. The inpatient pharmacies segment dominated the market, with a share of around 39.55% in 2022. The inpatient pharmacies install pharmacy automation devices for a more effective flow of medication and information throughout their operations.
| Attribute | Description |
|---|---|
| Market Size | Revenue (USD Billion) |
| Market size value in 2022 | USD 5.72 Billion |
| Market size value in 2032 | USD 11.60 Billion |
| CAGR (2023 to 2032) | 7.33% |
| Historical data | 2019-2021 |
| Base Year | 2022 |
| Forecast | 2023-2032 |
| Region | The regions analyzed for the market are Asia Pacific, Europe, South America, North America, and Middle East & Africa. Furthermore, the regions are further analyzed at the country level. |
| Segments | Product Type, Application and End-users |
As per The Brainy Insights, the size of the pharmacy automation devices market was valued USD 5.72 billion in 2022 to USD 11.60 billion by 2032.
Global pharmacy automation devices market is growing at a CAGR of 7.33% during the forecast period 2023-2032.
North America region emerged as the largest market for the pharmacy automation devices.
The market's growth will be influenced by the increasing demand of pharmacy automation devices in different end-user industries.
The high cost can hamper the market growth.
The increasing technological advancements is providing huge opportunities to the market.
1. Introduction
1.1. Objectives of the Study
1.2. Market Definition
1.3. Research Scope
1.4. Currency
1.5. Key Target Audience
2. Research Methodology and Assumptions
3. Executive Summary
4. Premium Insights
4.1. Porter’s Five Forces Analysis
4.2. Value Chain Analysis
4.3. Top Investment Pockets
4.3.1. Market Attractiveness Analysis by Product Type
4.3.2. Market Attractiveness Analysis by Application
4.3.3. Market Attractiveness Analysis by End-users
4.3.4. Market Attractiveness Analysis by Region
4.4. Industry Trends
5. Market Dynamics
5.1. Market Evaluation
5.2. Drivers
5.2.1. Increasing use of pharmacy automation devices in pharmacies
5.3. Restraints
5.3.1. High capital cost
5.4. Opportunities
5.4.1. Increasing technological advancements
5.5. Challenges
5.5.1. Stringent regulations
6. Global Pharmacy Automation Devices Market Analysis and Forecast, By Product Type
6.1. Segment Overview
6.2. Automated Medication Storage and Dispensing Systems
6.2.1. Automated Dispensing Cabinets
6.2.2. Robotic Automated Dispensing Systems
6.2.3. Carousels
6.3. Automated Tabletop Counters
6.4. Automated Labelling and Packaging Systems
6.5. Automated Medication Compounding Systems
6.6. Others
7. Global Pharmacy Automation Devices Market Analysis and Forecast, By Application
7.1. Segment Overview
7.2. Inventory Management
7.3. Drug Storage
7.4. Drug Packaging and Dispensing
8. Global Pharmacy Automation Devices Market Analysis and Forecast, By End-users
8.1. Segment Overview
8.2. Retail Pharmacies
8.3. Inpatient Pharmacies
8.4. Outpatient Pharmacies
8.5. Mail Order Pharmacies & Pharmacy Benefit Management Organizations
9. Global Pharmacy Automation Devices Market Analysis and Forecast, By Regional Analysis
9.1. Segment Overview
9.2. North America
9.2.1. U.S.
9.2.2. Canada
9.2.3. Mexico
9.3. Europe
9.3.1. Germany
9.3.2. France
9.3.3. U.K.
9.3.4. Italy
9.3.5. Spain
9.4. Asia-Pacific
9.4.1. Japan
9.4.2. China
9.4.3. India
9.5. South America
9.5.1. Brazil
9.6. Middle East and Africa
9.6.1. UAE
9.6.2. South Africa
10. Global Pharmacy Automation Devices Market-Competitive Landscape
10.1. Overview
10.2. Market Share of Key Players in the Pharmacy Automation Devices Market
10.2.1. Global Company Market Share
10.2.2. North America Company Market Share
10.2.3. Europe Company Market Share
10.2.4. APAC Company Market Share
10.3. Competitive Situations and Trends
10.3.1. Product Launches and Developments
10.3.2. Partnerships, Collaborations, and Agreements
10.3.3. Mergers & Acquisitions
10.3.4. Expansions
11. Company Profiles
11.1. Amerisource Bergen Corporation
11.1.1. Business Overview
11.1.2. Company Snapshot
11.1.3. Company Market Share Analysis
11.1.4. Company Product Portfolio
11.1.5. Recent Developments
11.1.6. SWOT Analysis
11.2. Healthcare Systems, Inc.
11.2.1. Business Overview
11.2.2. Company Snapshot
11.2.3. Company Market Share Analysis
11.2.4. Company Product Portfolio
11.2.5. Recent Developments
11.2.6. SWOT Analysis
11.3. Accu-Chart Plus
11.3.1. Business Overview
11.3.2. Company Snapshot
11.3.3. Company Market Share Analysis
11.3.4. Company Product Portfolio
11.3.5. Recent Developments
11.3.6. SWOT Analysis
11.4. Omnicell, Inc.
11.4.1. Business Overview
11.4.2. Company Snapshot
11.4.3. Company Market Share Analysis
11.4.4. Company Product Portfolio
11.4.5. Recent Developments
11.4.6. SWOT Analysis
11.5. Pearson Medical Technologies
11.5.1. Business Overview
11.5.2. Company Snapshot
11.5.3. Company Market Share Analysis
11.5.4. Company Product Portfolio
11.5.5. Recent Developments
11.5.6. SWOT Analysis
11.6. McKesson Corporation
11.6.1. Business Overview
11.6.2. Company Snapshot
11.6.3. Company Market Share Analysis
11.6.4. Company Product Portfolio
11.6.5. Recent Developments
11.6.6. SWOT Analysis
11.7. Baxter
11.7.1. Business Overview
11.7.2. Company Snapshot
11.7.3. Company Market Share Analysis
11.7.4. Company Product Portfolio
11.7.5. Recent Developments
11.7.6. SWOT Analysis
11.8. Talyst, LLC
11.8.1. Business Overview
11.8.2. Company Snapshot
11.8.3. Company Market Share Analysis
11.8.4. Company Product Portfolio
11.8.5. Recent Developments
11.8.6. SWOT Analysis
11.9. Fulcrum Pharmacy Management, Inc.
11.9.1. Business Overview
11.9.2. Company Snapshot
11.9.3. Company Market Share Analysis
11.9.4. Company Product Portfolio
11.9.5. Recent Developments
11.9.6. SWOT Analysis
11.10. Scriptpro LLC
11.10.1. Business Overview
11.10.2. Company Snapshot
11.10.3. Company Market Share Analysis
11.10.4. Company Product Portfolio
11.10.5. Recent Developments
11.10.6. SWOT Analysis
11.11. Health Robotics S.R.L.
11.11.1. Business Overview
11.11.2. Company Snapshot
11.11.3. Company Market Share Analysis
11.11.4. Company Product Portfolio
11.11.5. Recent Developments
11.11.6. SWOT Analysis
11.12. Aesynt, Inc
11.12.1. Business Overview
11.12.2. Company Snapshot
11.12.3. Company Market Share Analysis
11.12.4. Company Product Portfolio
11.12.5. Recent Developments
11.12.6. SWOT Analysis
11.13. Medacist Solutions Group, LLC
11.13.1. Business Overview
11.13.2. Company Snapshot
11.13.3. Company Market Share Analysis
11.13.4. Company Product Portfolio
11.13.5. Recent Developments
11.13.6. SWOT Analysis
11.14. Pyxis Corporation
11.14.1. Business Overview
11.14.2. Company Snapshot
11.14.3. Company Market Share Analysis
11.14.4. Company Product Portfolio
11.14.5. Recent Developments
11.14.6. SWOT Analysis
11.15. Cerner Oracle
11.15.1. Business Overview
11.15.2. Company Snapshot
11.15.3. Company Market Share Analysis
11.15.4. Company Product Portfolio
11.15.5. Recent Developments
11.15.6. SWOT Analysis
11.16. Kirby Lester
11.16.1. Business Overview
11.16.2. Company Snapshot
11.16.3. Company Market Share Analysis
11.16.4. Company Product Portfolio
11.16.5. Recent Developments
11.16.6. SWOT Analysis
11.17. Forhealth Technologies iA
11.17.1. Business Overview
11.17.2. Company Snapshot
11.17.3. Company Market Share Analysis
11.17.4. Company Product Portfolio
11.17.5. Recent Developments
11.17.6. SWOT Analysis
11.18. Touchpoint Medical
11.18.1. Business Overview
11.18.2. Company Snapshot
11.18.3. Company Market Share Analysis
11.18.4. Company Product Portfolio
11.18.5. Recent Developments
11.18.6. SWOT Analysis
11.19. ARxIUM
11.19.1. Business Overview
11.19.2. Company Snapshot
11.19.3. Company Market Share Analysis
11.19.4. Company Product Portfolio
11.19.5. Recent Developments
11.19.6. SWOT Analysis
11.20. Deenova S.R.L Parata Systems, LLC
11.20.1. Business Overview
11.20.2. Company Snapshot
11.20.3. Company Market Share Analysis
11.20.4. Company Product Portfolio
11.20.5. Recent Developments
11.20.6. SWOT Analysis
11.21. Yuyama Co. Ltd.
11.21.1. Business Overview
11.21.2. Company Snapshot
11.21.3. Company Market Share Analysis
11.21.4. Company Product Portfolio
11.21.5. Recent Developments
11.21.6. SWOT Analysis
11.22. Swisslog Healthcare
11.22.1. Business Overview
11.22.2. Company Snapshot
11.22.3. Company Market Share Analysis
11.22.4. Company Product Portfolio
11.22.5. Recent Developments
11.22.6. SWOT Analysis
11.23. CareFusion
11.23.1. Business Overview
11.23.2. Company Snapshot
11.23.3. Company Market Share Analysis
11.23.4. Company Product Portfolio
11.23.5. Recent Developments
11.23.6. SWOT Analysis
List of Table
1. Global Pharmacy Automation Devices Market, By Product Type, 2019-2032 (USD Billion)
2. Global Automated Medication Storage and Dispensing Systems, Pharmacy Automation Devices Market, By Region, 2019-2032 (USD Billion)
3. Global Automated Tabletop Counters, Pharmacy Automation Devices Market, By Region, 2019-2032 (USD Billion)
4. Global Automated Labelling and Packaging Systems, Pharmacy Automation Devices Market, By Region, 2019-2032 (USD Billion)
5. Global Automated Medication Compounding Systems, Pharmacy Automation Devices Market, By Region, 2019-2032 (USD Billion)
6. Global Others, Pharmacy Automation Devices Market, By Region, 2019-2032 (USD Billion)
7. Global Pharmacy Automation Devices Market, By Application, 2019-2032 (USD Billion)
8. Global Inventory Management, Pharmacy Automation Devices Market, By Region, 2019-2032 (USD Billion)
9. Global Drug Storage, Pharmacy Automation Devices Market, By Region, 2019-2032 (USD Billion)
10. Global Drug Packaging and Dispensing, Pharmacy Automation Devices Market, By Region, 2019-2032 (USD Billion)
11. Global Pharmacy Automation Devices Market, By End-user, 2019-2032 (USD Billion)
12. Global Retail Pharmacies, Pharmacy Automation Devices Market, By Region, 2019-2032 (USD Billion)
13. Global Inpatient Pharmacies, Pharmacy Automation Devices Market, By Region, 2019-2032 (USD Billion)
14. Global Outpatient Pharmacies, Pharmacy Automation Devices Market, By Region, 2019-2032 (USD Billion)
15. Global Mail Order Pharmacies & Pharmacy Benefit Management Organizations, Pharmacy Automation Devices Market, By Region, 2019-2032 (USD Billion)
16. Global Pharmacy Automation Devices Market, By Region, 2019-2032 (USD Billion)
17. North America Pharmacy Automation Devices Market, By Product Type, 2019-2032 (USD Billion)
18. North America Pharmacy Automation Devices Market, By Application, 2019-2032 (USD Billion)
19. North America Pharmacy Automation Devices Market, By End-user, 2019-2032 (USD Billion)
20. U.S. Pharmacy Automation Devices Market, By Product Type, 2019-2032 (USD Billion)
21. U.S. Pharmacy Automation Devices Market, By Application, 2019-2032 (USD Billion)
22. U.S. Pharmacy Automation Devices Market, By End-user, 2019-2032 (USD Billion)
23. Canada Pharmacy Automation Devices Market, By Product Type, 2019-2032 (USD Billion)
24. Canada Pharmacy Automation Devices Market, By Application, 2019-2032 (USD Billion)
25. Canada Pharmacy Automation Devices Market, By End-user, 2019-2032 (USD Billion)
26. Mexico Pharmacy Automation Devices Market, By Product Type, 2019-2032 (USD Billion)
27. Mexico Pharmacy Automation Devices Market, By Application, 2019-2032 (USD Billion)
28. Mexico Pharmacy Automation Devices Market, By End-user, 2019-2032 (USD Billion)
29. Europe Pharmacy Automation Devices Market, By Product Type, 2019-2032 (USD Billion)
30. Europe Pharmacy Automation Devices Market, By Application, 2019-2032 (USD Billion)
31. Europe Pharmacy Automation Devices Market, By End-user, 2019-2032 (USD Billion)
32. Germany Pharmacy Automation Devices Market, By Product Type, 2019-2032 (USD Billion)
33. Germany Pharmacy Automation Devices Market, By Application, 2019-2032 (USD Billion)
34. Germany Pharmacy Automation Devices Market, By End-user, 2019-2032 (USD Billion)
35. France Pharmacy Automation Devices Market, By Product Type, 2019-2032 (USD Billion)
36. France Pharmacy Automation Devices Market, By Application, 2019-2032 (USD Billion)
37. France Pharmacy Automation Devices Market, By End-user, 2019-2032 (USD Billion)
38. U.K. Pharmacy Automation Devices Market, By Product Type, 2019-2032 (USD Billion)
39. U.K. Pharmacy Automation Devices Market, By Application, 2019-2032 (USD Billion)
40. U.K. Pharmacy Automation Devices Market, By End-user, 2019-2032 (USD Billion)
41. Italy Pharmacy Automation Devices Market, By Product Type, 2019-2032 (USD Billion)
42. Italy Pharmacy Automation Devices Market, By Application, 2019-2032 (USD Billion)
43. Italy Pharmacy Automation Devices Market, By End-user, 2019-2032 (USD Billion)
44. Spain Pharmacy Automation Devices Market, By Product Type, 2019-2032 (USD Billion)
45. Spain Pharmacy Automation Devices Market, By Application, 2019-2032 (USD Billion)
46. Spain Pharmacy Automation Devices Market, By End-user, 2019-2032 (USD Billion)
47. Asia Pacific Pharmacy Automation Devices Market, By Product Type, 2019-2032 (USD Billion)
48. Asia Pacific Pharmacy Automation Devices Market, By Application, 2019-2032 (USD Billion)
49. Asia Pacific Pharmacy Automation Devices Market, By End-user, 2019-2032 (USD Billion)
50. Japan Pharmacy Automation Devices Market, By Product Type, 2019-2032 (USD Billion)
51. Japan Pharmacy Automation Devices Market, By Application, 2019-2032 (USD Billion)
52. Japan Pharmacy Automation Devices Market, By End-user, 2019-2032 (USD Billion)
53. China Pharmacy Automation Devices Market, By Product Type, 2019-2032 (USD Billion)
54. China Pharmacy Automation Devices Market, By Application, 2019-2032 (USD Billion)
55. China Pharmacy Automation Devices Market, By End-user, 2019-2032 (USD Billion)
56. India Pharmacy Automation Devices Market, By Product Type, 2019-2032 (USD Billion)
57. India Pharmacy Automation Devices Market, By Application, 2019-2032 (USD Billion)
58. India Pharmacy Automation Devices Market, By End-user, 2019-2032 (USD Billion)
59. South America Pharmacy Automation Devices Market, By Product Type, 2019-2032 (USD Billion)
60. South America Pharmacy Automation Devices Market, By Application, 2019-2032 (USD Billion)
61. South America Pharmacy Automation Devices Market, By End-user, 2019-2032 (USD Billion)
62. Brazil Pharmacy Automation Devices Market, By Product Type, 2019-2032 (USD Billion)
63. Brazil Pharmacy Automation Devices Market, By Application, 2019-2032 (USD Billion)
64. Brazil Pharmacy Automation Devices Market, By End-user, 2019-2032 (USD Billion)
65. Middle East and Africa Pharmacy Automation Devices Market, By Product Type, 2019-2032 (USD Billion)
66. Middle East and Africa Pharmacy Automation Devices Market, By Application, 2019-2032 (USD Billion)
67. Middle East and Africa Pharmacy Automation Devices Market, By End-user, 2019-2032 (USD Billion)
68. UAE Pharmacy Automation Devices Market, By Product Type, 2019-2032 (USD Billion)
69. UAE Pharmacy Automation Devices Market, By Application, 2019-2032 (USD Billion)
70. UAE Pharmacy Automation Devices Market, By End-user, 2019-2032 (USD Billion)
71. South Africa Pharmacy Automation Devices Market, By Product Type, 2019-2032 (USD Billion)
72. South Africa Pharmacy Automation Devices Market, By Application, 2019-2032 (USD Billion)
73. South Africa Pharmacy Automation Devices Market, By End-user, 2019-2032 (USD Billion)
List of Figures
1. Global Pharmacy Automation Devices Market Segmentation
2. Pharmacy Automation Devices Market: Research Methodology
3. Market Size Estimation Methodology: Bottom-Up Approach
4. Market Size Estimation Methodology: Top-Down Approach
5. Data Triangulation
6. Porter’s Five Forces Analysis
7. Value Chain Analysis
8. Global Pharmacy Automation Devices Market Attractiveness Analysis by Product Type
9. Global Pharmacy Automation Devices Market Attractiveness Analysis by Application
10. Global Pharmacy Automation Devices Market Attractiveness Analysis by End-user
11. Global Pharmacy Automation Devices Market Attractiveness Analysis by Region
12. Global Pharmacy Automation Devices Market: Dynamics
13. Global Pharmacy Automation Devices Market Share by Product Type (2022 & 2032)
14. Global Pharmacy Automation Devices Market Share by Application (2022 & 2032)
15. Global Pharmacy Automation Devices Market Share by End-user (2022 & 2032)
16. Global Pharmacy Automation Devices Market Share by Regions (2022 & 2032)
17. Global Pharmacy Automation Devices Market Share by Company (2022)
This study forecasts revenue at global, regional, and country levels from 2019 to 2032. The Brainy Insights has segmented the global pharmacy automation devices market based on below mentioned segments:
Global Pharmacy Automation Devices Market by Product Type:
Global Pharmacy Automation Devices Market by Application:
Global Pharmacy Automation Devices Market by End-users:
Global Pharmacy Automation Devices Market by Region:
Research has its special purpose to undertake marketing efficiently. In this competitive scenario, businesses need information across all industry verticals; the information about customer wants, market demand, competition, industry trends, distribution channels etc. This information needs to be updated regularly because businesses operate in a dynamic environment. Our organization, The Brainy Insights incorporates scientific and systematic research procedures in order to get proper market insights and industry analysis for overall business success. The analysis consists of studying the market from a miniscule level wherein we implement statistical tools which helps us in examining the data with accuracy and precision.
Our research reports feature both; quantitative and qualitative aspects for any market. Qualitative information for any market research process are fundamental because they reveal the customer needs and wants, usage and consumption for any product/service related to a specific industry. This in turn aids the marketers/investors in knowing certain perceptions of the customers. Qualitative research can enlighten about the different product concepts and designs along with unique service offering that in turn, helps define marketing problems and generate opportunities. On the other hand, quantitative research engages with the data collection process through interviews, e-mail interactions, surveys and pilot studies. Quantitative aspects for the market research are useful to validate the hypotheses generated during qualitative research method, explore empirical patterns in the data with the help of statistical tools, and finally make the market estimations.
The Brainy Insights offers comprehensive research and analysis, based on a wide assortment of factual insights gained through interviews with CXOs and global experts and secondary data from reliable sources. Our analysts and industry specialist assume vital roles in building up statistical tools and analysis models, which are used to analyse the data and arrive at accurate insights with exceedingly informative research discoveries. The data provided by our organization have proven precious to a diverse range of companies, facilitating them to address issues such as determining which products/services are the most appealing, whether or not customers use the product in the manner anticipated, the purchasing intentions of the market and many others.
Our research methodology encompasses an idyllic combination of primary and secondary initiatives. Key phases involved in this process are listed below:

The phase involves the gathering and collecting of market data and its related information with the help of different sources & research procedures.

The data procurement stage involves in data gathering and collecting through various data sources.
This stage involves in extensive research. These data sources includes:
Purchased Database: Purchased databases play a crucial role in estimating the market sizes irrespective of the domain. Our purchased database includes:
Primary Research: The Brainy Insights interacts with leading companies and experts of the concerned domain to develop the analyst team’s market understanding and expertise. It improves and substantiates every single data presented in the market reports. Primary research mainly involves in telephonic interviews, E-mail interactions and face-to-face interviews with the raw material providers, manufacturers/producers, distributors, & independent consultants. The interviews that we conduct provides valuable data on market size and industry growth trends prevailing in the market. Our organization also conducts surveys with the various industry experts in order to gain overall insights of the industry/market. For instance, in healthcare industry we conduct surveys with the pharmacists, doctors, surgeons and nurses in order to gain insights and key information of a medical product/device/equipment which the customers are going to usage. Surveys are conducted in the form of questionnaire designed by our own analyst team. Surveys plays an important role in primary research because surveys helps us to identify the key target audiences of the market. Additionally, surveys helps to identify the key target audience engaged with the market. Our survey team conducts the survey by targeting the key audience, thus gaining insights from them. Based on the perspectives of the customers, this information is utilized to formulate market strategies. Moreover, market surveys helps us to understand the current competitive situation of the industry. To be precise, our survey process typically involve with the 360 analysis of the market. This analytical process begins by identifying the prospective customers for a product or service related to the market/industry to obtain data on how a product/service could fit into customers’ lives.

Secondary Research: The secondary data sources includes information published by the on-profit organizations such as World bank, WHO, company fillings, investor presentations, annual reports, national government documents, statistical databases, blogs, articles, white papers and others. From the annual report, we analyse a company’s revenue to understand the key segment and market share of that organization in a particular region. We analyse the company websites and adopt the product mapping technique which is important for deriving the segment revenue. In the product mapping method, we select and categorize the products offered by the companies catering to domain specific market, deduce the product revenue for each of the companies so as to get overall estimation of the market size. We also source data and analyses trends based on information received from supply side and demand side intermediaries in the value chain. The supply side denotes the data gathered from supplier, distributor, wholesaler and the demand side illustrates the data gathered from the end customers for respective market domain.

The supply side for a domain specific market is analysed by:
The demand side for the market is estimated through:
In-house Library: Apart from these third-party sources, we have our in-house library of qualitative and quantitative information. Our in-house database includes market data for various industry and domains. These data are updated on regular basis as per the changing market scenario. Our library includes, historic databases, internal audit reports and archives.
Sometimes there are instances where there is no metadata or raw data available for any domain specific market. For those cases, we use our expertise to forecast and estimate the market size in order to generate comprehensive data sets. Our analyst team adopt a robust research technique in order to produce the estimates:
Data Synthesis: This stage involves the analysis & mapping of all the information obtained from the previous step. It also involves in scrutinizing the data for any discrepancy observed while data gathering related to the market. The data is collected with consideration to the heterogeneity of sources. Robust scientific techniques are in place for synthesizing disparate data sets and provide the essential contextual information that can orient market strategies. The Brainy Insights has extensive experience in data synthesis where the data passes through various stages:


Market Deduction & Formulation: The final stage comprises of assigning data points at appropriate market spaces so as to deduce feasible conclusions. Analyst perspective & subject matter expert based holistic form of market sizing coupled with industry analysis also plays a crucial role in this stage.
This stage involves in finalization of the market size and numbers that we have collected from data integration step. With data interpolation, it is made sure that there is no gap in the market data. Successful trend analysis is done by our analysts using extrapolation techniques, which provide the best possible forecasts for the market.
Data Validation & Market Feedback: Validation is the most important step in the process. Validation & re-validation via an intricately designed process helps us finalize data-points to be used for final calculations.

The Brainy Insights interacts with leading companies and experts of the concerned domain to develop the analyst team’s market understanding and expertise. It improves and substantiates every single data presented in the market reports. The data validation interview and discussion panels are typically composed of the most experienced industry members. The participants include, however, are not limited to:
Moreover, we always validate our data and findings through primary respondents from all the major regions we are working on.


Free Customization
Fortune 500 Clients
Free Yearly Update On Purchase Of Multi/Corporate License
Companies Served Till Date