- +1-315-215-1633
- sales@thebrainyinsights.com

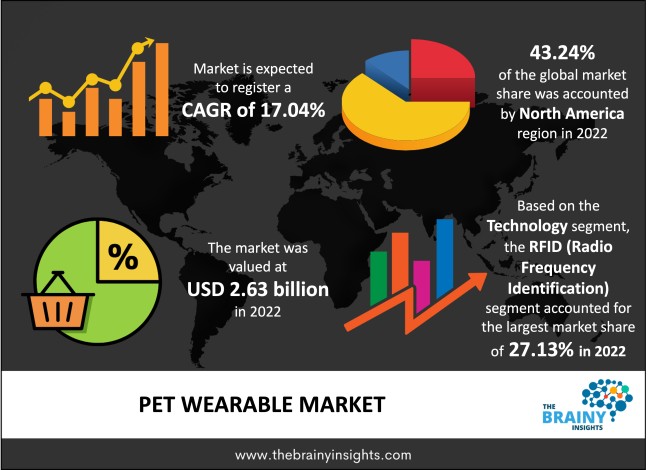
The global pet wearable market was valued at USD 2.63 billion in 2022, increasing at a CAGR of 17.04% from 2023 to 2032 and anticipated to reach USD 12.70 billion by 2032. Asia Pacific is expected to grow the fastest during the forecast period. Also, the rising trend of pet humanization, coupled with the growing concerns among pet parents about the well-being of their pets, is expected to drive market growth during the forecast period.
Pet wearables are electronic gadgets that can be scaled on a pet's body to aid in identification, medical diagnosis, monitoring, tracking, controlling, treatment, facilitation, safety, and security, among other things. These wearables are manufactured utilizing advanced technologies, like radio-frequency identification (RFID), a global positioning system (GPS) trackers, internet of things (IoT), cameras, Bluetooth sensors, transmitters and antennas, to ensure the safety of the pets. Provider of wearable global positioning system (GPS)-based pet tracking instruments. Pet wearables allow pet owners to discover their pet's GPS location in real-time, utilizing the application.
Get an overview of this study by requesting a free sample
For example, in June 2022, a 360-degree Dog camera was launched by Furbo, offering different attributes for pets such as auto dog tracking, coloured night-vision, and a broad-angle lens handled via an app.
The rising trend of pet ownership: The easy availability of wearable devices, the rising awareness of consumers, along with the growing concerns about pet health & well-being are also helping to drive the market growth. However, the advancements in wireless area networks, cost-effective & efficient wireless sensors, the adoption of digital maps, and the development of mobile applications are expected to drive the market growth. Additionally, pet humanization is driving the sales of pet wearables globally. Pet humanization has become a trend in the industry due to the desire of pet owners to provide their pets with more human-like experiences and products. However, the growing demand for GPS (global positioning system)-based pet wearable gadgets that track pet activity while maintaining protection, raised real-time positioning, smartphone adoption, and an expanding mapping stimulated the market growth over the forecast period.
Compliance with stringent government regulations: Compliance with stringent government regulations is the restraining factor of market growth. Moreover, the pet wearable machines perform different tasks while being operated. These tasks consume a significant amount of power. Another key factor restraining the adoption & demand for pet wearable gadgets is their high-power consumption.
The increasing investments in research and development (R&D) activities: The rising investments in research and development (R&D) activities are an opportunity factor for market growth. Moreover, the growing demand from working people for pet surveillance, the high penetration of pet fitness & activity monitoring machines & the easy availability of progressive technology-based devices to watch pet health by collecting vital information propels the market growth over the forecast period. However, the technological advancements that can help with the information on remote finding & medical requirements are increasing the popularity of pet wearables and are helping to boost the market growth over the forecast period.
The regions analyzed for the market include Europe, South America, Asia Pacific, North America, the Middle East, and Africa. North America emerged as the largest global pet wearable market, with a 43.24% market revenue share in 2022. North America dominates the pet wearable market due to the rising awareness about animal health & wellness issues. Moreover, an increase in consumer spending capacity, rising per capita income, and the exponential demand for pet wearables from developing countries are expected to propel the market growth over the forecast period in this region. Additionally, the increasing adoption of GPS collars with activity and fitness monitoring devices and the availability of advanced infrastructure is helping drive market growth in this region. Asia Pacific is expected to grow the fastest during the forecast period due to the increasing expenditure of people on travel and leisure across the province. Further, the rising incidence of chronic diseases due to unhealthy lifestyles adopted by pets also drives demand from a clinical standpoint across this region. However, increasing adoption and awareness of technologies and many cattle breeding and heat detection devices are expected to propel the market growth in this region.
North America Region Pet Wearable Market Share in 2022 - 43.24%
www.thebrainyinsights.com
Check the geographical analysis of this market by requesting a free sample
The technology segment is divided into GPS (global positioning system), RFID (radio frequency identification), bluetooth, sensors, and others. The RFID (radio frequency identification) segment dominated, with a market share of around 27.13% in 2022. This growth is attributed to the rising requirement for an accurate data unit, especially in warehouse acts. The radio frequency identification trackers help monitor health parameters, such as heart rate variability, body temperature, calorie intake, and pulse.
The product segment is divided into the smart harness, smart camera, smart vest, smart collar, and others. In 2022, the smart collar segment dominated the market with 29.14% and a revenue of USD 0.76 billion. This growth is attributed to the increasing adoption of pets. Additionally, the expansion of e-commerce, along with consumer preference changes, is also helping to boost the segment's market growth. Additionally, the smart pet collar is a device that connects with a smartphone via Bluetooth or Wi-Fi and provides details about the animal, such as its training routine, whereabouts, and other things. Further, by 2032, the smart camera segment will likely dominate the market due to the ever-increasing customer demand for sophisticated technology to safeguard the well-being and safety of pets.
The application segment is divided into behaviour monitoring & control, identification & tracking, medical diagnosis & treatment, and others. In 2022, the identification & tracking segment dominated the market with 36.15% and a revenue of USD 0.95 billion. This growth is attributed to the increasing awareness regarding the availability of devices & technologies to identify and track cattle without the requirement for the unpleasant tagging of animals. Further, by 2032, the medical diagnosis & treatment segment will likely dominate the market due to the increasing focus on developing technologically progressive medical devices.
| Attribute | Description |
|---|---|
| Market Size | Revenue (USD Billion) |
| Market size value in 2022 | USD 2.63 Billion |
| Market size value in 2032 | USD 12.70 Billion |
| CAGR (2023 to 2032) | 17.04% |
| Historical data | 2019-2021 |
| Base Year | 2022 |
| Forecast | 2023-2032 |
| Regional Segments | The key regions are North America, South America, Europe, Asia Pacific, and Middle East & Africa. |
| Segments | Key Segments are technology, product, application, and regions |
North America region emerged as the largest market for pet wearable.
The market's growth will be influenced by the increasing awareness concerning animal health across the globe.
A lack of public awareness could hamper the market growth.
The increasing investments in research and development (R&D) activities will provide huge opportunities to the market.
1. Introduction
1.1. Objectives of the Study
1.2. Market Definition
1.3. Research Scope
1.4. Currency
1.5. Key Target Audience
2. Research Methodology and Assumptions
3. Executive Summary
4. Premium Insights
4.1. Porter’s Five Forces Analysis
4.2. Value Chain Analysis
4.3. Top Investment Pockets
4.3.1. Market Attractiveness Analysis By Technology
4.3.2. Market Attractiveness Analysis By Product
4.3.3. Market Attractiveness Analysis By Application
4.3.4. Market Attractiveness Analysis By Region
4.4. Industry Trends
5. Market Dynamics
5.1. Market Evaluation
5.2. Drivers
5.2.1. The increasing awareness about animal health & wellness
5.2.2. The increasing disposable income among middle-class population groups
5.2.3. The increasing trend of pet ownership
5.3. Restraints
5.3.1. The compliance with stringent government regulations
5.3.2. A lack of public awareness
5.4. Opportunities
5.4.1. The expanding IoT adoption
5.4.2. The increasing investments in research and development (R&D) activities
6. Global Pet Wearable Market Analysis and Forecast, By Technology
6.1. Segment Overview
6.2. GPS (Global Positioning System)
6.3. RFID (Radio Frequency Identification)
6.4. Bluetooth
6.5. Sensors
6.6. Others
7. Global Pet Wearable Market Analysis and Forecast, By Product
7.1. Segment Overview
7.2. Smart Harness
7.3. Smart Camera
7.4. Smart Vest
7.5. Smart Collar
7.6. Others
8. Global Pet Wearable Market Analysis and Forecast, By Application
8.1. Segment Overview
8.2. Behaviour Monitoring & Control
8.3. Identification & Tracking
8.4. Medical Diagnosis & Treatment
8.5. Others
9. Global Pet Wearable Market Analysis and Forecast, By Regional Analysis
9.1. Segment Overview
9.2. North America
9.2.1. U.S.
9.2.2. Canada
9.2.3. Mexico
9.3. Europe
9.3.1. Germany
9.3.2. France
9.3.3. U.K.
9.3.4. Italy
9.3.5. Spain
9.4. Asia-Pacific
9.4.1. Japan
9.4.2. China
9.4.3. India
9.5. South America
9.5.1. Brazil
9.6. Middle East and Africa
9.6.1. UAE
9.6.2. South Africa
10. Global Pet Wearable Market-Competitive Landscape
10.1. Overview
10.2. Market Share of Key Players in Global Pet Wearable Market
10.2.1. Global Company Market Share
10.2.2. North America Company Market Share
10.2.3. Europe Company Market Share
10.2.4. APAC Company Market Share
10.3. Competitive Situations and Trends
10.3.1. Product Launches and Developments
10.3.2. Partnerships, Collaborations, and Agreements
10.3.3. Mergers & Acquisitions
10.3.4. Expansions
11. Company Profiles
11.1. Allflex USA Inc
11.1.1. Business Overview
11.1.2. Company Snapshot
11.1.3. Company Market Share Analysis
11.1.4. Company Product Portfolio
11.1.5. Recent Developments
11.1.6. SWOT Analysis
11.2. Avid Identification Systems, Inc.
11.2.1. Business Overview
11.2.2. Company Snapshot
11.2.3. Company Market Share Analysis
11.2.4. Company Product Portfolio
11.2.5. Recent Developments
11.2.6. SWOT Analysis
11.3. Invisible Fence
11.3.1. Business Overview
11.3.2. Company Snapshot
11.3.3. Company Market Share Analysis
11.3.4. Company Product Portfolio
11.3.5. Recent Developments
11.3.6. SWOT Analysis
11.4. Whistle Labs, Inc.
11.4.1. Business Overview
11.4.2. Company Snapshot
11.4.3. Company Market Share Analysis
11.4.4. Company Product Portfolio
11.4.5. Recent Developments
11.4.6. SWOT Analysis
11.5. Datamars
11.5.1. Business Overview
11.5.2. Company Snapshot
11.5.3. Company Market Share Analysis
11.5.4. Company Product Portfolio
11.5.5. Recent Developments
11.5.6. SWOT Analysis
11.6. GoPro
11.6.1. Business Overview
11.6.2. Company Snapshot
11.6.3. Company Market Share Analysis
11.6.4. Company Product Portfolio
11.6.5. Recent Developments
11.6.6. SWOT Analysis
11.7. Tractive
11.7.1. Business Overview
11.7.2. Company Snapshot
11.7.3. Company Market Share Analysis
11.7.4. Company Product Portfolio
11.7.5. Recent Developments
11.7.6. SWOT Analysis
11.8. IceRobotics
11.8.1. Business Overview
11.8.2. Company Snapshot
11.8.3. Company Market Share Analysis
11.8.4. Company Product Portfolio
11.8.5. Recent Developments
11.8.6. SWOT Analysis
11.9. Garmin Ltd.
11.9.1. Business Overview
11.9.2. Company Snapshot
11.9.3. Company Market Share Analysis
11.9.4. Company Product Portfolio
11.9.5. Recent Developments
11.9.6. SWOT Analysis
11.10. Pet Vu, Inc.
11.10.1. Business Overview
11.10.2. Company Snapshot
11.10.3. Company Market Share Analysis
11.10.4. Company Product Portfolio
11.10.5. Recent Developments
11.10.6. SWOT Analysis
11.11. KYON
11.11.1. Business Overview
11.11.2. Company Snapshot
11.11.3. Company Market Share Analysis
11.11.4. Company Product Portfolio
11.11.5. Recent Developments
11.11.6. SWOT Analysis
11.12. FitBark
11.12.1. Business Overview
11.12.2. Company Snapshot
11.12.3. Company Market Share Analysis
11.12.4. Company Product Portfolio
11.12.5. Recent Developments
11.12.6. SWOT Analysis
11.13. Voyce
11.13.1. Business Overview
11.13.2. Company Snapshot
11.13.3. Company Market Share Analysis
11.13.4. Company Product Portfolio
11.13.5. Recent Developments
11.13.6. SWOT Analysis
11.14. Dropcam
11.14.1. Business Overview
11.14.2. Company Snapshot
11.14.3. Company Market Share Analysis
11.14.4. Company Product Portfolio
11.14.5. Recent Developments
11.14.6. SWOT Analysis
11.15. Nedap
11.15.1. Business Overview
11.15.2. Company Snapshot
11.15.3. Company Market Share Analysis
11.15.4. Company Product Portfolio
11.15.5. Recent Developments
11.15.6. SWOT Analysis
11.16. Silent Herdsman Limited
11.16.1. Business Overview
11.16.2. Company Snapshot
11.16.3. Company Market Share Analysis
11.16.4. Company Product Portfolio
11.16.5. Recent Developments
11.16.6. SWOT Analysis
List of Table
1. Global Pet Wearable Market, By Technology, 2019-2032 (USD Billion)
2. Global GPS (Global Positioning System), Pet Wearable Market, By Region, 2019-2032 (USD Billion)
3. Global RFID (Radio Frequency Identification), Pet Wearable Market, By Region, 2019-2032 (USD Billion)
4. Global Bluetooth, Pet Wearable Market, By Region, 2019-2032 (USD Billion)
5. Global Sensors, Pet Wearable Market, By Region, 2019-2032 (USD Billion)
6. Global Others, Pet Wearable Market, By Region, 2019-2032 (USD Billion)
7. Global Pet Wearable Market, By Product, 2019-2032 (USD Billion)
8. Global Smart Harness, Pet Wearable Market, By Region, 2019-2032 (USD Billion)
9. Global Smart Camera, Pet Wearable Market, By Region, 2019-2032 (USD Billion)
10. Global Smart Vest, Pet Wearable Market, By Region, 2019-2032 (USD Billion)
11. Global Smart Collar, Pet Wearable Market, By Region, 2019-2032 (USD Billion)
12. Global Others, Pet Wearable Market, By Region, 2019-2032 (USD Billion)
13. Global Pet Wearable Market, By Application, 2019-2032 (USD Billion)
14. Global Behaviour Monitoring & Control, Pet Wearable Market, By Region, 2019-2032 (USD Billion)
15. Global Identification & Tracking, Pet Wearable Market, By Region, 2019-2032 (USD Billion)
16. Global Medical Diagnosis & Treatment, Pet Wearable Market, By Region, 2019-2032 (USD Billion)
17. Global Others, Pet Wearable Market, By Region, 2019-2032 (USD Billion)
18. North America Pet Wearable Market, By Technology, 2019-2032 (USD Billion)
19. North America Pet Wearable Market, By Product, 2019-2032 (USD Billion)
20. North America Pet Wearable Market, By Application, 2019-2032 (USD Billion)
21. U.S. Pet Wearable Market, By Technology, 2019-2032 (USD Billion)
22. U.S. Pet Wearable Market, By Product, 2019-2032 (USD Billion)
23. U.S. Pet Wearable Market, By Application, 2019-2032 (USD Billion)
24. Canada Pet Wearable Market, By Technology, 2019-2032 (USD Billion)
25. Canada Pet Wearable Market, By Product, 2019-2032 (USD Billion)
26. Canada Pet Wearable Market, By Application, 2019-2032 (USD Billion)
27. Mexico Pet Wearable Market, By Technology, 2019-2032 (USD Billion)
28. Mexico Pet Wearable Market, By Product, 2019-2032 (USD Billion)
29. Mexico Pet Wearable Market, By Application, 2019-2032 (USD Billion)
30. Europe Pet Wearable Market, By Technology, 2019-2032 (USD Billion)
31. Europe Pet Wearable Market, By Product, 2019-2032 (USD Billion)
32. Europe Pet Wearable Market, By Application, 2019-2032 (USD Billion)
33. Germany Pet Wearable Market, By Technology, 2019-2032 (USD Billion)
34. Germany Pet Wearable Market, By Product, 2019-2032 (USD Billion)
35. Germany Pet Wearable Market, By Application, 2019-2032 (USD Billion)
36. France Pet Wearable Market, By Technology, 2019-2032 (USD Billion)
37. France Pet Wearable Market, By Product, 2019-2032 (USD Billion)
38. France Pet Wearable Market, By Application, 2019-2032 (USD Billion)
39. U.K. Pet Wearable Market, By Technology, 2019-2032 (USD Billion)
40. U.K. Pet Wearable Market, By Product, 2019-2032 (USD Billion)
41. U.K. Pet Wearable Market, By Application, 2019-2032 (USD Billion)
42. Italy Pet Wearable Market, By Technology, 2019-2032 (USD Billion)
43. Italy Pet Wearable Market, By Product, 2019-2032 (USD Billion)
44. Italy Pet Wearable Market, By Application, 2019-2032 (USD Billion)
45. Spain Pet Wearable Market, By Technology, 2019-2032 (USD Billion)
46. Spain Pet Wearable Market, By Product, 2019-2032 (USD Billion)
47. Spain Pet Wearable Market, By Application, 2019-2032 (USD Billion)
48. Asia Pacific Pet Wearable Market, By Technology, 2019-2032 (USD Billion)
49. Asia Pacific Pet Wearable Market, By Product, 2019-2032 (USD Billion)
50. Asia Pacific Pet Wearable Market, By Application, 2019-2032 (USD Billion)
51. Japan Pet Wearable Market, By Technology, 2019-2032 (USD Billion)
52. Japan Pet Wearable Market, By Product, 2019-2032 (USD Billion)
53. Japan Pet Wearable Market, By Application, 2019-2032 (USD Billion)
54. China Pet Wearable Market, By Technology, 2019-2032 (USD Billion)
55. China Pet Wearable Market, By Product, 2019-2032 (USD Billion)
56. China Pet Wearable Market, By Application, 2019-2032 (USD Billion)
57. India Pet Wearable Market, By Technology, 2019-2032 (USD Billion)
58. India Pet Wearable Market, By Product, 2019-2032 (USD Billion)
59. India Pet Wearable Market, By Application, 2019-2032 (USD Billion)
60. South America Pet Wearable Market, By Technology, 2019-2032 (USD Billion)
61. South America Pet Wearable Market, By Product, 2019-2032 (USD Billion)
62. South America Pet Wearable Market, By Application, 2019-2032 (USD Billion)
63. Brazil Pet Wearable Market, By Technology, 2019-2032 (USD Billion)
64. Brazil Pet Wearable Market, By Product, 2019-2032 (USD Billion)
65. Brazil Pet Wearable Market, By Application, 2019-2032 (USD Billion)
66. Middle East and Africa Pet Wearable Market, By Technology, 2019-2032 (USD Billion)
67. Middle East and Africa Pet Wearable Market, By Product, 2019-2032 (USD Billion)
68. Middle East and Africa Pet Wearable Market, By Application, 2019-2032 (USD Billion)
69. UAE Pet Wearable Market, By Technology, 2019-2032 (USD Billion)
70. UAE Pet Wearable Market, By Product, 2019-2032 (USD Billion)
71. UAE Pet Wearable Market, By Application, 2019-2032 (USD Billion)
72. South Africa Pet Wearable Market, By Technology, 2019-2032 (USD Billion)
73. South Africa Pet Wearable Market, By Product, 2019-2032 (USD Billion)
74. South Africa Pet Wearable Market, By Application, 2019-2032 (USD Billion)
List of Figures
1. Global Pet Wearable Market Segmentation
2. Global Pet Wearable Market: Research Methodology
3. Market Size Estimation Methodology: Bottom-Up Approach
4. Market Size Estimation Methodology: Top- Approach
5. Data Triangulation
6. Porter’s Five Forces Analysis
7. Value Chain Analysis
8. Global Pet Wearable Market Attractiveness Analysis By Technology
9. Global Pet Wearable Market Attractiveness Analysis By Product
10. Global Pet Wearable Market Attractiveness Analysis By Application
11. Global Pet Wearable Market Attractiveness Analysis By Region
12. Global Pet Wearable Market: Dynamics
13. Global Pet Wearable Market Share By Technology (2023 & 2032)
14. Global Pet Wearable Market Share By Product (2023 & 2032)
15. Global Pet Wearable Market Share By Application (2023 & 2032)
16. Global Pet Wearable Market Share By Regions (2023 & 2032)
17. Global Pet Wearable Market Share By Company (2022)
This study forecasts revenue at global, regional, and country levels from 2019 to 2032. The Brainy Insights has segmented the global pet wearable based on below mentioned segments:
Global Pet Wearable Market by Technology:
Global Pet Wearable Market by Product:
Global Pet Wearable Market by Application:
Global Pet Wearable by Region:
Research has its special purpose to undertake marketing efficiently. In this competitive scenario, businesses need information across all industry verticals; the information about customer wants, market demand, competition, industry trends, distribution channels etc. This information needs to be updated regularly because businesses operate in a dynamic environment. Our organization, The Brainy Insights incorporates scientific and systematic research procedures in order to get proper market insights and industry analysis for overall business success. The analysis consists of studying the market from a miniscule level wherein we implement statistical tools which helps us in examining the data with accuracy and precision.
Our research reports feature both; quantitative and qualitative aspects for any market. Qualitative information for any market research process are fundamental because they reveal the customer needs and wants, usage and consumption for any product/service related to a specific industry. This in turn aids the marketers/investors in knowing certain perceptions of the customers. Qualitative research can enlighten about the different product concepts and designs along with unique service offering that in turn, helps define marketing problems and generate opportunities. On the other hand, quantitative research engages with the data collection process through interviews, e-mail interactions, surveys and pilot studies. Quantitative aspects for the market research are useful to validate the hypotheses generated during qualitative research method, explore empirical patterns in the data with the help of statistical tools, and finally make the market estimations.
The Brainy Insights offers comprehensive research and analysis, based on a wide assortment of factual insights gained through interviews with CXOs and global experts and secondary data from reliable sources. Our analysts and industry specialist assume vital roles in building up statistical tools and analysis models, which are used to analyse the data and arrive at accurate insights with exceedingly informative research discoveries. The data provided by our organization have proven precious to a diverse range of companies, facilitating them to address issues such as determining which products/services are the most appealing, whether or not customers use the product in the manner anticipated, the purchasing intentions of the market and many others.
Our research methodology encompasses an idyllic combination of primary and secondary initiatives. Key phases involved in this process are listed below:

The phase involves the gathering and collecting of market data and its related information with the help of different sources & research procedures.

The data procurement stage involves in data gathering and collecting through various data sources.
This stage involves in extensive research. These data sources includes:
Purchased Database: Purchased databases play a crucial role in estimating the market sizes irrespective of the domain. Our purchased database includes:
Primary Research: The Brainy Insights interacts with leading companies and experts of the concerned domain to develop the analyst team’s market understanding and expertise. It improves and substantiates every single data presented in the market reports. Primary research mainly involves in telephonic interviews, E-mail interactions and face-to-face interviews with the raw material providers, manufacturers/producers, distributors, & independent consultants. The interviews that we conduct provides valuable data on market size and industry growth trends prevailing in the market. Our organization also conducts surveys with the various industry experts in order to gain overall insights of the industry/market. For instance, in healthcare industry we conduct surveys with the pharmacists, doctors, surgeons and nurses in order to gain insights and key information of a medical product/device/equipment which the customers are going to usage. Surveys are conducted in the form of questionnaire designed by our own analyst team. Surveys plays an important role in primary research because surveys helps us to identify the key target audiences of the market. Additionally, surveys helps to identify the key target audience engaged with the market. Our survey team conducts the survey by targeting the key audience, thus gaining insights from them. Based on the perspectives of the customers, this information is utilized to formulate market strategies. Moreover, market surveys helps us to understand the current competitive situation of the industry. To be precise, our survey process typically involve with the 360 analysis of the market. This analytical process begins by identifying the prospective customers for a product or service related to the market/industry to obtain data on how a product/service could fit into customers’ lives.

Secondary Research: The secondary data sources includes information published by the on-profit organizations such as World bank, WHO, company fillings, investor presentations, annual reports, national government documents, statistical databases, blogs, articles, white papers and others. From the annual report, we analyse a company’s revenue to understand the key segment and market share of that organization in a particular region. We analyse the company websites and adopt the product mapping technique which is important for deriving the segment revenue. In the product mapping method, we select and categorize the products offered by the companies catering to domain specific market, deduce the product revenue for each of the companies so as to get overall estimation of the market size. We also source data and analyses trends based on information received from supply side and demand side intermediaries in the value chain. The supply side denotes the data gathered from supplier, distributor, wholesaler and the demand side illustrates the data gathered from the end customers for respective market domain.

The supply side for a domain specific market is analysed by:
The demand side for the market is estimated through:
In-house Library: Apart from these third-party sources, we have our in-house library of qualitative and quantitative information. Our in-house database includes market data for various industry and domains. These data are updated on regular basis as per the changing market scenario. Our library includes, historic databases, internal audit reports and archives.
Sometimes there are instances where there is no metadata or raw data available for any domain specific market. For those cases, we use our expertise to forecast and estimate the market size in order to generate comprehensive data sets. Our analyst team adopt a robust research technique in order to produce the estimates:
Data Synthesis: This stage involves the analysis & mapping of all the information obtained from the previous step. It also involves in scrutinizing the data for any discrepancy observed while data gathering related to the market. The data is collected with consideration to the heterogeneity of sources. Robust scientific techniques are in place for synthesizing disparate data sets and provide the essential contextual information that can orient market strategies. The Brainy Insights has extensive experience in data synthesis where the data passes through various stages:


Market Deduction & Formulation: The final stage comprises of assigning data points at appropriate market spaces so as to deduce feasible conclusions. Analyst perspective & subject matter expert based holistic form of market sizing coupled with industry analysis also plays a crucial role in this stage.
This stage involves in finalization of the market size and numbers that we have collected from data integration step. With data interpolation, it is made sure that there is no gap in the market data. Successful trend analysis is done by our analysts using extrapolation techniques, which provide the best possible forecasts for the market.
Data Validation & Market Feedback: Validation is the most important step in the process. Validation & re-validation via an intricately designed process helps us finalize data-points to be used for final calculations.

The Brainy Insights interacts with leading companies and experts of the concerned domain to develop the analyst team’s market understanding and expertise. It improves and substantiates every single data presented in the market reports. The data validation interview and discussion panels are typically composed of the most experienced industry members. The participants include, however, are not limited to:
Moreover, we always validate our data and findings through primary respondents from all the major regions we are working on.


Free Customization
Fortune 500 Clients
Free Yearly Update On Purchase Of Multi/Corporate License
Companies Served Till Date