- +1-315-215-1633
- sales@thebrainyinsights.com

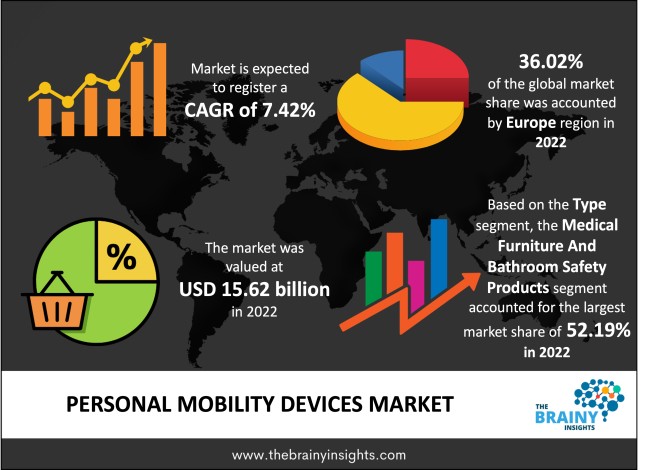
The global personal mobility devices market was valued at USD 15.62 Billion in 2022 and grew at a CAGR of 7.42% from 2023 to 2032. The market is expected to reach USD 31.95 Billion by 2032. The growth of the personal mobility devices market can be attributed to the rise in demand for assisted mobility among patients suffering from chronic diseases. The rising geriatric population and increased disabilities have led to more significant usage of personal mobility devices.
Personal mobility devices are either manually or electrically propelled vehicles typically used by impaired individuals to move around. Personal mobility equipment includes things like wheelers, e-scooters, and walkers. Mobility aids are made to give people who have trouble moving more flexibility and independence. Those with disabilities or injuries typically use personal mobility devices. Users using these devices experience independence, less discomfort, and greater confidence and self-esteem. People who have temporary or ongoing conditions that compromise their mobility, balance, and weight bearing can benefit from mobility assistance. Some mobility aids, like walkers and crutches, can be used by people with enough upper body strength and coordination. Still, wheelchairs are better suited for people who need help moving them or can propel themselves.
Get an overview of this study by requesting a free sample
Increasing use of personal mobility devices: According to studies, mobility aids can improve one's physical stability, self-assurance, and independence; as a result, demand for all kinds of assistive equipment has been growing for more than ten years. Manufacturers have concentrated on the more significant potential of devices that enable older adults to age in place with independence and relieve pressure on family carers and a stressed-out long-term care workforce. Basic mobility aids like canes can lessen the requirement for human assistance, according to studies. With an ageing population and current obesity trends, the demand for mobility devices will probably increase.
High cost of deployment: Personal mobility devices are costlier; thus, demand is restricted in most regions. High-tech gear like powered wheelchairs and assistive devices for fundamental needs like movement, seating, and personal hygiene are too costly compared to manual assisting devices. However, manual assisting devices do not provide the same features as electric technology.
Increased prevalence of chronic diseases: Chronic diseases are the main causes of incapacity and early death in the elderly population. In practically every country, chronic and non-communicable diseases are already the major cause of adult mortality; during the next ten years, this number is expected to increase by 17%. Numerous chronic diseases affect one-third of the global population. The leading chronic diseases in industrialized nations are cardiovascular ailments like heart attacks and strokes, arthritis, diabetes, cancer, including breast and colon cancer, obesity, epilepsy and convulsions, and oral health problems.
The regions analyzed for the market include North America, Europe, South America, Asia Pacific, the Middle East, and Africa. Europe emerged as the most significant personal mobility devices market, with a 36.02% market revenue share in 2022.
Europe region will account for the largest market share with revenue growth. Nations such as the U.K., Germany and Spain have a tremendous demand for personal mobility devices due to the growing geriatric population and increasing cases of chronic diseases, rising investment in the healthcare industry and rising hospitalization. The increasing investment in advancing healthcare services has led to the high adoption of personal mobility devices.
Europe region Personal Mobility Devices Market Share in 2022 - 36.02%
www.thebrainyinsights.com
Check the geographical analysis of this market by requesting a free sample
The type segment is divided into medical furniture and bathroom safety products, medical mobility aids, and ambulatory devices. The medical furniture and bathroom safety products segment includes mobility scooters, crutches, wheelchairs, walkers and canes. The mobility scooters segment further includes boot scooters, road scooters and mid-size scooters. The crutches segment further includes forearm crutches, axillary crutches and elbow crutches. The wheelchairs segment further includes manual and powered. The walkers segment further includes knee walkers, standard walkers and rollators. The canes segment further includes offset canes, folding canes and quad canes. The medical mobility aids and ambulatory devices segment includes medical beds, patient lifts, stair lifts, commodes, bars and railings and others. The medical beds segment further includes manual beds and electric beds. The patient's lift segment further includes power lifts, stand-up lifts, heavy-duty lifts, manual lifts, and overhead track lifts. The stair lifts segment further includes outdoor stair lifts and indoor stair lifts. The medical furniture and bathroom safety products segment dominated the market, with a share of around 52.19% in 2022. Medical furniture and bathroom safety products are used to assist in the mobility of patients who cannot walk independently. There are different types of medical furniture, such as wheelchairs, scooters, crutches, etc., used specifically for patients with different disabilities.
The end-users segment is divided into homecare settings, hospitals and clinics, ambulatory surgical centres, and others. The hospitals and clinics segment dominated the market, with a share of around 43.21% in 2022. Different types of personal mobility devices are used in hospitals and clinics. Many surgeries are performed in hospitals and clinics, necessitating personal mobility devices in these facilities.
| Attribute | Description |
|---|---|
| Market Size | Revenue (USD Billion) |
| Market size value in 2022 | USD 15.62 Billion |
| Market size value in 2032 | USD 31.95 Billion |
| CAGR (2023 to 2032) | 7.42% |
| Historical data | 2019-2021 |
| Base Year | 2022 |
| Forecast | 2023-2032 |
| Region | The regions analyzed for the market are Asia Pacific, Europe, South America, North America, and Middle East & Africa. Furthermore, the regions are further analyzed at the country level. |
| Segments | Type and End-users |
As per The Brainy Insights, the size of the personal mobility devices market was valued USD 15.62 billion in 2022 to USD 31.95 billion by 2032.
Global personal mobility devices market is growing at a CAGR of 7.42% during the forecast period 2023-2032.
North America region emerged as the largest market for the personal mobility devices.
The market's growth will be influenced by the increasing use of personal mobility devices.
The high cost can hamper the market growth.
The increasing incidence of chronic diseases is providing huge opportunities to the market.
1. Introduction
1.1. Objectives of the Study
1.2. Market Definition
1.3. Research Scope
1.4. Currency
1.5. Key Target Audience
2. Research Methodology and Assumptions
3. Executive Summary
4. Premium Insights
4.1. Porter’s Five Forces Analysis
4.2. Value Chain Analysis
4.3. Top Investment Pockets
4.3.1. Market Attractiveness Analysis by Type
4.3.2. Market Attractiveness Analysis by End-users
4.3.3. Market Attractiveness Analysis by Region
4.4. Industry Trends
5. Market Dynamics
5.1. Market Evaluation
5.2. Drivers
5.2.1. Increasing use of personal mobility devices in hospitals and clinics
5.3. Restraints
5.3.1. High cost
5.4. Opportunities
5.4.1. Increasing prevalence of chronic diseases
5.5. Challenges
5.5.1. Lower awareness
6. Global Personal Mobility Devices Market Analysis and Forecast, By Type
6.1. Segment Overview
6.2. Medical Furniture and Bathroom Safety Products
6.2.1. Mobility Scooters
6.2.1.1. Boot Scooters
6.2.1.2. Road Scooters
6.2.1.3. Mid-Size Scooters
6.2.2. Crutches
6.2.2.1. Forearm Crutches
6.2.2.2. Axillary Crutches
6.2.2.3. Elbow Crutches
6.2.3. Wheelchairs
6.2.3.1. Manual
6.2.3.2. Powered
6.2.4. Walkers
6.2.4.1. Knee Walkers
6.2.4.2. Standard Walkers
6.2.4.3. Rollators
6.2.5. Canes
6.2.5.1. Offset Canes
6.2.5.2. Folding Canes
6.2.5.3. Quad Canes
6.3. Medical Mobility Aids and Ambulatory Devices
6.3.1. Medical Beds
6.3.1.1. Manual Beds
6.3.1.2. Electric Beds
6.3.2. Patient Lifts
6.3.2.1. Power Lifts
6.3.2.2. Stand Up Lifts
6.3.2.3. Heavy Duty Lifts
6.3.2.4. Manual Lifts
6.3.2.5. Overhead Track Lifts
6.3.3. Stair Lifts
6.3.3.1. Outdoor Stair Lifts
6.3.3.2. Indoor Stair Lifts
6.4. Commodes
6.5. Bars and Railings
6.6. Others
7. Global Personal Mobility Devices Market Analysis and Forecast, By End-users
7.1. Segment Overview
7.2. Homecare Settings
7.3. Hospitals and Clinics
7.4. Ambulatory Surgical Centres
7.5. Others
8. Global Personal Mobility Devices Market Analysis and Forecast, By Regional Analysis
8.1. Segment Overview
8.2. North America
8.2.1. U.S.
8.2.2. Canada
8.2.3. Mexico
8.3. Europe
8.3.1. Germany
8.3.2. France
8.3.3. U.K.
8.3.4. Italy
8.3.5. Spain
8.4. Asia-Pacific
8.4.1. Japan
8.4.2. China
8.4.3. India
8.5. South America
8.5.1. Brazil
8.6. Middle East and Africa
8.6.1. UAE
8.6.2. South Africa
9. Global Personal Mobility Devices Market-Competitive Landscape
9.1. Overview
9.2. Market Share of Key Players in the Personal Mobility Devices Market
9.2.1. Global Company Market Share
9.2.2. North America Company Market Share
9.2.3. Europe Company Market Share
9.2.4. APAC Company Market Share
9.3. Competitive Situations and Trends
9.3.1. Product Launches and Developments
9.3.2. Partnerships, Collaborations, and Agreements
9.3.3. Mergers & Acquisitions
9.3.4. Expansions
10. Company Profiles
10.1. Drive DeVilbiss Healthcare
10.1.1. Business Overview
10.1.2. Company Snapshot
10.1.3. Company Market Share Analysis
10.1.4. Company Product Portfolio
10.1.5. Recent Developments
10.1.6. SWOT Analysis
10.2. Invacare Corporation
10.2.1. Business Overview
10.2.2. Company Snapshot
10.2.3. Company Market Share Analysis
10.2.4. Company Product Portfolio
10.2.5. Recent Developments
10.2.6. SWOT Analysis
10.3. GF Health Products, Inc.
10.3.1. Business Overview
10.3.2. Company Snapshot
10.3.3. Company Market Share Analysis
10.3.4. Company Product Portfolio
10.3.5. Recent Developments
10.3.6. SWOT Analysis
10.4. Carex Health Brands, Inc.
10.4.1. Business Overview
10.4.2. Company Snapshot
10.4.3. Company Market Share Analysis
10.4.4. Company Product Portfolio
10.4.5. Recent Developments
10.4.6. SWOT Analysis
10.5. Briggs Healthcare
10.5.1. Business Overview
10.5.2. Company Snapshot
10.5.3. Company Market Share Analysis
10.5.4. Company Product Portfolio
10.5.5. Recent Developments
10.5.6. SWOT Analysis
10.6. Kaye Products, Inc.
10.6.1. Business Overview
10.6.2. Company Snapshot
10.6.3. Company Market Share Analysis
10.6.4. Company Product Portfolio
10.6.5. Recent Developments
10.6.6. SWOT Analysis
10.7. Medline Industries, Inc.
10.7.1. Business Overview
10.7.2. Company Snapshot
10.7.3. Company Market Share Analysis
10.7.4. Company Product Portfolio
10.7.5. Recent Developments
10.7.6. SWOT Analysis
10.8. Performance Health
10.8.1. Business Overview
10.8.2. Company Snapshot
10.8.3. Company Market Share Analysis
10.8.4. Company Product Portfolio
10.8.5. Recent Developments
10.8.6. SWOT Analysis
10.9. NOVA Medical Products
10.9.1. Business Overview
10.9.2. Company Snapshot
10.9.3. Company Market Share Analysis
10.9.4. Company Product Portfolio
10.9.5. Recent Developments
10.9.6. SWOT Analysis
10.10. Sunrise Medical LLC
10.10.1. Business Overview
10.10.2. Company Snapshot
10.10.3. Company Market Share Analysis
10.10.4. Company Product Portfolio
10.10.5. Recent Developments
10.10.6. SWOT Analysis
10.11. Stryker Corporation
10.11.1. Business Overview
10.11.2. Company Snapshot
10.11.3. Company Market Share Analysis
10.11.4. Company Product Portfolio
10.11.5. Recent Developments
10.11.6. SWOT Analysis
10.12. Rollz International
10.12.1. Business Overview
10.12.2. Company Snapshot
10.12.3. Company Market Share Analysis
10.12.4. Company Product Portfolio
10.12.5. Recent Developments
10.12.6. SWOT Analysis
10.13. Hill Rom Holdings Inc.
10.13.1. Business Overview
10.13.2. Company Snapshot
10.13.3. Company Market Share Analysis
10.13.4. Company Product Portfolio
10.13.5. Recent Developments
10.13.6. SWOT Analysis
List of Table
1. Global Personal Mobility Devices Market, By Type, 2019-2032 (USD Billion)
2. Global Medical Furniture and Bathroom Safety Products, Personal Mobility Devices Market, By Region, 2019-2032 (USD Billion)
3. Global Medical Mobility Aids and Ambulatory Devices, Personal Mobility Devices Market, By Region, 2019-2032 (USD Billion)
4. Global Personal Mobility Devices Market, By End-users, 2019-2032 (USD Billion)
5. Global Homecare Settings, Personal Mobility Devices Market, By Region, 2019-2032 (USD Billion)
6. Global Hospitals and Clinics, Personal Mobility Devices Market, By Region, 2019-2032 (USD Billion)
7. Global Ambulatory Surgical Centres, Personal Mobility Devices Market, By Region, 2019-2032 (USD Billion)
8. Global Others, Personal Mobility Devices Market, By Region, 2019-2032 (USD Billion)
9. Global Personal Mobility Devices Market, By Region, 2019-2032 (USD Billion)
10. North America Personal Mobility Devices Market, By Type, 2019-2032 (USD Billion)
11. North America Personal Mobility Devices Market, By End-users, 2019-2032 (USD Billion)
12. U.S. Personal Mobility Devices Market, By Type, 2019-2032 (USD Billion)
13. U.S. Personal Mobility Devices Market, By End-users, 2019-2032 (USD Billion)
14. Canada Personal Mobility Devices Market, By Type, 2019-2032 (USD Billion)
15. Canada Personal Mobility Devices Market, By End-users, 2019-2032 (USD Billion)
16. Mexico Personal Mobility Devices Market, By Type, 2019-2032 (USD Billion)
17. Mexico Personal Mobility Devices Market, By End-users, 2019-2032 (USD Billion)
18. Europe Personal Mobility Devices Market, By Type, 2019-2032 (USD Billion)
19. Europe Personal Mobility Devices Market, By End-users, 2019-2032 (USD Billion)
20. Germany Personal Mobility Devices Market, By Type, 2019-2032 (USD Billion)
21. Germany Personal Mobility Devices Market, By End-users, 2019-2032 (USD Billion)
22. France Personal Mobility Devices Market, By Type, 2019-2032 (USD Billion)
23. France Personal Mobility Devices Market, By End-users, 2019-2032 (USD Billion)
24. U.K. Personal Mobility Devices Market, By Type, 2019-2032 (USD Billion)
25. U.K. Personal Mobility Devices Market, By End-users, 2019-2032 (USD Billion)
26. Italy Personal Mobility Devices Market, By Type, 2019-2032 (USD Billion)
27. Italy Personal Mobility Devices Market, By End-users, 2019-2032 (USD Billion)
28. Spain Personal Mobility Devices Market, By Type, 2019-2032 (USD Billion)
29. Spain Personal Mobility Devices Market, By End-users, 2019-2032 (USD Billion)
30. Asia Pacific Personal Mobility Devices Market, By Type, 2019-2032 (USD Billion)
31. Asia Pacific Personal Mobility Devices Market, By End-users, 2019-2032 (USD Billion)
32. Japan Personal Mobility Devices Market, By Type, 2019-2032 (USD Billion)
33. Japan Personal Mobility Devices Market, By End-users, 2019-2032 (USD Billion)
34. China Personal Mobility Devices Market, By Type, 2019-2032 (USD Billion)
35. China Personal Mobility Devices Market, By End-users, 2019-2032 (USD Billion)
36. India Personal Mobility Devices Market, By Type, 2019-2032 (USD Billion)
37. India Personal Mobility Devices Market, By End-users, 2019-2032 (USD Billion)
38. South America Personal Mobility Devices Market, By Type, 2019-2032 (USD Billion)
39. South America Personal Mobility Devices Market, By End-users, 2019-2032 (USD Billion)
40. Brazil Personal Mobility Devices Market, By Type, 2019-2032 (USD Billion)
41. Brazil Personal Mobility Devices Market, By End-users, 2019-2032 (USD Billion)
42. Middle East and Africa Personal Mobility Devices Market, By Type, 2019-2032 (USD Billion)
43. Middle East and Africa Personal Mobility Devices Market, By End-users, 2019-2032 (USD Billion)
44. UAE Personal Mobility Devices Market, By Type, 2019-2032 (USD Billion)
45. UAE Personal Mobility Devices Market, By End-users, 2019-2032 (USD Billion)
46. South Africa Personal Mobility Devices Market, By Type, 2019-2032 (USD Billion)
47. South Africa Personal Mobility Devices Market, By End-users, 2019-2032 (USD Billion)
List of Figures
1. Global Personal Mobility Devices Market Segmentation
2. Personal Mobility Devices Market: Research Methodology
3. Market Size Estimation Methodology: Bottom-Up Approach
4. Market Size Estimation Methodology: Top-Down Approach
5. Data Triangulation
6. Porter’s Five Forces Analysis
7. Value Chain Analysis
8. Global Personal Mobility Devices Market Attractiveness Analysis by Type
9. Global Personal Mobility Devices Market Attractiveness Analysis by End-users
10. Global Personal Mobility Devices Market Attractiveness Analysis by Region
11. Global Personal Mobility Devices Market: Dynamics
12. Global Personal Mobility Devices Market Share by Type (2022 & 2032)
13. Global Personal Mobility Devices Market Share by End-users (2022 & 2032)
14. Global Personal Mobility Devices Market Share by Regions (2022 & 2032)
15. Global Personal Mobility Devices Market Share by Company (2022)
This study forecasts revenue at global, regional, and country levels from 2019 to 2032. The Brainy Insights has segmented the global personal mobility devices market based on below mentioned segments:
Global Personal Mobility Devices Market by Type:
Global Personal Mobility Devices Market by End-users:
Global Personal Mobility Devices Market by Region:
Research has its special purpose to undertake marketing efficiently. In this competitive scenario, businesses need information across all industry verticals; the information about customer wants, market demand, competition, industry trends, distribution channels etc. This information needs to be updated regularly because businesses operate in a dynamic environment. Our organization, The Brainy Insights incorporates scientific and systematic research procedures in order to get proper market insights and industry analysis for overall business success. The analysis consists of studying the market from a miniscule level wherein we implement statistical tools which helps us in examining the data with accuracy and precision.
Our research reports feature both; quantitative and qualitative aspects for any market. Qualitative information for any market research process are fundamental because they reveal the customer needs and wants, usage and consumption for any product/service related to a specific industry. This in turn aids the marketers/investors in knowing certain perceptions of the customers. Qualitative research can enlighten about the different product concepts and designs along with unique service offering that in turn, helps define marketing problems and generate opportunities. On the other hand, quantitative research engages with the data collection process through interviews, e-mail interactions, surveys and pilot studies. Quantitative aspects for the market research are useful to validate the hypotheses generated during qualitative research method, explore empirical patterns in the data with the help of statistical tools, and finally make the market estimations.
The Brainy Insights offers comprehensive research and analysis, based on a wide assortment of factual insights gained through interviews with CXOs and global experts and secondary data from reliable sources. Our analysts and industry specialist assume vital roles in building up statistical tools and analysis models, which are used to analyse the data and arrive at accurate insights with exceedingly informative research discoveries. The data provided by our organization have proven precious to a diverse range of companies, facilitating them to address issues such as determining which products/services are the most appealing, whether or not customers use the product in the manner anticipated, the purchasing intentions of the market and many others.
Our research methodology encompasses an idyllic combination of primary and secondary initiatives. Key phases involved in this process are listed below:

The phase involves the gathering and collecting of market data and its related information with the help of different sources & research procedures.

The data procurement stage involves in data gathering and collecting through various data sources.
This stage involves in extensive research. These data sources includes:
Purchased Database: Purchased databases play a crucial role in estimating the market sizes irrespective of the domain. Our purchased database includes:
Primary Research: The Brainy Insights interacts with leading companies and experts of the concerned domain to develop the analyst team’s market understanding and expertise. It improves and substantiates every single data presented in the market reports. Primary research mainly involves in telephonic interviews, E-mail interactions and face-to-face interviews with the raw material providers, manufacturers/producers, distributors, & independent consultants. The interviews that we conduct provides valuable data on market size and industry growth trends prevailing in the market. Our organization also conducts surveys with the various industry experts in order to gain overall insights of the industry/market. For instance, in healthcare industry we conduct surveys with the pharmacists, doctors, surgeons and nurses in order to gain insights and key information of a medical product/device/equipment which the customers are going to usage. Surveys are conducted in the form of questionnaire designed by our own analyst team. Surveys plays an important role in primary research because surveys helps us to identify the key target audiences of the market. Additionally, surveys helps to identify the key target audience engaged with the market. Our survey team conducts the survey by targeting the key audience, thus gaining insights from them. Based on the perspectives of the customers, this information is utilized to formulate market strategies. Moreover, market surveys helps us to understand the current competitive situation of the industry. To be precise, our survey process typically involve with the 360 analysis of the market. This analytical process begins by identifying the prospective customers for a product or service related to the market/industry to obtain data on how a product/service could fit into customers’ lives.

Secondary Research: The secondary data sources includes information published by the on-profit organizations such as World bank, WHO, company fillings, investor presentations, annual reports, national government documents, statistical databases, blogs, articles, white papers and others. From the annual report, we analyse a company’s revenue to understand the key segment and market share of that organization in a particular region. We analyse the company websites and adopt the product mapping technique which is important for deriving the segment revenue. In the product mapping method, we select and categorize the products offered by the companies catering to domain specific market, deduce the product revenue for each of the companies so as to get overall estimation of the market size. We also source data and analyses trends based on information received from supply side and demand side intermediaries in the value chain. The supply side denotes the data gathered from supplier, distributor, wholesaler and the demand side illustrates the data gathered from the end customers for respective market domain.

The supply side for a domain specific market is analysed by:
The demand side for the market is estimated through:
In-house Library: Apart from these third-party sources, we have our in-house library of qualitative and quantitative information. Our in-house database includes market data for various industry and domains. These data are updated on regular basis as per the changing market scenario. Our library includes, historic databases, internal audit reports and archives.
Sometimes there are instances where there is no metadata or raw data available for any domain specific market. For those cases, we use our expertise to forecast and estimate the market size in order to generate comprehensive data sets. Our analyst team adopt a robust research technique in order to produce the estimates:
Data Synthesis: This stage involves the analysis & mapping of all the information obtained from the previous step. It also involves in scrutinizing the data for any discrepancy observed while data gathering related to the market. The data is collected with consideration to the heterogeneity of sources. Robust scientific techniques are in place for synthesizing disparate data sets and provide the essential contextual information that can orient market strategies. The Brainy Insights has extensive experience in data synthesis where the data passes through various stages:


Market Deduction & Formulation: The final stage comprises of assigning data points at appropriate market spaces so as to deduce feasible conclusions. Analyst perspective & subject matter expert based holistic form of market sizing coupled with industry analysis also plays a crucial role in this stage.
This stage involves in finalization of the market size and numbers that we have collected from data integration step. With data interpolation, it is made sure that there is no gap in the market data. Successful trend analysis is done by our analysts using extrapolation techniques, which provide the best possible forecasts for the market.
Data Validation & Market Feedback: Validation is the most important step in the process. Validation & re-validation via an intricately designed process helps us finalize data-points to be used for final calculations.

The Brainy Insights interacts with leading companies and experts of the concerned domain to develop the analyst team’s market understanding and expertise. It improves and substantiates every single data presented in the market reports. The data validation interview and discussion panels are typically composed of the most experienced industry members. The participants include, however, are not limited to:
Moreover, we always validate our data and findings through primary respondents from all the major regions we are working on.


Free Customization
Fortune 500 Clients
Free Yearly Update On Purchase Of Multi/Corporate License
Companies Served Till Date