- +1-315-215-1633
- sales@thebrainyinsights.com

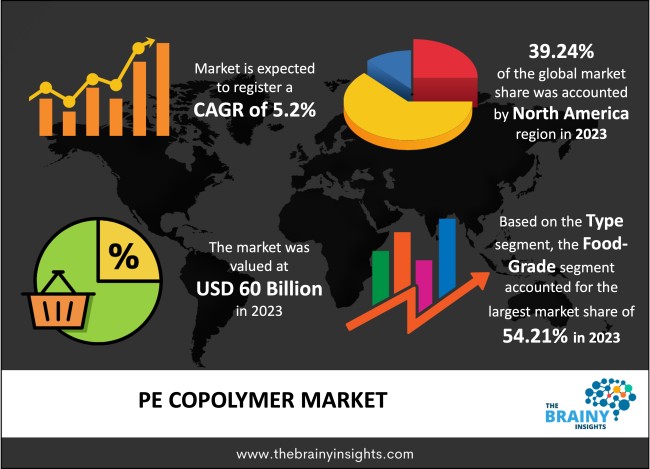
The global PE Copolymer market was valued at USD 60 billion in 2023 and growing at a CAGR of 5.2% from 2024 to 2033. The market is expected to reach USD 100 billion by 2033. The introduction of flexible and versatile packaging design, rising consumer inclination for convenience and safety options and rising demand for bi-based PE Copolymers will potentially drive the growth of the PE Copolymer Market. Whereas, varied sustainability and circular economic initiatives and rapidly growing technological advancements in material science and other processing technologies may drive the growth of the PE Copolymer Market in the period forecasted.
PE copolymers, or polyethylene copolymers, are a type of polymer material produced through the copolymerization of ethylene with one or more monomers. These commoners are typically other olefins, such as propylene, butene, hexene, or octene. By incorporating these monomers into the polymer chain alongside ethylene, various properties of the resulting copolymer can be modified to suit specific applications.
Get an overview of this study by requesting a free sample
Rising demand for bio-based PE Copolymers - Bio-based PE copolymers, derived from sustainable biomass feed stocks such as sugarcane, offer a more environmentally friendly alternative to traditional petroleum-based counterparts. This eco-conscious choice is anticipated to gain traction in the market as sustainability takes on greater significance in material selection. In response to growing environmental concerns, governmental and regulatory bodies are increasingly advocating for the adoption of bio-based products. The demand for bio-based PE copolymers can be bolstered through the implementation of incentives, subsidies, and regulatory measures aimed at promoting their production and utilization.
Increased price for PE Copolymers in the market - The escalation in prices for PE copolymers presents a significant constraint for their adoption in the market. This is due to several factors:
1. Cost Sensitivity: Industries and consumers are often sensitive to price fluctuations. When the price of PE copolymers rises, it can lead to reduced demand as consumers seek more cost-effective alternatives.
2. Competitive Disadvantage: Higher prices for PE copolymers can make them less competitive compared to other materials or alternative polymers. This may prompt consumers to switch to substitutes with lower costs, impacting the market share of PE copolymers.
Rapidly growing technological advancements in material science and other processing technologies - Continual progress in material science and processing technologies facilitates the creation of high-performance PE copolymers featuring improved characteristics like barrier protection, scalability, and printability. Breakthroughs in polymer chemistry and manufacturing methods further broaden the scope of applications for PE copolymers within the packaging industry.
The regions analyzed for the market include North America, Europe, South America, Asia Pacific, the Middle East, and Africa. North America emerged as the largest global PE Copolymer market, accounting for 39.24% of the total market. Owing to rapidly growing industrial and manufacturing activities in the market, additional technological breakthroughs and an increase in 3D printing applications is another factor boosting the growth of PE Copolymers in the market. Europe is expected to be the fastest-growing in the market owing to an increase in industrialization in the region.
North America Region PE Copolymer Market Share in 2023 - 39.24%
www.thebrainyinsights.com
Check the geographical analysis of this market by requesting a free sample
The food-grade sector currently dominates the PE copolymer market thereby acquiring 54.21% of the market share, where these specialized materials are extensively utilized in packaging applications such as films, bags, pouches, and containers. These food-grade PE copolymers are preferred for their versatile qualities, including flexibility, resilience, and effective barrier properties, which are essential for maintaining the quality of packaged food products. Whereas, the non-food grade segment is poised to experience significant growth in the forecast period within the PE copolymer market. These copolymers find widespread application in non-food packaging, serving industries ranging from industrial commodities to household items, cleaning products, and personal care goods. With their adaptable nature, PE copolymers enable the development of tailored packaging solutions tailored to the specific needs of various non-food items.
The packaging category holds the largest market share within the PE copolymer industry. Thereby acquiring a share of 35% in the market. This dominance is attributed to the widespread use of PE copolymers in the production of thin, flexible films, driven by their excellent moisture resistance, scalability, and printability. These films find applications in various sectors including food packaging, industrial packaging, and other consumer goods packaging. Additionally, to enhance barrier properties and overall packaging performance, PE copolymers are often combined with other materials to form laminates. Over the forecast period, the cable segment of the PE copolymer market is expected to exhibit the most rapid growth. PE copolymers are commonly utilized as insulation materials for electrical wires. Their dielectric properties make them well-suited for providing electrical insulation, preventing current flow between conductors.
| Attribute | Description |
|---|---|
| Market Size | Revenue (USD Billion) |
| Market size value in 2023 | USD 60 Billion |
| Market size value in 2033 | USD 100 Billion |
| CAGR (2024 to 2033) | 5.2% |
| Historical data | 2020-2022 |
| Base Year | 2023 |
| Forecast | 2024-2033 |
| Region | The regions analyzed for the market are Asia Pacific, Europe, South America, North America, and Middle East & Africa. Furthermore, the regions are further analyzed at the country level. |
| Segments | Type, Application |
As per The Brainy Insights, the size of the PE copolymer market was valued at USD 60 billion in 2023 to USD 100 billion by 2033.
The global PE copolymer market is growing at a CAGR of 5.2% during the forecast period 2024-2033.
The North America region emerged as the largest market for the PE copolymer.
The rising demand for bio-based PE copolymers will influence the market's growth.
1. Introduction
1.1. Objectives of the Study
1.2. Market Definition
1.3. Research Scope
1.4. Currency
1.5. Key Target Audience
2. Research Methodology and Assumptions
3. Executive Summary
4. Premium Insights
4.1. Porter’s Five Forces Analysis
4.2. Value Chain Analysis
4.3. Top Investment Pockets
4.3.1. Market Attractiveness Analysis by Type
4.3.2. Market Attractiveness Analysis by Application
4.3.3. Market Attractiveness Analysis by Region
4.4. Industry Trends
5. Market Dynamics
5.1. Market Evaluation
5.2. Drivers
5.2.1. Introduction of flexible and versatile packaging design
5.2.2. Rising consumer inclination for convenience and safety option
5.2.3. Rising demand for bi-based PE Copolymers
5.3. Restraints
5.3.1. Increased price for PE Copolymers in the market
5.4. Opportunities
5.4.1. Varied sustainability and circular economic initiatives
5.4.2. Rapidly growing technological advancements in material science and other processing technologies
5.5. Challenges
5.5.1. Increased competition from the market players, globally
6. Global PE Copolymer Market Analysis and Forecast, By Type
6.1. Segment Overview
6.2. Food-Grade
6.3. Non-Food Grade
7. Global PE Copolymer Market Analysis and Forecast, By Application
7.1. Segment Overview
7.2. Package
7.3. Container
8. Global PE Copolymer Market Analysis and Forecast, By Regional Analysis
8.1. Segment Overview
8.2. North America
8.2.1. U.S.
8.2.2. Canada
8.2.3. Mexico
8.3. Europe
8.3.1. Germany
8.3.2. France
8.3.3. U.K.
8.3.4. Italy
8.3.5. Spain
8.4. Asia-Pacific
8.4.1. Japan
8.4.2. China
8.4.3. India
8.5. South America
8.5.1. Brazil
8.6. Middle East and Africa
8.6.1. UAE
8.6.2. South Africa
9. Global PE Copolymer Market-Competitive Landscape
9.1. Overview
9.2. Market Share of Key Players in Global PE Copolymer Market
9.2.1. Global Company Market Share
9.2.2. North America Company Market Share
9.2.3. Europe Company Market Share
9.2.4. APAC Company Market Share
9.3. Competitive Situations and Trends
9.3.1. Product Launches and Developments
9.3.2. Partnerships, Collaborations, and Agreements
9.3.3. Mergers & Acquisitions
9.3.4. Expansions
10. Company Profiles
10.1. Horda
10.1.1. Business Overview
10.1.2. Company Snapshot
10.1.3. Company Market Share Analysis
10.1.4. Company Product Portfolio
10.1.5. Recent Developments
10.1.6. SWOT Analysis
10.2. Unipetrol
10.2.1. Business Overview
10.2.2. Company Snapshot
10.2.3. Company Market Share Analysis
10.2.4. Company Product Portfolio
10.2.5. Recent Developments
10.2.6. SWOT Analysis
10.3. DoW
10.3.1. Business Overview
10.3.2. Company Snapshot
10.3.3. Company Market Share Analysis
10.3.4. Company Product Portfolio
10.3.5. Recent Developments
10.3.6. SWOT Analysis
10.4. ICO Polymers
10.4.1. Business Overview
10.4.2. Company Snapshot
10.4.3. Company Market Share Analysis
10.4.4. Company Product Portfolio
10.4.5. Recent Developments
10.4.6. SWOT Analysis
10.5. Guangzhou Lushan
10.5.1. Business Overview
10.5.2. Company Snapshot
10.5.3. Company Market Share Analysis
10.5.4. Company Product Portfolio
10.5.5. Recent Developments
10.5.6. SWOT Analysis
10.6. Ineos
10.6.1. Business Overview
10.6.2. Company Snapshot
10.6.3. Company Market Share Analysis
10.6.4. Company Product Portfolio
10.6.5. Recent Developments
10.6.6. SWOT Analysis
10.7. Americhem
10.7.1. Business Overview
10.7.2. Company Snapshot
10.7.3. Company Market Share Analysis
10.7.4. Company Product Portfolio
10.7.5. Recent Developments
10.7.6. SWOT Analysis
10.8. ExxonMobil
10.8.1. Business Overview
10.8.2. Company Snapshot
10.8.3. Company Market Share Analysis
10.8.4. Company Product Portfolio
10.8.5. Recent Developments
10.8.6. SWOT Analysis
10.9. Ferro
10.9.1. Business Overview
10.9.2. Company Snapshot
10.9.3. Company Market Share Analysis
10.9.4. Company Product Portfolio
10.9.5. Recent Developments
10.9.6. SWOT Analysis
10.10. MOL Group
10.10.1. Business Overview
10.10.2. Company Snapshot
10.10.3. Company Market Share Analysis
10.10.4. Company Product Portfolio
10.10.5. Recent Developments
10.10.6. SWOT Analysis
List of Table
1. Global PE Copolymer Market, By Type, 2020-2033 (USD Billion)
2. Global Food Grade, PE Copolymer Market, By Region, 2020-2033 (USD Billion)
3. Global Non-Food Grade, PE Copolymer Market, By Region, 2020-2033 (USD Billion)
4. Global PE Copolymer Market, By Application, 2020-2033 (USD Billion)
5. Global Package, PE Copolymer Market, By Region, 2020-2033 (USD Billion)
6. Global Container, PE Copolymer Market, By Region, 2020-2033 (USD Billion)
7. Global PE Copolymer Market, By Region, 2020-2033 (USD Billion)
8. North America PE Copolymer Market, By Type, 2020-2033 (USD Billion)
9. North America PE Copolymer Market, By Application, 2020-2033 (USD Billion)
10. U.S. PE Copolymer Market, By Type, 2020-2033 (USD Billion)
11. U.S. PE Copolymer Market, By Application, 2020-2033 (USD Billion)
12. Canada PE Copolymer Market, By Type, 2020-2033 (USD Billion)
13. Canada PE Copolymer Market, By Application, 2020-2033 (USD Billion)
14. Mexico PE Copolymer Market, By Type, 2020-2033 (USD Billion)
15. Mexico PE Copolymer Market, By Application, 2020-2033 (USD Billion)
16. Europe PE Copolymer Market, By Type, 2020-2033 (USD Billion)
17. Europe PE Copolymer Market, By Application, 2020-2033 (USD Billion)
18. Germany PE Copolymer Market, By Type, 2020-2033 (USD Billion)
19. Germany PE Copolymer Market, By Application, 2020-2033 (USD Billion)
20. France PE Copolymer Market, By Type, 2020-2033 (USD Billion)
21. France PE Copolymer Market, By Application, 2020-2033 (USD Billion)
22. U.K. PE Copolymer Market, By Type, 2020-2033 (USD Billion)
23. U.K. PE Copolymer Market, By Application, 2020-2033 (USD Billion)
24. Italy PE Copolymer Market, By Type, 2020-2033 (USD Billion)
25. Italy PE Copolymer Market, By Application, 2020-2033 (USD Billion)
26. Spain PE Copolymer Market, By Type, 2020-2033 (USD Billion)
27. Spain PE Copolymer Market, By Application, 2020-2033 (USD Billion)
28. Asia Pacific PE Copolymer Market, By Type, 2020-2033 (USD Billion)
29. Asia Pacific PE Copolymer Market, By Application, 2020-2033 (USD Billion)
30. Japan PE Copolymer Market, By Type, 2020-2033 (USD Billion)
31. Japan PE Copolymer Market, By Application, 2020-2033 (USD Billion)
32. China PE Copolymer Market, By Type, 2020-2033 (USD Billion)
33. China PE Copolymer Market, By Application, 2020-2033 (USD Billion)
34. India PE Copolymer Market, By Type, 2020-2033 (USD Billion)
35. India PE Copolymer Market, By Application, 2020-2033 (USD Billion)
36. South America PE Copolymer Market, By Type, 2020-2033 (USD Billion)
37. South America PE Copolymer Market, By Application, 2020-2033 (USD Billion)
38. Brazil PE Copolymer Market, By Type, 2020-2033 (USD Billion)
39. Brazil PE Copolymer Market, By Application, 2020-2033 (USD Billion)
40. Middle East and Africa PE Copolymer Market, By Type, 2020-2033 (USD Billion)
41. Middle East and Africa PE Copolymer Market, By Application, 2020-2033 (USD Billion)
42. UAE PE Copolymer Market, By Type, 2020-2033 (USD Billion)
43. UAE PE Copolymer Market, By Application, 2020-2033 (USD Billion)
44. South Africa PE Copolymer Market, By Type, 2020-2033 (USD Billion)
45. South Africa PE Copolymer Market, By Application, 2020-2033 (USD Billion)
List of Figures
1. Global PE Copolymer Market Segmentation
2. Global PE Copolymer Market: Research Methodology
3. Market Size Estimation Methodology: Bottom-Up Approach
4. Market Size Estimation Methodology: Top-Down Approach
5. Data Triangulation
6. Porter’s Five Forces Analysis
7. Value Chain Analysis
8. Global PE Copolymer Market Attractiveness Analysis by Type
9. Global PE Copolymer Market Attractiveness Analysis by Application
10. Global PE Copolymer Market Attractiveness Analysis by Region
11. Global PE Copolymer Market: Dynamics
12. Global PE Copolymer Market Share by Type (2023 & 2033)
13. Global PE Copolymer Market Share by Application (2023 & 2033)
14. Global PE Copolymer Market Share by Regions (2023 & 2033)
15. Global PE Copolymer Market Share by Company (2023)
This study forecasts revenue at global, regional, and country levels from 2020 to 2033. The Brainy Insights has segmented the global PE copolymer market based on below-mentioned segments:
Global PE Copolymer Market by Type:
Global PE Copolymer Market by Application:
Global PE Copolymer Market by Region:
Research has its special purpose to undertake marketing efficiently. In this competitive scenario, businesses need information across all industry verticals; the information about customer wants, market demand, competition, industry trends, distribution channels etc. This information needs to be updated regularly because businesses operate in a dynamic environment. Our organization, The Brainy Insights incorporates scientific and systematic research procedures in order to get proper market insights and industry analysis for overall business success. The analysis consists of studying the market from a miniscule level wherein we implement statistical tools which helps us in examining the data with accuracy and precision.
Our research reports feature both; quantitative and qualitative aspects for any market. Qualitative information for any market research process are fundamental because they reveal the customer needs and wants, usage and consumption for any product/service related to a specific industry. This in turn aids the marketers/investors in knowing certain perceptions of the customers. Qualitative research can enlighten about the different product concepts and designs along with unique service offering that in turn, helps define marketing problems and generate opportunities. On the other hand, quantitative research engages with the data collection process through interviews, e-mail interactions, surveys and pilot studies. Quantitative aspects for the market research are useful to validate the hypotheses generated during qualitative research method, explore empirical patterns in the data with the help of statistical tools, and finally make the market estimations.
The Brainy Insights offers comprehensive research and analysis, based on a wide assortment of factual insights gained through interviews with CXOs and global experts and secondary data from reliable sources. Our analysts and industry specialist assume vital roles in building up statistical tools and analysis models, which are used to analyse the data and arrive at accurate insights with exceedingly informative research discoveries. The data provided by our organization have proven precious to a diverse range of companies, facilitating them to address issues such as determining which products/services are the most appealing, whether or not customers use the product in the manner anticipated, the purchasing intentions of the market and many others.
Our research methodology encompasses an idyllic combination of primary and secondary initiatives. Key phases involved in this process are listed below:

The phase involves the gathering and collecting of market data and its related information with the help of different sources & research procedures.

The data procurement stage involves in data gathering and collecting through various data sources.
This stage involves in extensive research. These data sources includes:
Purchased Database: Purchased databases play a crucial role in estimating the market sizes irrespective of the domain. Our purchased database includes:
Primary Research: The Brainy Insights interacts with leading companies and experts of the concerned domain to develop the analyst team’s market understanding and expertise. It improves and substantiates every single data presented in the market reports. Primary research mainly involves in telephonic interviews, E-mail interactions and face-to-face interviews with the raw material providers, manufacturers/producers, distributors, & independent consultants. The interviews that we conduct provides valuable data on market size and industry growth trends prevailing in the market. Our organization also conducts surveys with the various industry experts in order to gain overall insights of the industry/market. For instance, in healthcare industry we conduct surveys with the pharmacists, doctors, surgeons and nurses in order to gain insights and key information of a medical product/device/equipment which the customers are going to usage. Surveys are conducted in the form of questionnaire designed by our own analyst team. Surveys plays an important role in primary research because surveys helps us to identify the key target audiences of the market. Additionally, surveys helps to identify the key target audience engaged with the market. Our survey team conducts the survey by targeting the key audience, thus gaining insights from them. Based on the perspectives of the customers, this information is utilized to formulate market strategies. Moreover, market surveys helps us to understand the current competitive situation of the industry. To be precise, our survey process typically involve with the 360 analysis of the market. This analytical process begins by identifying the prospective customers for a product or service related to the market/industry to obtain data on how a product/service could fit into customers’ lives.

Secondary Research: The secondary data sources includes information published by the on-profit organizations such as World bank, WHO, company fillings, investor presentations, annual reports, national government documents, statistical databases, blogs, articles, white papers and others. From the annual report, we analyse a company’s revenue to understand the key segment and market share of that organization in a particular region. We analyse the company websites and adopt the product mapping technique which is important for deriving the segment revenue. In the product mapping method, we select and categorize the products offered by the companies catering to domain specific market, deduce the product revenue for each of the companies so as to get overall estimation of the market size. We also source data and analyses trends based on information received from supply side and demand side intermediaries in the value chain. The supply side denotes the data gathered from supplier, distributor, wholesaler and the demand side illustrates the data gathered from the end customers for respective market domain.

The supply side for a domain specific market is analysed by:
The demand side for the market is estimated through:
In-house Library: Apart from these third-party sources, we have our in-house library of qualitative and quantitative information. Our in-house database includes market data for various industry and domains. These data are updated on regular basis as per the changing market scenario. Our library includes, historic databases, internal audit reports and archives.
Sometimes there are instances where there is no metadata or raw data available for any domain specific market. For those cases, we use our expertise to forecast and estimate the market size in order to generate comprehensive data sets. Our analyst team adopt a robust research technique in order to produce the estimates:
Data Synthesis: This stage involves the analysis & mapping of all the information obtained from the previous step. It also involves in scrutinizing the data for any discrepancy observed while data gathering related to the market. The data is collected with consideration to the heterogeneity of sources. Robust scientific techniques are in place for synthesizing disparate data sets and provide the essential contextual information that can orient market strategies. The Brainy Insights has extensive experience in data synthesis where the data passes through various stages:


Market Deduction & Formulation: The final stage comprises of assigning data points at appropriate market spaces so as to deduce feasible conclusions. Analyst perspective & subject matter expert based holistic form of market sizing coupled with industry analysis also plays a crucial role in this stage.
This stage involves in finalization of the market size and numbers that we have collected from data integration step. With data interpolation, it is made sure that there is no gap in the market data. Successful trend analysis is done by our analysts using extrapolation techniques, which provide the best possible forecasts for the market.
Data Validation & Market Feedback: Validation is the most important step in the process. Validation & re-validation via an intricately designed process helps us finalize data-points to be used for final calculations.

The Brainy Insights interacts with leading companies and experts of the concerned domain to develop the analyst team’s market understanding and expertise. It improves and substantiates every single data presented in the market reports. The data validation interview and discussion panels are typically composed of the most experienced industry members. The participants include, however, are not limited to:
Moreover, we always validate our data and findings through primary respondents from all the major regions we are working on.


Free Customization
Fortune 500 Clients
Free Yearly Update On Purchase Of Multi/Corporate License
Companies Served Till Date