- +1-315-215-1633
- sales@thebrainyinsights.com

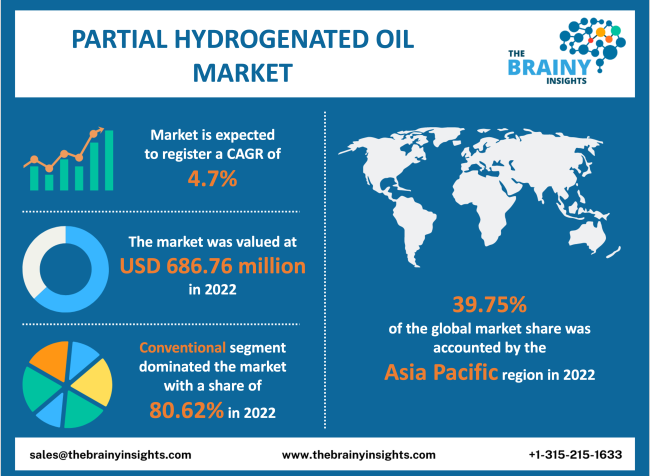
The global partial hydrogenated oil market was valued at USD 686.76 million in 2022, increasing at a CAGR of 4.7% from 2022 to 2030 and is anticipated to reach USD 993.93 million by 2030. Asia-Pacific is anticipated to grow the fastest during the forecast period. The partial hydrogenated oil industry was positively affected by the COVID-19 epidemic as people were more used to processed food during covid. Based on one of the studies, body skincare products increased significantly in sales during the lockdown.
Partially Hydrogenated Oil (PHO) is a type of vegetable oil which is in solid form at room temperature. In making PHO, the vegetable oil is put in the existence of a catalyst and hydrogen. In this process, the C=C bonds break, which forms a solid fat that raises the melting point of the component. It results in incomplete hydrogenation that partly converts the oil to trans isomers, creating trans fat. Partial Hydrogenated Oil is broadly used in all pastries, Cookies and frosting applications, and the bakers are looking for its replacement and using alternatives. Palm Kernel oil is the most used alternative for PHOs as it offers similar structural integrity. Also, FDA is no longer considering PHO as safe. The manufacturers cannot add partially hydrogenated oil to food as of June 18, 2018. But some food still contains PHO at present. These foods are bakery items, microwaveable popcorn, vegetable shortening, vegetable oil, pre-made pizza dough, frosting, non-dairy coffee creamers, and potato and corn chips, among others. The World Health Organization (WHO) has reached the governments to eliminate trans-fatty acids from the Global food supply by 2023, and many countries have already started following. This would reduce the use of PHO.
Get an overview of this study by requesting a free sample
For example, in October 2016, Bunge North America boosted its oil line by acquiring Whole Harvest Foods, LLC. The latter organization uses cottonseed, expeller-pressed canola and soy oils to produce the products like pan sprays, frying oils and liquid butter alternatives. This acquisition complements Bunge’s line of trans-fat-free oils when the organization is looking for an option to comply with the FDA's decision on partially hydrogenated oils. This is helping the organization to expand its market share.
For example, in September 2021, Louis Dreyfus Company (LDC) stated an upturn in cotton and biofuel, which increased 4.2% in its shipped volume in the first half of the year. Other products like grains and oilseeds also perform well. These factors are eventually driving the partially hydrogenated oils market, also.
A surge in the food & beverage sector: The food and beverages sector comprises many segments like food additives, functional food and beverages, packaged foods, soft drinks, energy drinks, and many more. The sector is propelling mainly because of developing countries like China, India, and Brazil, as the economies of these countries are improving, and more people are getting lifted to the middle class. Based on one of the studies, food and beverage were around 10 per cent of the world GDP in 2018. All these factors would, in turn, drive the partly hydrogenated oil market.
Growing beauty industry: The beauty and cosmetic industry is expanding all across the world. Based on one of the studies in 2017, in the US, the beauty sector employs around 670,000 people, and job growth is increasing by 13%. Based on another study, the beauty industry was worth around USD 532.43 billion in 2017, and by 2023, it would reach around USD 805.61 billion. Skincare is estimated to hold the highest market share of around 23.7% of the total revenue, and similarly, cosmetics would hold around 14.6%. The main driver for the expansion is the millennial population. All these factors are driving the partly hydrogenated oil market.
Adverse effects on health: PHO leads to trans-fat, which reduces the levels of high-density lipoprotein (HDL) cholesterol, also known as good cholesterol. The surge in the LDL cholesterol and decrease in the HDL cholesterol can increase the risk of the person developing heart attack, stroke and type 2 diabetes. High in trans fats, it increases the risk of cardiovascular disease, raises cholesterol and triglycerides and increases the inflammation response in the body. The high level of trans fats is also associated with worsening memory function. All these factors are acting as a restraint for the market.
Rise in social media culture: The growing social media, especially the image-based social network such as Instagram, is propelling the cosmetic and personal care industry. This is because the visual medium is considered ideal for beauty brands. It helps in utilizing the visual potential of the products. Social media like Instagram have made the brand make their stronger image and interact with the consumer more directly. It also helps them create a completely new marketing category, like the influencers, which makes them a fully-fledged entrepreneurs. For instance, Kylie Jenner is considered the most famous woman presently. She has been crowned the world’s youngest self-made billionaire; all of this is due to her successful makeup line. All these factors would eventually drive the partly hydrogenated oil market in the forecasting period as millennials are very much active on social media and very much conscious about their looks and hair.
Availability of substitute products: There are substitutes in the market, like natural unsaturated liquid vegetable oils. The best alternative to using partially hydrogenated fats is the application of unsaturated liquid vegetable oils like corn, olive, canola or soy oils. Hence there are substitutes present, which is acting as a challenge for the partly hydrogenated oil market.
The regions analyzed for the market include Europe, South America, Asia Pacific, North America, the Middle East, and Africa. Asia Pacific emerged as the largest market for the global partial hydrogenated oil market, with a 39.75% share of the market revenue in 2022. In the region, the major source of TFA is vegetable oil products like bakery fats, vanaspati ghee, and shortening made using partial hydrogenation methods. In India also cost, availability and stability of oils are important for consideration. The Food and Safety Standard Authority of India developed a trans-fat limit of 10% of total fat in vegetable oils, vegetable fat and hydrogenated vegetable oil. It then further decreased to 5% in 2017. Also, it introduced mandatory nutrition labelling for trans fats. If any partially hydrogenated fat is used in China, its level must be highlighted. The North America is emerged as the second largest market for the global partial hydrogenated oil market. Several different products like hair care items, lipsticks and lotions contain this oil. Despite several risks, many cosmetic and personal care items still consist of partly hydrogenated oil. Partially hydrogenated soyabean oil has its application in pharmaceutical applications. It is propelling the growth in the biodiesel sector.
Asia Pacific Region Partial Hydrogenated Oil Market Share in 2022 - 39.75%
www.thebrainyinsights.com
Check the geographical analysis of this market by requesting a free sample
The nature segment is divided into conventional and organic. The conventional segment dominated, with a market share of around 80.62% in 2022. For converting soybean, cottonseed and other liquid oil to solid, the oil is heated in the presence of hydrogen and the catalyst. The hydrogenation removes part of the double bonds and converts some unsaturated fatty acids into saturated fatty acids. This process led to the solidification of oil and increased the melting point, thus improving the oxidation resistance. Moreover, in the partial hydrogenation process, the trans-fatty acids are formed because of cis/trans conversion on the positional shift in the fatty acid chain.
The application segment is divided into surface coatings and lubricants. In 2022, the lubricants segment dominated the market with the largest market share of 56.48% and market revenue of 387.88 million. This growth is attributed to the hydrogenated vegetable oil's broad applications, and it is used as tablet and capsule lubricants, tablet binders (matrix formers) and suppository bases.
The end-user segment is divided into food and non-food. In 2022, the food segment dominated the market with the largest market share of 51.67% and market revenue of 354.84 million. This growth is attributed to the demand for vegetable oil, microwaveable popcorn, vegetable shortening, non-dairy coffee creamers, potato and corn chips, bakery items and pre-made pizza dough and frosting. Manufacturers initially used PHO to increase the shelf life of food, add flavour, and save money. It is an inexpensive substitute for lard and butter as it improves the food texture.
The distribution channel segment is divided into online and offline. In 2022, the offline segment dominated the market, accounting for around 78.63% of global revenue. More capital is getting invested in focusing on detecting and assessing the qualities and attributes of partially hydrogenated oil.
| Attribute | Description |
|---|---|
| Market Size | Revenue (USD Million) |
| Market size value in 2022 | USD 686.76 Million |
| Market size value in 2030 | USD 993.93 Million |
| CAGR (2022 to 2030) | 4.7% |
| Historical data | 2019-2020 |
| Base Year | 2021 |
| Forecast | 2022-2030 |
| Segments | Key Segments are nature, application, end user, distribution channel and regions |
| Regional Segments | The key regions are South America, North America, Europe, Asia Pacific, and Middle East & Africa. |
As per The Brainy Insights, the size of the partial hydrogenated oil market was valued at USD 686.76 million in 2022 to USD 993.93 million by 2030.
The global partial hydrogenated oil market is growing at a CAGR of 4.7% during the forecast period 2022-2030.
The Asia Pacific region emerged as the largest market for partial hydrogenated oil.
A surge in the food & beverage sector and growing beauty industry will influence the market's growth.
1. Introduction
1.1. Objectives of the Study
1.2. Market Definition
1.3. Research Scope
1.4. Currency
1.5. Key Target Audience
2. Research Methodology and Assumptions
3. Executive Summary
4. Premium Insights
4.1. Porter’s Five Forces Analysis
4.2. Value Chain Analysis
4.3. Top Investment Pockets
4.3.1. Market Attractiveness Analysis by Nature
4.3.2. Market Attractiveness Analysis by Application
4.3.3. Market Attractiveness Analysis by End User
4.3.4. Market Attractiveness Analysis by Distribution Channel
4.3.5. Market Attractiveness Analysis by Region
4.4. Industry Trends
5. Market Dynamics
5.1. Market Evaluation
5.2. Drivers
5.2.1. A surge in the food & beverage sector
5.2.2. Growing beauty industry
5.3. Restraints
5.3.1. Adverse effects on health
5.4. Opportunities
5.4.1. Rise in Social Media culture
5.5. Challenges
5.5.1. Availability of substitute products
6. Global Partial Hydrogenated Oil Market Analysis and Forecast, By Nature
6.1. Segment Overview
6.2. Conventional
6.3. Organic
7. Global Partial Hydrogenated Oil Market Analysis and Forecast, By Application
7.1. Segment Overview
7.2. Surface Coatings
7.3. Lubricants
8. Global Partial Hydrogenated Oil Market Analysis and Forecast, By End User
8.1. Segment Overview
8.2. Food
8.3. Non-Food
9. Global Partial Hydrogenated Oil Market Analysis and Forecast, By Distribution Channel
9.1. Segment Overview
9.2. Online
9.3. Offline
10. Global Partial Hydrogenated Oil Market Analysis and Forecast, By Regional Analysis
10.1. Segment Overview
10.2. North America
10.2.1. U.S.
10.2.2. Canada
10.2.3. Mexico
10.3. Europe
10.3.1. Germany
10.3.2. France
10.3.3. U.K.
10.3.4. Italy
10.3.5. Spain
10.4. Asia-Pacific
10.4.1. Japan
10.4.2. China
10.4.3. India
10.5. South America
10.5.1. Brazil
10.6. Middle East and Africa
10.6.1. UAE
10.6.2. South Africa
11. Global Partial Hydrogenated Oil Market-Competitive Landscape
11.1. Overview
11.2. Market Share of Key Players in the Partial Hydrogenated Oil Market
11.2.1. Global Company Market Share
11.2.2. North America Company Market Share
11.2.3. Europe Company Market Share
11.2.4. APAC Company Market Share
11.3. Competitive Situations and Trends
11.3.1. Product Launches and Developments
11.3.2. Partnerships, Collaborations, and Agreements
11.3.3. Mergers & Acquisitions
11.3.4. Expansions
12. Company Profiles
12.1. ADM
12.1.1. Business Overview
12.1.2. Company Snapshot
12.1.3. Company Market Share Analysis
12.1.4. Company Product Portfolio
12.1.5. Recent Developments
12.1.6. SWOT Analysis
12.2. Bunge Limited
12.2.1. Business Overview
12.2.2. Company Snapshot
12.2.3. Company Market Share Analysis
12.2.4. Company Product Portfolio
12.2.5. Recent Developments
12.2.6. SWOT Analysis
12.3. Louis Dreyfus Company (LDC)
12.3.1. Business Overview
12.3.2. Company Snapshot
12.3.3. Company Market Share Analysis
12.3.4. Company Product Portfolio
12.3.5. Recent Developments
12.3.6. SWOT Analysis
12.4. Rein OIl
12.4.1. Business Overview
12.4.2. Company Snapshot
12.4.3. Company Market Share Analysis
12.4.4. Company Product Portfolio
12.4.5. Recent Developments
12.4.6. SWOT Analysis
List of Table
1. Global Partial Hydrogenated Oil Market, By Nature, 2019-2030 (USD Billion)
2. Global Conventional Partial Hydrogenated Oil Market, By Region, 2019-2030 (USD Billion)
3. Global Organic Partial Hydrogenated Oil Market, By Region, 2019-2030 (USD Billion)
4. Global Partial Hydrogenated Oil Market, By Application, 2019-2030 (USD Billion)
5. Global Surface Coatings Partial Hydrogenated Oil Market, By Region, 2019-2030 (USD Billion)
6. Global Lubricants Partial Hydrogenated Oil Market, By Region, 2019-2030 (USD Billion)
7. Global Partial Hydrogenated Oil Market, By End User, 2019-2030 (USD Billion)
8. Global Food Partial Hydrogenated Oil Market, By Region, 2019-2030 (USD Billion)
9. Global Non-Food Partial Hydrogenated Oil Market, By Region, 2019-2030 (USD Billion)
10. Global Partial Hydrogenated Oil Market, By Distribution Channel, 2019-2030 (USD Billion)
11. Global Online Partial Hydrogenated Oil Market, By Region, 2019-2030 (USD Billion)
12. Global Offline Partial Hydrogenated Oil Market, By Region, 2019-2030 (USD Billion)
13. Global Partial Hydrogenated Oil Market, By Region, 2019-2030 (USD Billion)
14. North America Partial Hydrogenated Oil Market, By Nature, 2019-2030 (USD Billion)
15. North America Partial Hydrogenated Oil Market, By Application, 2019-2030 (USD Billion)
16. North America Partial Hydrogenated Oil Market, By End User, 2019-2030 (USD Billion)
17. North America Partial Hydrogenated Oil Market, By Distribution Channel, 2019-2030 (USD Billion)
18. U.S. Partial Hydrogenated Oil Market, By Nature, 2019-2030 (USD Billion)
19. U.S. Partial Hydrogenated Oil Market, By Application, 2019-2030 (USD Billion)
20. U.S. Partial Hydrogenated Oil Market, By End User, 2019-2030 (USD Billion)
21. U.S. Partial Hydrogenated Oil Market, By Distribution Channel, 2019-2030 (USD Billion)
22. Canada Partial Hydrogenated Oil Market, By Nature, 2019-2030 (USD Billion)
23. Canada Partial Hydrogenated Oil Market, By Application, 2019-2030 (USD Billion)
24. Canada Partial Hydrogenated Oil Market, By End User, 2019-2030 (USD Billion)
25. Canada Partial Hydrogenated Oil Market, By Distribution Channel, 2019-2030 (USD Billion)
26. Mexico Partial Hydrogenated Oil Market, By Nature, 2019-2030 (USD Billion)
27. Mexico Partial Hydrogenated Oil Market, By Application, 2019-2030 (USD Billion)
28. Mexico Partial Hydrogenated Oil Market, By End User, 2019-2030 (USD Billion)
29. Mexico Partial Hydrogenated Oil Market, By Distribution Channel, 2019-2030 (USD Billion)
30. Europe Partial Hydrogenated Oil Market, By Nature, 2019-2030 (USD Billion)
31. Europe Partial Hydrogenated Oil Market, By Application, 2019-2030 (USD Billion)
32. Europe Partial Hydrogenated Oil Market, By End User, 2019-2030 (USD Billion)
33. Europe Partial Hydrogenated Oil Market, By Distribution Channel, 2019-2030 (USD Billion)
34. Germany Partial Hydrogenated Oil Market, By Nature, 2019-2030 (USD Billion)
35. Germany Partial Hydrogenated Oil Market, By Application, 2019-2030 (USD Billion)
36. Germany Partial Hydrogenated Oil Market, By End User, 2019-2030 (USD Billion)
37. Germany Partial Hydrogenated Oil Market, By Distribution Channel, 2019-2030 (USD Billion)
38. France Partial Hydrogenated Oil Market, By Nature, 2019-2030 (USD Billion)
39. France Partial Hydrogenated Oil Market, By Application, 2019-2030 (USD Billion)
40. France Partial Hydrogenated Oil Market, By End User, 2019-2030 (USD Billion)
41. France Partial Hydrogenated Oil Market, By Distribution Channel, 2019-2030 (USD Billion)
42. U.K. Partial Hydrogenated Oil Market, By Nature, 2019-2030 (USD Billion)
43. U.K. Partial Hydrogenated Oil Market, By Application, 2019-2030 (USD Billion)
44. U.K. Partial Hydrogenated Oil Market, By End User, 2019-2030 (USD Billion)
45. U.K. Partial Hydrogenated Oil Market, By Distribution Channel, 2019-2030 (USD Billion)
46. Italy Partial Hydrogenated Oil Market, By Nature, 2019-2030 (USD Billion)
47. Italy Partial Hydrogenated Oil Market, By Application, 2019-2030 (USD Billion)
48. Italy Partial Hydrogenated Oil Market, By End User, 2019-2030 (USD Billion)
49. Italy Partial Hydrogenated Oil Market, By Distribution Channel, 2019-2030 (USD Billion)
50. Spain Partial Hydrogenated Oil Market, By Nature, 2019-2030 (USD Billion)
51. Spain Partial Hydrogenated Oil Market, By Application, 2019-2030 (USD Billion)
52. Spain Partial Hydrogenated Oil Market, By End User, 2019-2030 (USD Billion)
53. Spain Partial Hydrogenated Oil Market, By Distribution Channel, 2019-2030 (USD Billion)
54. Asia Pacific Partial Hydrogenated Oil Market, By Nature, 2019-2030 (USD Billion)
55. Asia Pacific Partial Hydrogenated Oil Market, By Application, 2019-2030 (USD Billion)
56. Asia Pacific Partial Hydrogenated Oil Market, By End User, 2019-2030 (USD Billion)
57. Asia Pacific Partial Hydrogenated Oil Market, By Distribution Channel, 2019-2030 (USD Billion)
58. Japan Partial Hydrogenated Oil Market, By Nature, 2019-2030 (USD Billion)
59. Japan Partial Hydrogenated Oil Market, By Application, 2019-2030 (USD Billion)
60. Japan Partial Hydrogenated Oil Market, By End User, 2019-2030 (USD Billion)
61. Japan Partial Hydrogenated Oil Market, By Distribution Channel, 2019-2030 (USD Billion)
62. China Partial Hydrogenated Oil Market, By Nature, 2019-2030 (USD Billion)
63. China Partial Hydrogenated Oil Market, By Application, 2019-2030 (USD Billion)
64. China Partial Hydrogenated Oil Market, By End User, 2019-2030 (USD Billion)
65. China Partial Hydrogenated Oil Market, By Distribution Channel, 2019-2030 (USD Billion)
66. India Partial Hydrogenated Oil Market, By Nature, 2019-2030 (USD Billion)
67. India Partial Hydrogenated Oil Market, By Application, 2019-2030 (USD Billion)
68. India Partial Hydrogenated Oil Market, By End User, 2019-2030 (USD Billion)
69. India Partial Hydrogenated Oil Market, By Distribution Channel, 2019-2030 (USD Billion)
70. South America Partial Hydrogenated Oil Market, By Nature, 2019-2030 (USD Billion)
71. South America Partial Hydrogenated Oil Market, By Application, 2019-2030 (USD Billion)
72. South America Partial Hydrogenated Oil Market, By End User, 2019-2030 (USD Billion)
73. South America Partial Hydrogenated Oil Market, By Distribution Channel, 2019-2030 (USD Billion)
74. Brazil Partial Hydrogenated Oil Market, By Nature, 2019-2030 (USD Billion)
75. Brazil Partial Hydrogenated Oil Market, By Application, 2019-2030 (USD Billion)
76. Brazil Partial Hydrogenated Oil Market, By End User, 2019-2030 (USD Billion)
77. Brazil Partial Hydrogenated Oil Market, By Distribution Channel, 2019-2030 (USD Billion)
78. Middle East and Africa Partial Hydrogenated Oil Market, By Nature, 2019-2030 (USD Billion)
79. Middle East and Africa Partial Hydrogenated Oil Market, By Application, 2019-2030 (USD Billion)
80. Middle East and Africa Partial Hydrogenated Oil Market, By End User, 2019-2030 (USD Billion)
81. Middle East and Africa Partial Hydrogenated Oil Market, By Distribution Channel, 2019-2030 (USD Billion)
82. UAE Partial Hydrogenated Oil Market, By Nature, 2019-2030 (USD Billion)
83. UAE Partial Hydrogenated Oil Market, By Application, 2019-2030 (USD Billion)
84. UAE Partial Hydrogenated Oil Market, By End User, 2019-2030 (USD Billion)
85. UAE Partial Hydrogenated Oil Market, By Distribution Channel, 2019-2030 (USD Billion)
86. South Africa Partial Hydrogenated Oil Market, By Nature, 2019-2030 (USD Billion)
87. South Africa Partial Hydrogenated Oil Market, By Application, 2019-2030 (USD Billion)
88. South Africa Partial Hydrogenated Oil Market, By End User, 2019-2030 (USD Billion)
89. South Africa Partial Hydrogenated Oil Market, By Distribution Channel, 2019-2030 (USD Billion)
List of Figures
1. Global Partial Hydrogenated Oil Market Segmentation
2. Partial Hydrogenated Oil Market: Research Methodology
3. Market Size Estimation Methodology: Bottom-Up Approach
4. Market Size Estimation Methodology: Top-Down Approach
5. Data Triangulation
6. Porter’s Five Forces Analysis
7. Value Chain Analysis
8. Global Partial Hydrogenated Oil Market Attractiveness Analysis by Nature
9. Global Partial Hydrogenated Oil Market Attractiveness Analysis by Application
10. Global Partial Hydrogenated Oil Market Attractiveness Analysis by End User
11. Global Partial Hydrogenated Oil Market Attractiveness Analysis by Distribution Channel
12. Global Partial Hydrogenated Oil Market Attractiveness Analysis by Region
13. Global Partial Hydrogenated Oil Market: Dynamics
14. Global Partial Hydrogenated Oil Market Share by Nature (2022 & 2030)
15. Global Partial Hydrogenated Oil Market Share by Application (2022 & 2030)
16. Global Partial Hydrogenated Oil Market Share by End User (2022 & 2030)
17. Global Partial Hydrogenated Oil Market Share by Distribution Channel (2022 & 2030)
18. Global Partial Hydrogenated Oil Market Share by Regions (2022 & 2030)
19. Global Partial Hydrogenated Oil Market Share by Company (2021)
This study forecasts revenue at global, regional, and country levels from 2019 to 2030. The Brainy Insights has segmented the global partial hydrogenated oil market based on below-mentioned segments:
Global Partial Hydrogenated Oil Market by Nature:
Global Partial Hydrogenated Oil Market by Application:
Global Partial Hydrogenated Oil Market by End User:
Global Partial Hydrogenated Oil Market by Distribution Channel:
Global Partial Hydrogenated Oil Market by Region:
Research has its special purpose to undertake marketing efficiently. In this competitive scenario, businesses need information across all industry verticals; the information about customer wants, market demand, competition, industry trends, distribution channels etc. This information needs to be updated regularly because businesses operate in a dynamic environment. Our organization, The Brainy Insights incorporates scientific and systematic research procedures in order to get proper market insights and industry analysis for overall business success. The analysis consists of studying the market from a miniscule level wherein we implement statistical tools which helps us in examining the data with accuracy and precision.
Our research reports feature both; quantitative and qualitative aspects for any market. Qualitative information for any market research process are fundamental because they reveal the customer needs and wants, usage and consumption for any product/service related to a specific industry. This in turn aids the marketers/investors in knowing certain perceptions of the customers. Qualitative research can enlighten about the different product concepts and designs along with unique service offering that in turn, helps define marketing problems and generate opportunities. On the other hand, quantitative research engages with the data collection process through interviews, e-mail interactions, surveys and pilot studies. Quantitative aspects for the market research are useful to validate the hypotheses generated during qualitative research method, explore empirical patterns in the data with the help of statistical tools, and finally make the market estimations.
The Brainy Insights offers comprehensive research and analysis, based on a wide assortment of factual insights gained through interviews with CXOs and global experts and secondary data from reliable sources. Our analysts and industry specialist assume vital roles in building up statistical tools and analysis models, which are used to analyse the data and arrive at accurate insights with exceedingly informative research discoveries. The data provided by our organization have proven precious to a diverse range of companies, facilitating them to address issues such as determining which products/services are the most appealing, whether or not customers use the product in the manner anticipated, the purchasing intentions of the market and many others.
Our research methodology encompasses an idyllic combination of primary and secondary initiatives. Key phases involved in this process are listed below:

The phase involves the gathering and collecting of market data and its related information with the help of different sources & research procedures.

The data procurement stage involves in data gathering and collecting through various data sources.
This stage involves in extensive research. These data sources includes:
Purchased Database: Purchased databases play a crucial role in estimating the market sizes irrespective of the domain. Our purchased database includes:
Primary Research: The Brainy Insights interacts with leading companies and experts of the concerned domain to develop the analyst team’s market understanding and expertise. It improves and substantiates every single data presented in the market reports. Primary research mainly involves in telephonic interviews, E-mail interactions and face-to-face interviews with the raw material providers, manufacturers/producers, distributors, & independent consultants. The interviews that we conduct provides valuable data on market size and industry growth trends prevailing in the market. Our organization also conducts surveys with the various industry experts in order to gain overall insights of the industry/market. For instance, in healthcare industry we conduct surveys with the pharmacists, doctors, surgeons and nurses in order to gain insights and key information of a medical product/device/equipment which the customers are going to usage. Surveys are conducted in the form of questionnaire designed by our own analyst team. Surveys plays an important role in primary research because surveys helps us to identify the key target audiences of the market. Additionally, surveys helps to identify the key target audience engaged with the market. Our survey team conducts the survey by targeting the key audience, thus gaining insights from them. Based on the perspectives of the customers, this information is utilized to formulate market strategies. Moreover, market surveys helps us to understand the current competitive situation of the industry. To be precise, our survey process typically involve with the 360 analysis of the market. This analytical process begins by identifying the prospective customers for a product or service related to the market/industry to obtain data on how a product/service could fit into customers’ lives.

Secondary Research: The secondary data sources includes information published by the on-profit organizations such as World bank, WHO, company fillings, investor presentations, annual reports, national government documents, statistical databases, blogs, articles, white papers and others. From the annual report, we analyse a company’s revenue to understand the key segment and market share of that organization in a particular region. We analyse the company websites and adopt the product mapping technique which is important for deriving the segment revenue. In the product mapping method, we select and categorize the products offered by the companies catering to domain specific market, deduce the product revenue for each of the companies so as to get overall estimation of the market size. We also source data and analyses trends based on information received from supply side and demand side intermediaries in the value chain. The supply side denotes the data gathered from supplier, distributor, wholesaler and the demand side illustrates the data gathered from the end customers for respective market domain.

The supply side for a domain specific market is analysed by:
The demand side for the market is estimated through:
In-house Library: Apart from these third-party sources, we have our in-house library of qualitative and quantitative information. Our in-house database includes market data for various industry and domains. These data are updated on regular basis as per the changing market scenario. Our library includes, historic databases, internal audit reports and archives.
Sometimes there are instances where there is no metadata or raw data available for any domain specific market. For those cases, we use our expertise to forecast and estimate the market size in order to generate comprehensive data sets. Our analyst team adopt a robust research technique in order to produce the estimates:
Data Synthesis: This stage involves the analysis & mapping of all the information obtained from the previous step. It also involves in scrutinizing the data for any discrepancy observed while data gathering related to the market. The data is collected with consideration to the heterogeneity of sources. Robust scientific techniques are in place for synthesizing disparate data sets and provide the essential contextual information that can orient market strategies. The Brainy Insights has extensive experience in data synthesis where the data passes through various stages:


Market Deduction & Formulation: The final stage comprises of assigning data points at appropriate market spaces so as to deduce feasible conclusions. Analyst perspective & subject matter expert based holistic form of market sizing coupled with industry analysis also plays a crucial role in this stage.
This stage involves in finalization of the market size and numbers that we have collected from data integration step. With data interpolation, it is made sure that there is no gap in the market data. Successful trend analysis is done by our analysts using extrapolation techniques, which provide the best possible forecasts for the market.
Data Validation & Market Feedback: Validation is the most important step in the process. Validation & re-validation via an intricately designed process helps us finalize data-points to be used for final calculations.

The Brainy Insights interacts with leading companies and experts of the concerned domain to develop the analyst team’s market understanding and expertise. It improves and substantiates every single data presented in the market reports. The data validation interview and discussion panels are typically composed of the most experienced industry members. The participants include, however, are not limited to:
Moreover, we always validate our data and findings through primary respondents from all the major regions we are working on.


Free Customization
Fortune 500 Clients
Free Yearly Update On Purchase Of Multi/Corporate License
Companies Served Till Date