- +1-315-215-1633
- sales@thebrainyinsights.com

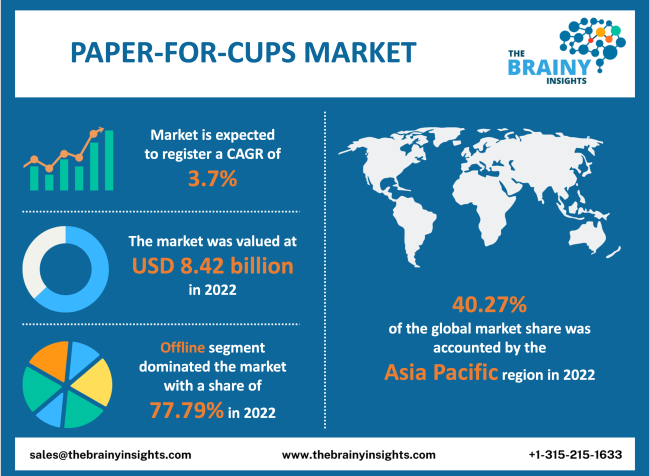
The global paper-for-cups market was valued at USD 8.42 billion in 2022, increasing at a CAGR of 3.7% from 2022 to 2030 and is anticipated to reach USD 11.27 billion by 2030. Asia-Pacific is expected to grow the fastest during the forecast period. The paper-for-cups industry was positively affected by the COVID-19 epidemic owing to home delivery and parcel services which are allowed by many countries.
Paper cups are disposable cups which are made of paper. It is lined with plastic or wax to prevent the liquid from absorbing the paper. These cups are produced using food-grade paper that is hygienic and capable of storing hot and cold liquid for a long. The surge in awareness is constantly changing the lifestyle of people, and hence the demand for paper cups has increased significantly every year. There are generally three stages in the manufacturing of paper cups. The cup is shaped and formed in the first stage, the paper's sidewall paper. The second stage involves shaping the paper cup's bottom paper, which is then joined with the shaped sidewall. In the third and last stage, the paper cup is pre-heated, and then the bottom/rim curling is accomplished to complete the paper cup manufacturing. The paper cup has good potential in educational institutions, canteens, IT companies, industrial canteens, fast foods, restaurants, tea shops, catering people, paper product dealers and supermarkets. The paper cups can be broadly used in tea shops, hotels and restaurants, ice cream parlours, coffee shops, soft drink parlours, milk parlours, railways and trains, picnic & tours, function and marriage parties, office, canteens, airlines and households among others. These disposable paper cups are biodegradable and hence make them more environment friendly compared to other types of disposable paper cups like those which are made of plastic. Moreover, plastic paper cups are prone to contaminate hot containments, but paper cups are safer for even hot beverage consumption. These paper cups are in several forms and sizes, along with customizable designs that make them more appealing to the market.
Get an overview of this study by requesting a free sample
For example, in January 2017, Nippon Paper Industries Co. Ltd of Japan entered the Indian Market as it acquired the biggest local paper cup manufacturing organization, which BK Modi Group owns. This acquisition helps in its overseas expansion initiative for the paper-containing process.
For example, in March 2015, Huhtamaki signed an agreement to acquire Butterworth Paper Cups. This acquisition helped the organization in expanding its food service manufacturing base to Southeast Asia and thus strengthened its base in Singapore, Malaysia and other South Asian Markets.
Growing demand for paper cups in offices and restaurants: Paper cups are eco-friendly and have huge demand in the market as several varieties are available, such as single wall paper cups, double wall paper cups and embossed paper cups, among others. Paper cups are used not only for serving hot and cold drinks like coffee or tea but also for holding food like ice cream and soup. These have become common in any office, fast food restaurant, big sporting event or music festival. Moreover there is a surge in the number of customers who prefers eco-friendly products; hence it is boosting the paper-for-cups market. Its demand has increased due to the growing influence of several trends of beverages like coffee, infusions and shakes, among others. All these factors are eventually driving the paper-for-cups market.
Fluctuation in the price of raw material: The demand from the food & beverage sector is propelling the market. However, the fluctuation in the price of raw materials impacts the industry and its strategy as the unstable price of the raw material, and high recycling cost impacts the organization involved in producing eco-friendly paper cups and other products. The impact on operations could lead to fluctuation in the market's production and profit margin. The organization requires the proper profit margin to survive in the market. Thus, the fluctuation in the price of raw material acts as a restraint for the market.
Rapid urbanization and sedentary lifestyle: Rapid urbanization, along with a sedentary lifestyle and on-the-go food culture, is anticipated to eventually drive the paper-for-cup market soon. Food and beverage organizations have started using and putting more emphasis on recyclable packaging and products. Moreover, growing environmental concern due to the growing use of plastic packaging products is also growing the eco-friendly packaging market. The ban on plastics and the surge in consumer awareness about the environmental impact due to plastic disposables have eventually led to the growth of the paper-for-cup market.
Substitute Products: The threat of substitutes is low as the demand for paper cups is growing. People have become much more aware of the environment, so paper cup demand would grow. But there are substitutes present, like plastic cups and mud cups. These are still acting as a challenge for the market.
The regions analyzed for the market include Europe, South America, Asia Pacific, North America, the Middle East, and Africa. Asia Pacific emerged as the largest market for the global paper-for-cups market, with a 40.27% share of the market revenue in 2022. As customers are becoming more health conscious, the Asia Pacific region has a dominant global position in the paper cup industry. This led to the huge paper cup market in institutions, dispensaries and railway stations. It is estimated that the use of disposable cups is anticipated to grow further in the future. In emerging economies, the demand is increasing. The sector is driven due to the demand for food service disposables. This is attributed to the development of online food ordering and home delivery services. North America emerged as the second largest market for the global paper-for-cups market. These cups are lightweight, disposable and portable. As consumers are getting more aware towards the environment, biodegradable cups will be preferred over disposable containers made of non-biodegradable material like plastic. Moreover, the stringent government regulations encourage the recycling of paper cups, strengthening the paper cup business.
Asia Pacific Region Paper-for-cups Market Share in 2022 - 40.27%
www.thebrainyinsights.com
Check the geographical analysis of this market by requesting a free sample
The type segment is divided into air pocket insulated, poly-coated paper, wax-coated paper and others. The poly-coated paper segment dominated, with a market share of around 38.47% in 2022. This growth is attributed to high demand from the food & beverage sector because of the growing demand for packaged food & beverages. Consumers prefer paper cups as they are lightweight and easy to dispose of. The recent trend like home delivery and takeaway services in the hospitality sector, like the restaurant industry, is also propelling the market's growth.
The application segment is divided into hot paper cups and cold paper cups. In 2022, hot paper cups segment dominated the market with the largest market share of 64.64% and market revenue of 5.44 billion. Paper cups are getting used commonly for serving hot and cold beverages. For instance, tea shops in the commercial location are broadly using paper cups. Paper cups are the eco-friendly alternative material to disposable plastic cups, which are used for drinking coffee, tea, cola, soft drinks, fruit juices etc.
The end user segment is divided into residential, coffee and tea shops, educational and offices institution, fast food shops and others. In 2022, coffee and tea shops segment dominated the market with the largest market share of 38.20% and market revenue of 3.21 billion. Paper cups can be broadly used in tea shops. Moreover, plastic paper cups are prone to contaminate hot containments, but paper cups are safer for even hot beverage consumption.
The distribution channel segment is divided into online and offline. In 2022, the offline segment dominated the market, accounting for around 77.79% of global revenue. Based on one of the studies globally, around 497 Billion throwaway cups were estimated to be consumed by 2020. It is estimated that in the future, the use of disposable cups is anticipated to grow further.
| Attribute | Description |
|---|---|
| Market Size | Revenue (USD Billion) |
| Market size value in 2022 | USD 8.42 Billion |
| Market size value in 2030 | USD 11.27 Billion |
| CAGR (2022 to 2030) | 3.7% |
| Historical data | 2019-2020 |
| Base Year | 2021 |
| Forecast | 2022-2030 |
| Segments | Key Segments are type, application, end user, distribution channel and regions |
| Regional Segments | The key regions are South America, North America, Europe, Asia Pacific, and Middle East & Africa. |
As per The Brainy Insights, the size of the paper for cup market was valued at USD 8.42 billion in 2022 to USD 11.27 billion by 2030.
The global paper for cup market is growing at a CAGR of 3.7% during the forecast period 2022-2030.
The Asia Pacific region emerged as the largest market for paper for cup.
Growing demand for paper cups in offices and restaurants will influence the market's growth.
1. Introduction
1.1. Objectives of the Study
1.2. Market Definition
1.3. Research Scope
1.4. Currency
1.5. Key Target Audience
2. Research Methodology and Assumptions
3. Executive Summary
4. Premium Insights
4.1. Porter’s Five Forces Analysis
4.2. Value Chain Analysis
4.3. Top Investment Pockets
4.3.1. Market Attractiveness Analysis by Type
4.3.2. Market Attractiveness Analysis by Application
4.3.3. Market Attractiveness Analysis by End User
4.3.4. Market Attractiveness Analysis by Distribution Channel
4.3.5. Market Attractiveness Analysis by Region
4.4. Industry Trends
5. Market Dynamics
5.1. Market Evaluation
5.2. Drivers
5.2.1. Growing demand for paper cups in offices and restaurants
5.3. Restraints
5.3.1. Fluctuation in the price of raw material
5.4. Opportunities
5.4.1. Rapid urbanization and sedentary lifestyle
5.5. Challenges
5.5.1. Substitute products
6. Global Paper for Cup Market Analysis and Forecast, By Type
6.1. Segment Overview
6.2. Air Pocket Insulated
6.3. Poly-coated Paper
6.4. Wax-coated Paper
6.5. Others
7. Global Paper for Cup Market Analysis and Forecast, By Application
7.1. Segment Overview
7.2. Hot Paper Cups
7.3. Cold Paper Cups
8. Global Paper for Cup Market Analysis and Forecast, By End User
8.1. Segment Overview
8.2. Residential
8.3. Coffee and Tea Shops
8.4. Educational and Offices Institution
8.5. Fast Food Shops
8.6. Others
9. Global Paper for Cup Market Analysis and Forecast, By Distribution Channel
9.1. Segment Overview
9.2. Online
9.3. Offline
10. Global Paper for Cup Market Analysis and Forecast, By Regional Analysis
10.1. Segment Overview
10.2. North America
10.2.1. U.S.
10.2.2. Canada
10.2.3. Mexico
10.3. Europe
10.3.1. Germany
10.3.2. France
10.3.3. U.K.
10.3.4. Italy
10.3.5. Spain
10.4. Asia-Pacific
10.4.1. Japan
10.4.2. China
10.4.3. India
10.5. South America
10.5.1. Brazil
10.6. Middle East and Africa
10.6.1. UAE
10.6.2. South Africa
11. Global Paper for Cup Market-Competitive Landscape
11.1. Overview
11.2. Market Share of Key Players in the Paper for Cup Market
11.2.1. Global Company Market Share
11.2.2. North America Company Market Share
11.2.3. Europe Company Market Share
11.2.4. APAC Company Market Share
11.3. Competitive Situations and Trends
11.3.1. Product Launches and Developments
11.3.2. Partnerships, Collaborations, and Agreements
11.3.3. Mergers & Acquisitions
11.3.4. Expansions
12. Company Profiles
12.1. International Paper Company
12.1.1. Business Overview
12.1.2. Company Snapshot
12.1.3. Company Market Share Analysis
12.1.4. Company Product Portfolio
12.1.5. Recent Developments
12.1.6. SWOT Analysis
12.2. PT Bersaudara Inti Corpora
12.2.1. Business Overview
12.2.2. Company Snapshot
12.2.3. Company Market Share Analysis
12.2.4. Company Product Portfolio
12.2.5. Recent Developments
12.2.6. SWOT Analysis
12.3. Safepack
12.3.1. Business Overview
12.3.2. Company Snapshot
12.3.3. Company Market Share Analysis
12.3.4. Company Product Portfolio
12.3.5. Recent Developments
12.3.6. SWOT Analysis
12.4. Sunpro Group
12.4.1. Business Overview
12.4.2. Company Snapshot
12.4.3. Company Market Share Analysis
12.4.4. Company Product Portfolio
12.4.5. Recent Developments
12.4.6. SWOT Analysis
12.5. West Coast Paper Mills Limited (WCPM)
12.5.1. Business Overview
12.5.2. Company Snapshot
12.5.3. Company Market Share Analysis
12.5.4. Company Product Portfolio
12.5.5. Recent Developments
12.5.6. SWOT Analysis
12.6. MLM India Limited
12.6.1. Business Overview
12.6.2. Company Snapshot
12.6.3. Company Market Share Analysis
12.6.4. Company Product Portfolio
12.6.5. Recent Developments
12.6.6. SWOT Analysis
12.7. Savvy Packaging Pvt. Ltd.
12.7.1. Business Overview
12.7.2. Company Snapshot
12.7.3. Company Market Share Analysis
12.7.4. Company Product Portfolio
12.7.5. Recent Developments
12.7.6. SWOT Analysis
12.8. Evergreen Packaging
12.8.1. Business Overview
12.8.2. Company Snapshot
12.8.3. Company Market Share Analysis
12.8.4. Company Product Portfolio
12.8.5. Recent Developments
12.8.6. SWOT Analysis
12.9. Wenzhou Lansheng Paper Co. Ltd.
12.9.1. Business Overview
12.9.2. Company Snapshot
12.9.3. Company Market Share Analysis
12.9.4. Company Product Portfolio
12.9.5. Recent Developments
12.9.6. SWOT Analysis
12.10. Jagannath Industries Pvt. Ltd. (JIPL)
12.10.1. Business Overview
12.10.2. Company Snapshot
12.10.3. Company Market Share Analysis
12.10.4. Company Product Portfolio
12.10.5. Recent Developments
12.10.6. SWOT Analysis
12.11. Andhra Paper Limited (Subsidiary Of West Coast Paper Mills)
12.11.1. Business Overview
12.11.2. Company Snapshot
12.11.3. Company Market Share Analysis
12.11.4. Company Product Portfolio
12.11.5. Recent Developments
12.11.6. SWOT Analysis
12.12. Nordic Paper
12.12.1. Business Overview
12.12.2. Company Snapshot
12.12.3. Company Market Share Analysis
12.12.4. Company Product Portfolio
12.12.5. Recent Developments
12.12.6. SWOT Analysis
12.13. BillerudKorsnas AB
12.13.1. Business Overview
12.13.2. Company Snapshot
12.13.3. Company Market Share Analysis
12.13.4. Company Product Portfolio
12.13.5. Recent Developments
12.13.6. SWOT Analysis
12.14. Metsä Board (Subsidiary Of Metsä Group)
12.14.1. Business Overview
12.14.2. Company Snapshot
12.14.3. Company Market Share Analysis
12.14.4. Company Product Portfolio
12.14.5. Recent Developments
12.14.6. SWOT Analysis
List of Table
1. Global Paper for Cup Market, By Type, 2019-2030 (USD Billion)
2. Global Air Pocket Insulated, Paper for Cup Market, By Region, 2019-2030 (USD Billion)
3. Global Poly-coated Paper, Paper for Cup Market, By Region, 2019-2030 (USD Billion)
4. Global Wax-coated Paper, Paper for Cup Market, By Region, 2019-2030 (USD Billion)
5. Global Others, Paper for Cup Market, By Region, 2019-2030 (USD Billion)
6. Global Paper for Cup Market, By Application, 2019-2030 (USD Billion)
7. Global Hot Paper Cups Paper for Cup Market, By Region, 2019-2030 (USD Billion)
8. Global Cold Paper Cups Paper for Cup Market, By Region, 2019-2030 (USD Billion)
9. Global Paper for Cup Market, By End User, 2019-2030 (USD Billion)
10. Global Residential Paper for Cup Market, By Region, 2019-2030 (USD Billion)
11. Global Coffee and Tea Shops Paper for Cup Market, By Region, 2019-2030 (USD Billion)
12. Global Educational and Offices Institution Paper for Cup Market, By Region, 2019-2030 (USD Billion)
13. Global Fast Food Shops Paper for Cup Market, By Region, 2019-2030 (USD Billion)
14. Global Others Paper for Cup Market, By Region, 2019-2030 (USD Billion)
15. Global Paper for Cup Market, By Distribution Channel, 2019-2030 (USD Billion)
16. Global Online Paper for Cup Market, By Region, 2019-2030 (USD Billion)
17. Global Offline Paper for Cup Market, By Region, 2019-2030 (USD Billion)
18. Global Paper for Cup Market, By Region, 2019-2030 (USD Billion)
19. North America Paper for Cup Market, By Type, 2019-2030 (USD Billion)
20. North America Paper for Cup Market, By Application, 2019-2030 (USD Billion)
21. North America Paper for Cup Market, By End User, 2019-2030 (USD Billion)
22. North America Paper for Cup Market, By Distribution Channel, 2019-2030 (USD Billion)
23. U.S. Paper for Cup Market, By Type, 2019-2030 (USD Billion)
24. U.S. Paper for Cup Market, By Application, 2019-2030 (USD Billion)
25. U.S. Paper for Cup Market, By End User, 2019-2030 (USD Billion)
26. U.S. Paper for Cup Market, By Distribution Channel, 2019-2030 (USD Billion)
27. Canada Paper for Cup Market, By Type, 2019-2030 (USD Billion)
28. Canada Paper for Cup Market, By Application, 2019-2030 (USD Billion)
29. Canada Paper for Cup Market, By End User, 2019-2030 (USD Billion)
30. Canada Paper for Cup Market, By Distribution Channel, 2019-2030 (USD Billion)
31. Mexico Paper for Cup Market, By Type, 2019-2030 (USD Billion)
32. Mexico Paper for Cup Market, By Application, 2019-2030 (USD Billion)
33. Mexico Paper for Cup Market, By End User, 2019-2030 (USD Billion)
34. Mexico Paper for Cup Market, By Distribution Channel, 2019-2030 (USD Billion)
35. Europe Paper for Cup Market, By Type, 2019-2030 (USD Billion)
36. Europe Paper for Cup Market, By Application, 2019-2030 (USD Billion)
37. Europe Paper for Cup Market, By End User, 2019-2030 (USD Billion)
38. Europe Paper for Cup Market, By Distribution Channel, 2019-2030 (USD Billion)
39. Germany Paper for Cup Market, By Type, 2019-2030 (USD Billion)
40. Germany Paper for Cup Market, By Application, 2019-2030 (USD Billion)
41. Germany Paper for Cup Market, By End User, 2019-2030 (USD Billion)
42. Germany Paper for Cup Market, By Distribution Channel, 2019-2030 (USD Billion)
43. France Paper for Cup Market, By Type, 2019-2030 (USD Billion)
44. France Paper for Cup Market, By Application, 2019-2030 (USD Billion)
45. France Paper for Cup Market, By End User, 2019-2030 (USD Billion)
46. France Paper for Cup Market, By Distribution Channel, 2019-2030 (USD Billion)
47. U.K. Paper for Cup Market, By Type, 2019-2030 (USD Billion)
48. U.K. Paper for Cup Market, By Application, 2019-2030 (USD Billion)
49. U.K. Paper for Cup Market, By End User, 2019-2030 (USD Billion)
50. U.K. Paper for Cup Market, By Distribution Channel, 2019-2030 (USD Billion)
51. Italy Paper for Cup Market, By Type, 2019-2030 (USD Billion)
52. Italy Paper for Cup Market, By Application, 2019-2030 (USD Billion)
53. Italy Paper for Cup Market, By End User, 2019-2030 (USD Billion)
54. Italy Paper for Cup Market, By Distribution Channel, 2019-2030 (USD Billion)
55. Spain Paper for Cup Market, By Type, 2019-2030 (USD Billion)
56. Spain Paper for Cup Market, By Application, 2019-2030 (USD Billion)
57. Spain Paper for Cup Market, By End User, 2019-2030 (USD Billion)
58. Spain Paper for Cup Market, By Distribution Channel, 2019-2030 (USD Billion)
59. Asia Pacific Paper for Cup Market, By Type, 2019-2030 (USD Billion)
60. Asia Pacific Paper for Cup Market, By Application, 2019-2030 (USD Billion)
61. Asia Pacific Paper for Cup Market, By End User, 2019-2030 (USD Billion)
62. Asia Pacific Paper for Cup Market, By Distribution Channel, 2019-2030 (USD Billion)
63. Japan Paper for Cup Market, By Type, 2019-2030 (USD Billion)
64. Japan Paper for Cup Market, By Application, 2019-2030 (USD Billion)
65. Japan Paper for Cup Market, By End User, 2019-2030 (USD Billion)
66. Japan Paper for Cup Market, By Distribution Channel, 2019-2030 (USD Billion)
67. China Paper for Cup Market, By Type, 2019-2030 (USD Billion)
68. China Paper for Cup Market, By Application, 2019-2030 (USD Billion)
69. China Paper for Cup Market, By End User, 2019-2030 (USD Billion)
70. China Paper for Cup Market, By Distribution Channel, 2019-2030 (USD Billion)
71. India Paper for Cup Market, By Type, 2019-2030 (USD Billion)
72. India Paper for Cup Market, By Application, 2019-2030 (USD Billion)
73. India Paper for Cup Market, By End User, 2019-2030 (USD Billion)
74. India Paper for Cup Market, By Distribution Channel, 2019-2030 (USD Billion)
75. South America Paper for Cup Market, By Type, 2019-2030 (USD Billion)
76. South America Paper for Cup Market, By Application, 2019-2030 (USD Billion)
77. South America Paper for Cup Market, By End User, 2019-2030 (USD Billion)
78. South America Paper for Cup Market, By Distribution Channel, 2019-2030 (USD Billion)
79. Brazil Paper for Cup Market, By Type, 2019-2030 (USD Billion)
80. Brazil Paper for Cup Market, By Application, 2019-2030 (USD Billion)
81. Brazil Paper for Cup Market, By End User, 2019-2030 (USD Billion)
82. Brazil Paper for Cup Market, By Distribution Channel, 2019-2030 (USD Billion)
83. Middle East and Africa Paper for Cup Market, By Type, 2019-2030 (USD Billion)
84. Middle East and Africa Paper for Cup Market, By Application, 2019-2030 (USD Billion)
85. Middle East and Africa Paper for Cup Market, By End User, 2019-2030 (USD Billion)
86. Middle East and Africa Paper for Cup Market, By Distribution Channel, 2019-2030 (USD Billion)
87. UAE Paper for Cup Market, By Type, 2019-2030 (USD Billion)
88. UAE Paper for Cup Market, By Application, 2019-2030 (USD Billion)
89. UAE Paper for Cup Market, By End User, 2019-2030 (USD Billion)
90. UAE Paper for Cup Market, By Distribution Channel, 2019-2030 (USD Billion)
91. South Africa Paper for Cup Market, By Type, 2019-2030 (USD Billion)
92. South Africa Paper for Cup Market, By Application, 2019-2030 (USD Billion)
93. South Africa Paper for Cup Market, By End User, 2019-2030 (USD Billion)
94. South Africa Paper for Cup Market, By Distribution Channel, 2019-2030 (USD Billion)
List of Figures
1. Global Paper for Cup Market Segmentation
2. Paper for Cup Market: Research Methodology
3. Market Size Estimation Methodology: Bottom-Up Approach
4. Market Size Estimation Methodology: Top-Down Approach
5. Data Triangulation
6. Porter’s Five Forces Analysis
7. Value Chain Analysis
8. Global Paper for Cup Market Attractiveness Analysis by Type
9. Global Paper for Cup Market Attractiveness Analysis by Application
10. Global Paper for Cup Market Attractiveness Analysis by End User
11. Global Paper for Cup Market Attractiveness Analysis by Distribution Channel
12. Global Paper for Cup Market Attractiveness Analysis by Region
13. Global Paper for Cup Market: Dynamics
14. Global Paper for Cup Market Share by Type (2022 & 2030)
15. Global Paper for Cup Market Share by Application (2022 & 2030)
16. Global Paper for Cup Market Share by End User (2022 & 2030)
17. Global Paper for Cup Market Share by Distribution Channel (2022 & 2030)
18. Global Paper for Cup Market Share by Regions (2022 & 2030)
19. Global Paper for Cup Market Share by Company (2021)
This study forecasts revenue at global, regional, and country levels from 2019 to 2030. The Brainy Insights has segmented the global paper for cup market based on below-mentioned segments:
Global Paper for Cup Market by Type:
Global Paper for Cup Market by Application:
Global Paper for Cup Market by End User:
Global Paper for Cup Market by Distribution Channel:
Global Paper for Cup Market by Region:
Research has its special purpose to undertake marketing efficiently. In this competitive scenario, businesses need information across all industry verticals; the information about customer wants, market demand, competition, industry trends, distribution channels etc. This information needs to be updated regularly because businesses operate in a dynamic environment. Our organization, The Brainy Insights incorporates scientific and systematic research procedures in order to get proper market insights and industry analysis for overall business success. The analysis consists of studying the market from a miniscule level wherein we implement statistical tools which helps us in examining the data with accuracy and precision.
Our research reports feature both; quantitative and qualitative aspects for any market. Qualitative information for any market research process are fundamental because they reveal the customer needs and wants, usage and consumption for any product/service related to a specific industry. This in turn aids the marketers/investors in knowing certain perceptions of the customers. Qualitative research can enlighten about the different product concepts and designs along with unique service offering that in turn, helps define marketing problems and generate opportunities. On the other hand, quantitative research engages with the data collection process through interviews, e-mail interactions, surveys and pilot studies. Quantitative aspects for the market research are useful to validate the hypotheses generated during qualitative research method, explore empirical patterns in the data with the help of statistical tools, and finally make the market estimations.
The Brainy Insights offers comprehensive research and analysis, based on a wide assortment of factual insights gained through interviews with CXOs and global experts and secondary data from reliable sources. Our analysts and industry specialist assume vital roles in building up statistical tools and analysis models, which are used to analyse the data and arrive at accurate insights with exceedingly informative research discoveries. The data provided by our organization have proven precious to a diverse range of companies, facilitating them to address issues such as determining which products/services are the most appealing, whether or not customers use the product in the manner anticipated, the purchasing intentions of the market and many others.
Our research methodology encompasses an idyllic combination of primary and secondary initiatives. Key phases involved in this process are listed below:

The phase involves the gathering and collecting of market data and its related information with the help of different sources & research procedures.

The data procurement stage involves in data gathering and collecting through various data sources.
This stage involves in extensive research. These data sources includes:
Purchased Database: Purchased databases play a crucial role in estimating the market sizes irrespective of the domain. Our purchased database includes:
Primary Research: The Brainy Insights interacts with leading companies and experts of the concerned domain to develop the analyst team’s market understanding and expertise. It improves and substantiates every single data presented in the market reports. Primary research mainly involves in telephonic interviews, E-mail interactions and face-to-face interviews with the raw material providers, manufacturers/producers, distributors, & independent consultants. The interviews that we conduct provides valuable data on market size and industry growth trends prevailing in the market. Our organization also conducts surveys with the various industry experts in order to gain overall insights of the industry/market. For instance, in healthcare industry we conduct surveys with the pharmacists, doctors, surgeons and nurses in order to gain insights and key information of a medical product/device/equipment which the customers are going to usage. Surveys are conducted in the form of questionnaire designed by our own analyst team. Surveys plays an important role in primary research because surveys helps us to identify the key target audiences of the market. Additionally, surveys helps to identify the key target audience engaged with the market. Our survey team conducts the survey by targeting the key audience, thus gaining insights from them. Based on the perspectives of the customers, this information is utilized to formulate market strategies. Moreover, market surveys helps us to understand the current competitive situation of the industry. To be precise, our survey process typically involve with the 360 analysis of the market. This analytical process begins by identifying the prospective customers for a product or service related to the market/industry to obtain data on how a product/service could fit into customers’ lives.

Secondary Research: The secondary data sources includes information published by the on-profit organizations such as World bank, WHO, company fillings, investor presentations, annual reports, national government documents, statistical databases, blogs, articles, white papers and others. From the annual report, we analyse a company’s revenue to understand the key segment and market share of that organization in a particular region. We analyse the company websites and adopt the product mapping technique which is important for deriving the segment revenue. In the product mapping method, we select and categorize the products offered by the companies catering to domain specific market, deduce the product revenue for each of the companies so as to get overall estimation of the market size. We also source data and analyses trends based on information received from supply side and demand side intermediaries in the value chain. The supply side denotes the data gathered from supplier, distributor, wholesaler and the demand side illustrates the data gathered from the end customers for respective market domain.

The supply side for a domain specific market is analysed by:
The demand side for the market is estimated through:
In-house Library: Apart from these third-party sources, we have our in-house library of qualitative and quantitative information. Our in-house database includes market data for various industry and domains. These data are updated on regular basis as per the changing market scenario. Our library includes, historic databases, internal audit reports and archives.
Sometimes there are instances where there is no metadata or raw data available for any domain specific market. For those cases, we use our expertise to forecast and estimate the market size in order to generate comprehensive data sets. Our analyst team adopt a robust research technique in order to produce the estimates:
Data Synthesis: This stage involves the analysis & mapping of all the information obtained from the previous step. It also involves in scrutinizing the data for any discrepancy observed while data gathering related to the market. The data is collected with consideration to the heterogeneity of sources. Robust scientific techniques are in place for synthesizing disparate data sets and provide the essential contextual information that can orient market strategies. The Brainy Insights has extensive experience in data synthesis where the data passes through various stages:


Market Deduction & Formulation: The final stage comprises of assigning data points at appropriate market spaces so as to deduce feasible conclusions. Analyst perspective & subject matter expert based holistic form of market sizing coupled with industry analysis also plays a crucial role in this stage.
This stage involves in finalization of the market size and numbers that we have collected from data integration step. With data interpolation, it is made sure that there is no gap in the market data. Successful trend analysis is done by our analysts using extrapolation techniques, which provide the best possible forecasts for the market.
Data Validation & Market Feedback: Validation is the most important step in the process. Validation & re-validation via an intricately designed process helps us finalize data-points to be used for final calculations.

The Brainy Insights interacts with leading companies and experts of the concerned domain to develop the analyst team’s market understanding and expertise. It improves and substantiates every single data presented in the market reports. The data validation interview and discussion panels are typically composed of the most experienced industry members. The participants include, however, are not limited to:
Moreover, we always validate our data and findings through primary respondents from all the major regions we are working on.


Free Customization
Fortune 500 Clients
Free Yearly Update On Purchase Of Multi/Corporate License
Companies Served Till Date