- +1-315-215-1633
- sales@thebrainyinsights.com

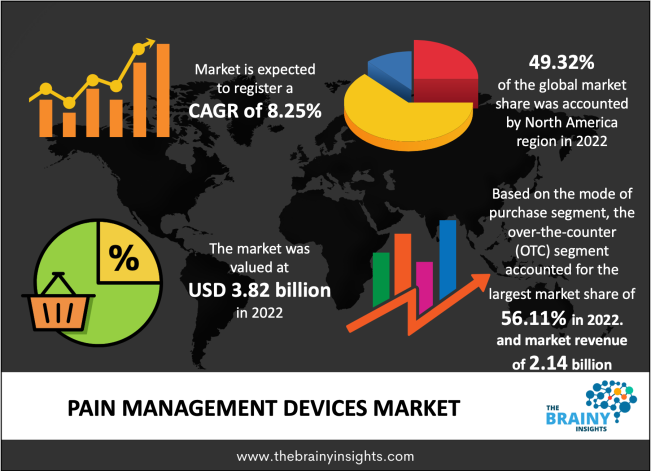
The global pain management devices market was valued at USD 3.82 billion in 2022, increasing at a CAGR of 8.25% from 2022 to 2030 and anticipated to reach USD 7.20 billion by 2030. Asia Pacific is expected to grow the fastest during the forecast period. However, the increasing number of cases associated with COVID-19, cancer, etc., innovative product developments by the companies, and ever-increasing government support are also helping to drive the market growth during the forecast period.
Pain due to tissue injury or illness is an unpleasant sensation and emotional experience. Pain is caused by various diseases like acute arthritis, injury and osteoarthritis, multiple sclerosis, fibromyalgia, diabetic neuropathy, cancer, and stomach ulcers. Pain can be categorized based on duration as acute pain. Pain management devices are increasingly utilized to treat chronic pain by customers at home having had primary healthcare professional (HCP) history of use, mainly from chiropractors and physical therapists. Pain is managed by a specific set of medications or devices to treat pain. These devices are used to treat body pain and contain muscle & joint pain. Three significant instrument classifications exist in the pain management devices market. All transcutaneous electrical nerve stimulation (TENS) devices deliver pulses and heat, which interferes with nerves’ transmittal of pain signals to the brain, thus mitigating the perception of pain. The pulse and heat delivered via TENS units are also said to stimulate blood flow to the area, which encourages healing and can assist the body release endorphins. Light-based devices include those that use LED light, low-level light lasers, infrared light, and polarized medical light. Many suppliers offer LED lightweight instruments for antiaging & acne because of the relative ease of gaining cosmetic device clearance compared to medical devices. LED light treatment helps release nitric oxide from cells, stimulating healing on a cellular level instead of just interfering with pain signals sent to the brain as TENS devices do. Likewise, some pain management tools are neuro-stimulators, transcutaneous electrical nerve stimulators, radiofrequency ablators, and analgesic infusion pumps.
Get an overview of this study by requesting a free sample
For example, in July 2021, Venus Remedies Company launched a customer healthcare division that will offer different products for pain management.
The rapidly growing geriatric population: The increasing elderly population, as well as the raised frequency of obesity and other lifestyle disorders, are helping to drive market growth. Further, the rise in incidences of chronic diseases, such as neuropathy, cancer, diabetes and osteoarthritis, is the driving factor of the market growth. The surge in healthcare expenditure and the number of surgeries are helping boost the market growth. Also, the increasing number of cancer cases is anticipated to grow market growth during the forecast period. Moreover, the high prevalence of musculoskeletal disorders, such as osteoarthritis, arthritis, rheumatoid arthritis, and orthopaedic degenerative diseases, is helping to drive market growth during the forecast period. However, the commercialization of technologically advanced therapeutic products, changing patient demographics, and favourable reimbursement policies are anticipated to propel the market growth during the forecast period.
The high cost of pain management devices: The rise in concerns regarding the risks associated with surgeries and the availability of alternative therapies for pain management are hampering the market growth. Additionally, the hypersensitivity reactions & postoperative infections caused by the use of pain management devices limit their adoption and hinder the market growth. Apart from this, product recalls are also another factor restraining market growth. Also, recalls are essential to mitigate serious health consequences associated with unsafe or defective medical devices.
The high growth prospects in emerging countries: The increasing awareness about the availability and use of pain management devices is expected to offer lucrative growth opportunities for market growth. Further, the rising R&D efforts to create cutting-edge medical technologies, infrastructural developments in healthcare facilities and the increasing rates of chronic diseases are also propelling the market growth. Moreover, the growing demand for novel pain management therapeutics and devices, the infrastructure improvements in healthcare facilities, and the low-cost manufacturing advantage emerging countries offer in the APAC are also helping to boost the market growth in this region during the forecast period.
The regions analyzed for the market include Europe, South America, Asia Pacific, North America, the Middle East, and Africa. North America emerged as the largest market for the global pain management devices market, with a 49.32% share of the market revenue in 2022. North America dominates the pain management devices market due to increasing customer awareness. Also, the expansion of novel pain management machines within the healthcare industry is stimulating market growth during the forecast period in this region. Further, a high incidence of hypertension & stroke, well-established healthcare facilities, growing demand for drug-free therapeutic procedures, and the increasing number of pain management centers are also promoting market growth in this region. Asia Pacific is expected to grow the fastest during the forecast period due to the increasing incidence of chronic diseases. Further, the enormous investment, extensive research and development, the growing number of approvals from the FDA, and the rising government initiatives are also helping to boost the market growth in this region. Also, the increasing awareness about the benefits of electrical stimulation devices is stimulating to propel the market growth during the forecast period in this region.
North America Region Pain Management Devices Market Share in 2022 - 49.32%
www.thebrainyinsights.com
Check the geographical analysis of this market by requesting a free sample
The product type segment is divided into analgesic infusion pumps, neuromodulation & neurostimulation devices, ablation devices, and electrical stimulator. In 2022, the neuromodulation & neurostimulation devices segment dominated the market with the largest market share of 32.17% and market revenue of 1.22 billion. This growth is attributed to the increasing prevalence of neurological diseases and lifestyle-related disorders. Also, the technological advancements in neurostimulation devices and the ever-increasing availability of implantable neurostimulation instruments for pain management in an increasing adult population are propelling the segment’s market growth. Further, by 2030, the ablation devices segment will likely dominate the market due to the increased prevalence of cardiovascular disorders like atrial fibrillation. Also, using ultrasonic ablation technology in radiofrequency (RF) ablation devices is helping to boost the segment’s market growth.
Moreover, increasing adoption of robotic technologies for the expansion of product applications & integration of the latest technologies in ablation instruments to offer enhanced patient safety, as well as procedural efficiency, are expected to drive the segment’s market growth. However, Fulguration or Radiofrequency ablation (RFA) is a minimally invasive process that is affected by the ablation of dysfunctional tissues through the heat generated from alternating current with a frequency range of (350 to 500 kHz). In addition, radiofrequency ablation utilizes MRI (Magnetic resonance Imaging), CT (Computed Tomography), and Ultrasound instruments to help the needle electrode into a cancerous tumour. This process is also extensively used for the therapy of cardiovascular diseases & pain management.
The mode of purchase segment is divided into over-the-counter (OTC) and prescription. In 2022, the over-the-counter (OTC) segment dominated the market with the largest market share of 56.11% and market revenue of 2.14 billion. This growth is attributed to the rising prevalence of neck pain, back pain, and headaches. Also, the growing need for pain management and the increasing preference for OTC muscle relaxers are helping to boost the segment’s market growth.
The application segment is divided into neuropathic pain, facial & migraine pain, cancer pain, musculoskeletal pain, and others. In 2022, the neuropathic pain segment dominated the market, accounting for around 28.22% of global revenue. This growth is attributed to the increasing prevalence of the target population and ever-increasing initiatives by the market players. Further, by 2030, the cancer pain segment will likely dominate the market due to the increasing number of cancer cases as well as the ageing population.
| Attribute | Description |
|---|---|
| Market Size | Revenue (USD Billion) |
| Market size value in 2022 | USD 3.82 Billion, Volume in units |
| Market size value in 2030 | USD 7.20 Billion, Volume in units |
| CAGR (2022 to 2030) | 8.25% |
| Historical data | 2019-2020 |
| Base Year | 2021 |
| Forecast | 2022-2030 |
| Segments | Key Segments are product type, mode of purchase, application, and regions |
| Regional Segments | The key regions are North America, South America, Europe, Asia Pacific, and Middle East & Africa. |
As per The Brainy Insights, the size of the pain management devices market was valued at USD 3.82 billion in 2022 to USD 7.20 billion by 2030.
Global pain management devices market is growing at a CAGR of 8.25% during the forecast period 2022-2030.
The market's growth will be influenced by the rapidly growing geriatric population.
The high cost of pain management devices could hamper the market growth.
The technological advancements in the development of novel pain management devices will provide huge opportunities to the market.
1. Introduction
1.1. Objectives of the Study
1.2. Market Definition
1.3. Research Scope
1.4. Currency
1.5. Key Target Audience
2. Research Methodology and Assumptions
3. Executive Summary
4. Premium Insights
4.1. Porter’s Five Forces Analysis
4.2. Value Chain Analysis
4.3. Top Investment Pockets
4.3.1. Market Attractiveness Analysis By Product Type
4.3.2. Market Attractiveness Analysis By Mode of Purchase
4.3.3. Market Attractiveness Analysis By Application
4.3.4. Market Attractiveness Analysis By Region
4.4. Industry Trends
5. Market Dynamics
5.1. Market Evaluation
5.2. Drivers
5.2.1. The rising geriatric population
5.2.2. The increasing neuropathic disorders
5.2.3. The high purchasing power parity
5.2.4. The innovative product developments by the companies
5.3. Restraints
5.3.1. The high cost of pain management devices
5.3.2. The availability of other alternatives to managing pain
5.4. Opportunities
5.4.1. The high growth prospects in emerging countries
5.4.2. The technological advancements in the development of novel pain management devices
6. Global Pain Management Devices Market Analysis and Forecast, By Product Type
6.1. Segment Overview
6.2. Analgesic Infusion Pumps
6.3. Neuromodulation & Neurostimulation Devices
6.4. Ablation Devices
6.5. Electrical Stimulators
7. Global Pain Management Devices Market Analysis and Forecast, By Mode of Purchase
7.1. Segment Overview
7.2. Over-the-counter (OTC)
7.3. Prescription
8. Global Pain Management Devices Market Analysis and Forecast, By Application
8.1. Segment Overview
8.2. Neuropathic Pain
8.3. Facial & Migraine Pain
8.4. Cancer Pain
8.5. Musculoskeletal Pain
8.6. Others
9. Global Pain Management Devices Market Analysis and Forecast, By Regional Analysis
9.1. Segment Overview
9.2. North America
9.2.1. U.S.
9.2.2. Canada
9.2.3. Mexico
9.3. Europe
9.3.1. Germany
9.3.2. France
9.3.3. U.K.
9.3.4. Italy
9.3.5. Spain
9.4. Asia-Pacific
9.4.1. Japan
9.4.2. China
9.4.3. India
9.5. South America
9.5.1. Brazil
9.6. Middle East and Africa
9.6.1. UAE
9.6.2. South Africa
10. Global Pain Management Devices Market-Competitive Landscape
10.1. Overview
10.2. Market Share of Key Players in Global Pain Management Devices Market
10.2.1. Global Company Market Share
10.2.2. North America Company Market Share
10.2.3. Europe Company Market Share
10.2.4. APAC Company Market Share
10.3. Competitive Situations and Trends
10.3.1. Product Launches and Developments
10.3.2. Partnerships, Collaborations, and Agreements
10.3.3. Mergers & Acquisitions
10.3.4. Expansions
11. Company Profiles
11.1. B. Braun Melsungen AG
11.1.1. Business Overview
11.1.2. Company Snapshot
11.1.3. Company Market Share Analysis
11.1.4. Company Product Portfolio
11.1.5. Recent Developments
11.1.6. SWOT Analysis
11.2. Kimberly Clark Corporation
11.2.1. Business Overview
11.2.2. Company Snapshot
11.2.3. Company Market Share Analysis
11.2.4. Company Product Portfolio
11.2.5. Recent Developments
11.2.6. SWOT Analysis
11.3. Abbott Laboratories
11.3.1. Business Overview
11.3.2. Company Snapshot
11.3.3. Company Market Share Analysis
11.3.4. Company Product Portfolio
11.3.5. Recent Developments
11.3.6. SWOT Analysis
11.4. Baxter International Inc.
11.4.1. Business Overview
11.4.2. Company Snapshot
11.4.3. Company Market Share Analysis
11.4.4. Company Product Portfolio
11.4.5. Recent Developments
11.4.6. SWOT Analysis
11.5. Boston Scientific Corp.
11.5.1. Business Overview
11.5.2. Company Snapshot
11.5.3. Company Market Share Analysis
11.5.4. Company Product Portfolio
11.5.5. Recent Developments
11.5.6. SWOT Analysis
11.6. Becton, Dickinson and Company
11.6.1. Business Overview
11.6.2. Company Snapshot
11.6.3. Company Market Share Analysis
11.6.4. Company Product Portfolio
11.6.5. Recent Developments
11.6.6. SWOT Analysis
11.7. Nevro Corp.
11.7.1. Business Overview
11.7.2. Company Snapshot
11.7.3. Company Market Share Analysis
11.7.4. Company Product Portfolio
11.7.5. Recent Developments
11.7.6. SWOT Analysis
11.8. Smiths Medical, Inc.
11.8.1. Business Overview
11.8.2. Company Snapshot
11.8.3. Company Market Share Analysis
11.8.4. Company Product Portfolio
11.8.5. Recent Developments
11.8.6. SWOT Analysis
11.9. Medtronic Plc.
11.9.1. Business Overview
11.9.2. Company Snapshot
11.9.3. Company Market Share Analysis
11.9.4. Company Product Portfolio
11.9.5. Recent Developments
11.9.6. SWOT Analysis
11.10. Colfax Corporation (DJO Global LLC)
11.10.1. Business Overview
11.10.2. Company Snapshot
11.10.3. Company Market Share Analysis
11.10.4. Company Product Portfolio
11.10.5. Recent Developments
11.10.6. SWOT Analysis
11.11. Stryker Corp.
11.11.1. Business Overview
11.11.2. Company Snapshot
11.11.3. Company Market Share Analysis
11.11.4. Company Product Portfolio
11.11.5. Recent Developments
11.11.6. SWOT Analysis
11.12. Johnson & Johnson (Codman and Shurtleff, Inc.)
11.12.1. Business Overview
11.12.2. Company Snapshot
11.12.3. Company Market Share Analysis
11.12.4. Company Product Portfolio
11.12.5. Recent Developments
11.12.6. SWOT Analysis
11.13. Pfizer, Inc.
11.13.1. Business Overview
11.13.2. Company Snapshot
11.13.3. Company Market Share Analysis
11.13.4. Company Product Portfolio
11.13.5. Recent Developments
11.13.6. SWOT Analysis
List of Table
1. Global Pain Management Devices Market, By Product Type, 2019-2030 (USD Billion) (Units)
2. Global Analgesic Infusion Pumps, Pain Management Devices Market, By Region, 2019-2030 (USD Billion) (Units)
3. Global Neuromodulation & Neurostimulation Devices, Pain Management Devices Market, By Region, 2019-2030 (USD Billion) (Units)
4. Global Ablation Devices, Pain Management Devices Market, By Region, 2019-2030 (USD Billion) (Units)
5. Global Electrical Stimulators, Pain Management Devices Market, By Region, 2019-2030 (USD Billion) (Units)
6. Global Pain Management Devices Market, By Mode of Purchase, 2019-2030 (USD Billion) (Units)
7. Global Over-the-counter (OTC), Pain Management Devices Market, By Region, 2019-2030 (USD Billion) (Units)
8. Global Prescription, Pain Management Devices Market, By Region, 2019-2030 (USD Billion) (Units)
9. Global Pain Management Devices Market, By Application, 2019-2030 (USD Billion) (Units)
10. Global Neuropathic Pain, Pain Management Devices Market, By Region, 2019-2030 (USD Billion) (Units)
11. Global Facial & Migraine Pain, Pain Management Devices Market, By Region, 2019-2030 (USD Billion) (Units)
12. Global Cancer Pain, Pain Management Devices Market, By Region, 2019-2030 (USD Billion) (Units)
13. Global Musculoskeletal Pain, Pain Management Devices Market, By Region, 2019-2030 (USD Billion) (Units)
14. Global Others, Pain Management Devices Market, By Region, 2019-2030 (USD Billion) (Units)
15. North America Pain Management Devices Market, By Product Type, 2019-2030 (USD Billion) (Units)
16. North America Pain Management Devices Market, By Mode of Purchase, 2019-2030 (USD Billion) (Units)
17. North America Pain Management Devices Market, By Application, 2019-2030 (USD Billion) (Units)
18. U.S. Pain Management Devices Market, By Product Type, 2019-2030 (USD Billion) (Units)
19. U.S. Pain Management Devices Market, By Mode of Purchase, 2019-2030 (USD Billion) (Units)
20. U.S. Pain Management Devices Market, By Application, 2019-2030 (USD Billion) (Units)
21. Canada Pain Management Devices Market, By Product Type, 2019-2030 (USD Billion) (Units)
22. Canada Pain Management Devices Market, By Mode of Purchase, 2019-2030 (USD Billion) (Units)
23. Canada Pain Management Devices Market, By Application, 2019-2030 (USD Billion) (Units)
24. Mexico Pain Management Devices Market, By Product Type, 2019-2030 (USD Billion) (Units)
25. Mexico Pain Management Devices Market, By Mode of Purchase, 2019-2030 (USD Billion) (Units)
26. Mexico Pain Management Devices Market, By Application, 2019-2030 (USD Billion) (Units)
27. Europe Pain Management Devices Market, By Product Type, 2019-2030 (USD Billion) (Units)
28. Europe Pain Management Devices Market, By Mode of Purchase, 2019-2030 (USD Billion) (Units)
29. Europe Pain Management Devices Market, By Application, 2019-2030 (USD Billion) (Units)
30. Germany Pain Management Devices Market, By Product Type, 2019-2030 (USD Billion) (Units)
31. Germany Pain Management Devices Market, By Mode of Purchase, 2019-2030 (USD Billion) (Units)
32. Germany Pain Management Devices Market, By Application, 2019-2030 (USD Billion) (Units)
33. France Pain Management Devices Market, By Product Type, 2019-2030 (USD Billion) (Units)
34. France Pain Management Devices Market, By Mode of Purchase, 2019-2030 (USD Billion) (Units)
35. France Pain Management Devices Market, By Application, 2019-2030 (USD Billion) (Units)
36. U.K. Pain Management Devices Market, By Product Type, 2019-2030 (USD Billion) (Units)
37. U.K. Pain Management Devices Market, By Mode of Purchase, 2019-2030 (USD Billion) (Units)
38. U.K. Pain Management Devices Market, By Application, 2019-2030 (USD Billion) (Units)
39. Italy Pain Management Devices Market, By Product Type, 2019-2030 (USD Billion) (Units)
40. Italy Pain Management Devices Market, By Mode of Purchase, 2019-2030 (USD Billion) (Units)
41. Italy Pain Management Devices Market, By Application, 2019-2030 (USD Billion) (Units)
42. Spain Pain Management Devices Market, By Product Type, 2019-2030 (USD Billion) (Units)
43. Spain Pain Management Devices Market, By Mode of Purchase, 2019-2030 (USD Billion) (Units)
44. Spain Pain Management Devices Market, By Application, 2019-2030 (USD Billion) (Units)
45. Asia Pacific Pain Management Devices Market, By Product Type, 2019-2030 (USD Billion) (Units)
46. Asia Pacific Pain Management Devices Market, By Mode of Purchase, 2019-2030 (USD Billion) (Units)
47. Asia Pacific Pain Management Devices Market, By Application, 2019-2030 (USD Billion) (Units)
48. Japan Pain Management Devices Market, By Product Type, 2019-2030 (USD Billion) (Units)
49. Japan Pain Management Devices Market, By Mode of Purchase, 2019-2030 (USD Billion) (Units)
50. Japan Pain Management Devices Market, By Application, 2019-2030 (USD Billion) (Units)
51. China Pain Management Devices Market, By Product Type, 2019-2030 (USD Billion) (Units)
52. China Pain Management Devices Market, By Mode of Purchase, 2019-2030 (USD Billion) (Units)
53. China Pain Management Devices Market, By Application, 2019-2030 (USD Billion) (Units)
54. India Pain Management Devices Market, By Product Type, 2019-2030 (USD Billion) (Units)
55. India Pain Management Devices Market, By Mode of Purchase, 2019-2030 (USD Billion) (Units)
56. India Pain Management Devices Market, By Application, 2019-2030 (USD Billion) (Units)
57. South America Pain Management Devices Market, By Product Type, 2019-2030 (USD Billion) (Units)
58. South America Pain Management Devices Market, By Mode of Purchase, 2019-2030 (USD Billion) (Units)
59. South America Pain Management Devices Market, By Application, 2019-2030 (USD Billion) (Units)
60. Brazil Pain Management Devices Market, By Product Type, 2019-2030 (USD Billion) (Units)
61. Brazil Pain Management Devices Market, By Mode of Purchase, 2019-2030 (USD Billion) (Units)
62. Brazil Pain Management Devices Market, By Application, 2019-2030 (USD Billion) (Units)
63. Middle East and Africa Pain Management Devices Market, By Product Type, 2019-2030 (USD Billion) (Units)
64. Middle East and Africa Pain Management Devices Market, By Mode of Purchase, 2019-2030 (USD Billion) (Units)
65. Middle East and Africa Pain Management Devices Market, By Application, 2019-2030 (USD Billion) (Units)
66. UAE Pain Management Devices Market, By Product Type, 2019-2030 (USD Billion) (Units)
67. UAE Pain Management Devices Market, By Mode of Purchase, 2019-2030 (USD Billion) (Units)
68. UAE Pain Management Devices Market, By Application, 2019-2030 (USD Billion) (Units)
69. South Africa Pain Management Devices Market, By Product Type, 2019-2030 (USD Billion) (Units)
70. South Africa Pain Management Devices Market, By Mode of Purchase, 2019-2030 (USD Billion) (Units)
71. South Africa Pain Management Devices Market, By Application, 2019-2030 (USD Billion) (Units)
List of Figures
1. Global Pain Management Devices Market Segmentation
2. Global Pain Management Devices Market: Research Methodology
3. Market Size Estimation Methodology: Bottom-Up Approach
4. Market Size Estimation Methodology: Top- Approach
5. Data Triangulation
6. Porter’s Five Forces Analysis
7. Value Chain Analysis
8. Global Pain Management Devices Market Attractiveness Analysis By Product Type
9. Global Pain Management Devices Market Attractiveness Analysis By Mode of Purchase
10. Global Pain Management Devices Market Attractiveness Analysis By Application
11. Global Pain Management Devices Market Attractiveness Analysis By Region
12. Global Pain Management Devices Market: Dynamics
13. Global Pain Management Devices Market Share By Product Type (2022 & 2030)
14. Global Pain Management Devices Market Share By Mode of Purchase (2022 & 2030)
15. Global Pain Management Devices Market Share By Application (2022 & 2030)
16. Global Pain Management Devices Market Share By Regions (2022 & 2030)
17. Global Pain Management Devices Market Share By Company (2021)
This study forecasts revenue at global, regional, and country levels from 2019 to 2030. The Brainy Insights has segmented the global pain management devices based on below mentioned segments:
Global Pain Management Devices Market by Product Type:
Global Pain Management Devices Market by Mode of Purchase:
Global Pain Management Devices Market by Application:
Global Pain Management Devices by Region:
Research has its special purpose to undertake marketing efficiently. In this competitive scenario, businesses need information across all industry verticals; the information about customer wants, market demand, competition, industry trends, distribution channels etc. This information needs to be updated regularly because businesses operate in a dynamic environment. Our organization, The Brainy Insights incorporates scientific and systematic research procedures in order to get proper market insights and industry analysis for overall business success. The analysis consists of studying the market from a miniscule level wherein we implement statistical tools which helps us in examining the data with accuracy and precision.
Our research reports feature both; quantitative and qualitative aspects for any market. Qualitative information for any market research process are fundamental because they reveal the customer needs and wants, usage and consumption for any product/service related to a specific industry. This in turn aids the marketers/investors in knowing certain perceptions of the customers. Qualitative research can enlighten about the different product concepts and designs along with unique service offering that in turn, helps define marketing problems and generate opportunities. On the other hand, quantitative research engages with the data collection process through interviews, e-mail interactions, surveys and pilot studies. Quantitative aspects for the market research are useful to validate the hypotheses generated during qualitative research method, explore empirical patterns in the data with the help of statistical tools, and finally make the market estimations.
The Brainy Insights offers comprehensive research and analysis, based on a wide assortment of factual insights gained through interviews with CXOs and global experts and secondary data from reliable sources. Our analysts and industry specialist assume vital roles in building up statistical tools and analysis models, which are used to analyse the data and arrive at accurate insights with exceedingly informative research discoveries. The data provided by our organization have proven precious to a diverse range of companies, facilitating them to address issues such as determining which products/services are the most appealing, whether or not customers use the product in the manner anticipated, the purchasing intentions of the market and many others.
Our research methodology encompasses an idyllic combination of primary and secondary initiatives. Key phases involved in this process are listed below:

The phase involves the gathering and collecting of market data and its related information with the help of different sources & research procedures.

The data procurement stage involves in data gathering and collecting through various data sources.
This stage involves in extensive research. These data sources includes:
Purchased Database: Purchased databases play a crucial role in estimating the market sizes irrespective of the domain. Our purchased database includes:
Primary Research: The Brainy Insights interacts with leading companies and experts of the concerned domain to develop the analyst team’s market understanding and expertise. It improves and substantiates every single data presented in the market reports. Primary research mainly involves in telephonic interviews, E-mail interactions and face-to-face interviews with the raw material providers, manufacturers/producers, distributors, & independent consultants. The interviews that we conduct provides valuable data on market size and industry growth trends prevailing in the market. Our organization also conducts surveys with the various industry experts in order to gain overall insights of the industry/market. For instance, in healthcare industry we conduct surveys with the pharmacists, doctors, surgeons and nurses in order to gain insights and key information of a medical product/device/equipment which the customers are going to usage. Surveys are conducted in the form of questionnaire designed by our own analyst team. Surveys plays an important role in primary research because surveys helps us to identify the key target audiences of the market. Additionally, surveys helps to identify the key target audience engaged with the market. Our survey team conducts the survey by targeting the key audience, thus gaining insights from them. Based on the perspectives of the customers, this information is utilized to formulate market strategies. Moreover, market surveys helps us to understand the current competitive situation of the industry. To be precise, our survey process typically involve with the 360 analysis of the market. This analytical process begins by identifying the prospective customers for a product or service related to the market/industry to obtain data on how a product/service could fit into customers’ lives.

Secondary Research: The secondary data sources includes information published by the on-profit organizations such as World bank, WHO, company fillings, investor presentations, annual reports, national government documents, statistical databases, blogs, articles, white papers and others. From the annual report, we analyse a company’s revenue to understand the key segment and market share of that organization in a particular region. We analyse the company websites and adopt the product mapping technique which is important for deriving the segment revenue. In the product mapping method, we select and categorize the products offered by the companies catering to domain specific market, deduce the product revenue for each of the companies so as to get overall estimation of the market size. We also source data and analyses trends based on information received from supply side and demand side intermediaries in the value chain. The supply side denotes the data gathered from supplier, distributor, wholesaler and the demand side illustrates the data gathered from the end customers for respective market domain.

The supply side for a domain specific market is analysed by:
The demand side for the market is estimated through:
In-house Library: Apart from these third-party sources, we have our in-house library of qualitative and quantitative information. Our in-house database includes market data for various industry and domains. These data are updated on regular basis as per the changing market scenario. Our library includes, historic databases, internal audit reports and archives.
Sometimes there are instances where there is no metadata or raw data available for any domain specific market. For those cases, we use our expertise to forecast and estimate the market size in order to generate comprehensive data sets. Our analyst team adopt a robust research technique in order to produce the estimates:
Data Synthesis: This stage involves the analysis & mapping of all the information obtained from the previous step. It also involves in scrutinizing the data for any discrepancy observed while data gathering related to the market. The data is collected with consideration to the heterogeneity of sources. Robust scientific techniques are in place for synthesizing disparate data sets and provide the essential contextual information that can orient market strategies. The Brainy Insights has extensive experience in data synthesis where the data passes through various stages:


Market Deduction & Formulation: The final stage comprises of assigning data points at appropriate market spaces so as to deduce feasible conclusions. Analyst perspective & subject matter expert based holistic form of market sizing coupled with industry analysis also plays a crucial role in this stage.
This stage involves in finalization of the market size and numbers that we have collected from data integration step. With data interpolation, it is made sure that there is no gap in the market data. Successful trend analysis is done by our analysts using extrapolation techniques, which provide the best possible forecasts for the market.
Data Validation & Market Feedback: Validation is the most important step in the process. Validation & re-validation via an intricately designed process helps us finalize data-points to be used for final calculations.

The Brainy Insights interacts with leading companies and experts of the concerned domain to develop the analyst team’s market understanding and expertise. It improves and substantiates every single data presented in the market reports. The data validation interview and discussion panels are typically composed of the most experienced industry members. The participants include, however, are not limited to:
Moreover, we always validate our data and findings through primary respondents from all the major regions we are working on.


Free Customization
Fortune 500 Clients
Free Yearly Update On Purchase Of Multi/Corporate License
Companies Served Till Date