- +1-315-215-1633
- sales@thebrainyinsights.com

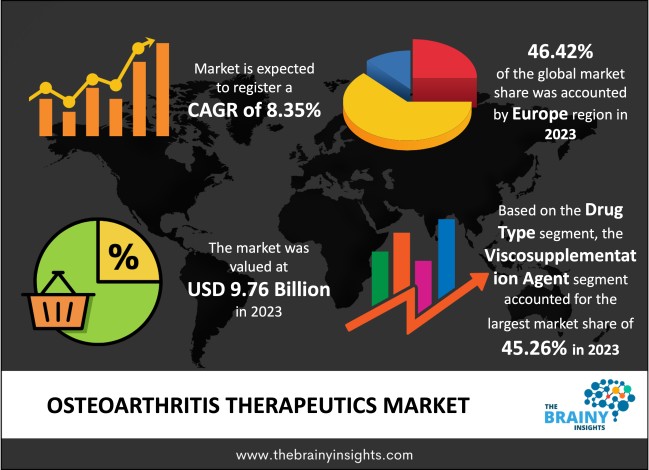
The global osteoarthritis therapeutics market is expected to reach USD 21.77 billion by 2033, at a CAGR of 8.35% during the forecast period 2024-2033. Increasing prevalence of osteoarthritis disease across the globe is propelling the growth of osteoarthritis therapeutics market. Osteoarthritis is mostly found in older people, and it is one of the driving factors for the growth of the market.
Osteoarthritis also called as wear and tear arthritis is one of the most common types of arthritis. It is a progressive disorder where when the smooth cushion between bones breaks down where joints become painful, swollen, and hard to move. The osteoarthritis can happen to any joints, but it mainly occurs in the joints of the knee, hip, and hand joints. The incident of developing osteoarthritis in the knee over a lifetime is about 45%. It is a chronic disorder and worsens with the increasing age. It commonly starts in the age of 50s and happens more in women than men. Apart from the age factor, the disorder is also associated with various factors, including gender, obesity, bone density, and lack of exercise.
Currently, the osteoarthritis can be diagnosed with the physical examination and with the help of an x-ray, MRI, CT scan, and arthroscopy. Therapeutics for the osteoarthritis is mostly given on the basis of symptoms and pain. The treatment of osteoarthritis involves treatment associated with the pain, corticosteroid injections, viscosupplementation with intra-articular hyaluronate injections, and nonsteroidal anti-inflammatory drugs. In addition to this, over the counter drugs such as ibuprofen (Advil, Motrin IB, others) and naproxen sodium (Aleve, others) are also taken for the treatment of the osteoarthritis. Some analgesics also prescribe by the doctor to relieve the pain; however, it does not work to reduce the inflammation. Furthermore, there are also a lot of creams and ointments are available in the market to apply on the joints, which helps to reduce the pain. People have become very conscious about their health, people no longer avoid diseases, rather they get them treated immediately, hence osteoarthritis and many other problems like it can be cured by getting timely treatment.
Get an overview of this study by requesting a free sample
The increasing prevalence of osteoarthritis is one of the key driving factors for the growth of osteoarthritis therapeutics treatment market. For instance, osteoarthritis affects more than 240 million people globally. In addition to this, more than 100 million people in the U.S. have been affected by the osteoarthritis, of which 40 million are suffering from knee osteoarthritis. Obesity and high body mass index are some of the factors that offer a greater risk of osteoarthritis. Thus, the rising prevalence of osteoarthritis across the globe, the demand for osteoarthritis therapeutics is increasing.
Common sports injuries such as sprains, knee injuries, cartilage tears, fractures and dislocations can trigger the osteoarthritis after some years. Osteoarthritis starts to develop after braking the soft tissues which protect the joint. The risk of cartilage trouble increases after sports injuries. The sports injuries can lead up to 10%-15% osteoarthritis cases. Thus, rising sports injuries driving the growth of the market.
Osteoarthritis therapeutics drugs offer pain relief and reduced inflammation. However, the various drugs which is used for the treatment of osteoarthritis exhibit some kind of side effects. The side effects can be mild as well as severe. Some of the side effects include gas, heartburn, diarrhoea, dizziness, and vomiting. Thus, the adverse side effects of osteoarthritis therapeutics drugs may hamper the growth of the market.
Osteoarthritis is one of the most common problems in developing countries. For instance, in India, osteoarthritis is the second common rheumatologic disorder with a prevalence of 22% to 39%. In the past few years, there was a lack of awareness about the treatment available for the osteoarthritis. However, with the increasing awareness and rising healthcare, many patients are opting for the osteoarthritis therapeutics treatment. Thus, increasing awareness in emerging countries is likely to offer new opportunities in the market.
Availability of non-drug therapies for the osteoarthritis is one of the key challenges in the global market. Some of the non-drug therapies are exercise, acupuncture, and massage therapy. In recent years the non-drug therapies have gained popularity as it does not have any side effects. Furthermore, therapies are cost-effective than drug treatment. Thus, the rising preference for non-drug therapies is projected to hamper the growth of the market.
The global osteoarthritis therapeutics market has been segmented based on drug type, anatomy, route of administration, distribution channel, and regions.
The regions analyzed for the global osteoarthritis therapeutics market include North America, Europe, South America, Asia Pacific, and the Middle East and Africa. The Europe region accounted for the major market share of 46.42% in the year 2023.
Europe Osteoarthritis Therapeutics Market Share in 2023 - 46.42%
www.thebrainyinsights.com
Check the geographical analysis of this market by requesting a free sample
The key players of global osteoarthritis therapeutics market are majorly focusing on adoption of various strategies such as new product development, joint venture, collaboration, technological integration, product innovations, mergers & acquisitions, and partnerships to gain the significant market share in the industry.
In July 2019, GlaxoSmithKline Plc announced the start of a phase III clinical development programme with otilimab, an anti GM-CSF monoclonal antibody, for the patient who are suffering from moderate to severe arthritis.
In February 2018, Anika Therapeutics announced the partnership with the Institute of Integrative Biology at the University of Liverpool for the development of innovative therapy for osteoarthritis.
As per The Brainy Insights, the size of the osteoarthritis therapeutics market was valued at USD 9.76 billion in 2023 to reach USD 21.77 billion by 2033.
Global osteoarthritis therapeutics market is growing at a CAGR of 8.35% during the forecast period 2024-2033.
The Europe region emerged as the largest market for the osteoarthritis therapeutics.
Increasing prevalence of osteoarthritis disease across the globe is one of the key factors driving the demand for osteoarthritis therapeutics from the past few years.
Adverse side effects of osteoarthritis drugs may limit the growth of the market over the forecast period.
Increasing awareness about osteoarthritis therapeutics in emerging market is one of the key growth opportunities in the market.
Key players are Horizon Therapeutics, Sanofi, Pfizer, Bayer AG, GlaxoSmithKline Plc, Johnson & Johnson, Abbott, Anika Therapeutics, Eli Lilly, and Flexion Therapeutics among others.
1. Introduction
1.1. Objectives of the Study
1.2. Market Definition
1.3. Research Scope
1.4. Currency
1.5. Key Target Audience
2. Research Methodology and Assumptions
3. Executive Summary
4. Premium Insights
4.1. Porter’s Five Forces Analysis
4.2. Value Chain Analysis
4.3. Top Investment Pockets
4.3.1. Market Attractiveness Analysis By Drug Type
4.3.2. Market Attractiveness Analysis By Anatomy
4.3.3. Market Attractiveness Analysis By Route of Administration
4.3.4. Market Attractiveness Analysis By Distribution Channel
4.3.5. Market Attractiveness Analysis By Region
4.4. Industry Trends
5. Market Dynamics
5.1. Market Evaluation
5.2. Drivers
5.2.1. Increasing prevalence of osteoarthritis across the globe
5.2.2. Rising incidences of sports injuries
5.3. Restrains
5.3.1. Adverse side effects of osteoarthritis therapeutics drugs
5.4. Opportunities
5.4.1. Increasing awareness about osteoarthritis therapeutics in emerging market
5.5. Challenges
5.5.1. Availability of non-drug therapies for the osteoarthritis
6. Global Osteoarthritis Therapeutics Market Analysis and Forecast, By Drug Type
6.1. Segment Overview
6.2. Macrobrewery Equipment
6.3. Viscosupplementation Agents
6.4. Nonsteroidal Anti-inflammatory Drugs
6.5. Analgesics
6.6. Corticosteroids
6.7. Others
7. Global Osteoarthritis Therapeutics Market Analysis and Forecast, By Anatomy
7.1. Segment Overview
7.2. Knee
7.3. Hip
7.4. Hand
7.5. Small Joints
8. Global Osteoarthritis Therapeutics Market Analysis and Forecast, By Route of Administration
8.1. Segment Overview
8.2. Parenteral
8.3. Topical
8.4. Oral
9. Global Osteoarthritis Therapeutics Market Analysis and Forecast, By Distribution Channel
9.1. Segment Overview
9.2. Hospital Pharmacies
9.3. Retail Pharmacies
9.4. Online Pharmacies
10. Global Osteoarthritis Therapeutics Market Analysis and Forecast, By Regional Analysis
10.1. Segment Overview
10.2. North America
10.2.1. U.S.
10.2.2. Canada
10.2.3. Mexico
10.3. Europe
10.3.1. Germany
10.3.2. France
10.3.3. U.K.
10.3.4. Italy
10.3.5. Spain
10.4. Asia-Pacific
10.4.1. Japan
10.4.2. China
10.4.3. India
10.5. South America
10.5.1. Brazil
10.6. Middle East and Africa
10.6.1. UAE
10.6.2. South Africa
11. Global Osteoarthritis Therapeutics Market-Competitive Landscape
11.1. Overview
11.2. Market Share of Key Players in Global Osteoarthritis Therapeutics Market
11.2.1. Global Company Market Share
11.2.2. North America Company Market Share
11.2.3. Europe Company Market Share
11.2.4. APAC Company Market Share
11.3. Competitive Situations and Trends
11.3.1. Product Launches and Developments
11.3.2. Partnerships, Collaborations, and Agreements
11.3.3. Mergers & Acquisitions
11.3.4. Expansions
12. Company Profiles
12.1. Horizon Therapeutics
12.1.1. Business Overview
12.1.2. Company Snapshot
12.1.3. Company Market Share Analysis
12.1.4. Company Product Portfolio
12.1.5. Recent Developments
12.1.6. SWOT Analysis
12.2. Sanofi
12.2.1. Business Overview
12.2.2. Company Snapshot
12.2.3. Company Market Share Analysis
12.2.4. Company Product Portfolio
12.2.5. Recent Developments
12.2.6. SWOT Analysis
12.3. Pfizer
12.3.1. Business Overview
12.3.2. Company Snapshot
12.3.3. Company Market Share Analysis
12.3.4. Company Product Portfolio
12.3.5. Recent Developments
12.3.6. SWOT Analysis
12.4. Bayer AG
12.4.1. Business Overview
12.4.2. Company Snapshot
12.4.3. Company Market Share Analysis
12.4.4. Company Product Portfolio
12.4.5. Recent Developments
12.4.6. SWOT Analysis
12.5. GlaxoSmithKline Plc
12.5.1. Business Overview
12.5.2. Company Snapshot
12.5.3. Company Market Share Analysis
12.5.4. Company Product Portfolio
12.5.5. Recent Developments
12.5.6. SWOT Analysis
12.6. Johnson & Johnson
12.6.1. Business Overview
12.6.2. Company Snapshot
12.6.3. Company Market Share Analysis
12.6.4. Company Product Portfolio
12.6.5. Recent Developments
12.6.6. SWOT Analysis
12.7. Abbott
12.7.1. Business Overview
12.7.2. Company Snapshot
12.7.3. Company Market Share Analysis
12.7.4. Company Product Portfolio
12.7.5. Recent Developments
12.7.6. SWOT Analysis
12.8. Anika Therapeutics
12.8.1. Business Overview
12.8.2. Company Snapshot
12.8.3. Company Market Share Analysis
12.8.4. Company Product Portfolio
12.8.5. Recent Developments
12.8.6. SWOT Analysis
12.9. Eli Lilly
12.9.1. Business Overview
12.9.2. Company Snapshot
12.9.3. Company Market Share Analysis
12.9.4. Company Product Portfolio
12.9.5. Recent Developments
12.9.6. SWOT Analysis
12.10. Flexion Therapeutics
12.10.1. Business Overview
12.10.2. Company Snapshot
12.10.3. Company Market Share Analysis
12.10.4. Company Product Portfolio
12.10.5. Recent Developments
12.10.6. SWOT Analysis
List of Table
1. Global Osteoarthritis Therapeutics Market, By Drug Type, 2020–2033(USD Billion)
2. Global Viscosupplementation Agents, Osteoarthritis Therapeutics Market, By Region, 2020–2033(USD Billion)
3. Global Nonsteroidal Anti-inflammatory Drugs, Osteoarthritis Therapeutics Market, By Region, 2020–2033(USD Billion)
4. Global Analgesics, Osteoarthritis Therapeutics Market, By Region, 2020–2033(USD Billion)
5. Global Corticosteroids, Osteoarthritis Therapeutics Market, By Region, 2020–2033(USD Billion)
6. Global Others, Osteoarthritis Therapeutics Market, By Region, 2020–2033(USD Billion)
7. Global Osteoarthritis Therapeutics Market, By Anatomy, 2020–2033(USD Billion)
8. Global Knee, Osteoarthritis Therapeutics Market, By Region, 2020–2033(USD Billion)
9. Global Hip, Osteoarthritis Therapeutics Market, By Region, 2020–2033(USD Billion)
10. Global Hand, Osteoarthritis Therapeutics Market, By Region, 2020–2033(USD Billion)
11. Global Small Joints, Osteoarthritis Therapeutics Market, By Region, 2020–2033(USD Billion)
12. Global Osteoarthritis Therapeutics Market, By Route of Administration, 2020–2033(USD Billion)
13. Global Parenteral Osteoarthritis Therapeutics Market, By Region, 2020–2033(USD Billion)
14. Global Topical Osteoarthritis Therapeutics Market, By Region, 2020–2033(USD Billion)
15. Global Oral Osteoarthritis Therapeutics Market, By Region, 2020–2033(USD Billion)
16. Global Osteoarthritis Therapeutics Market, By Distribution Channel, 2020–2033(USD Billion)
17. Global Retail Pharmacies Osteoarthritis Therapeutics Market, By Region, 2020–2033(USD Billion)
18. Global Online Pharmacies Osteoarthritis Therapeutics Market, By Region, 2020–2033(USD Billion)
19. Global Hospital Pharmacies Osteoarthritis Therapeutics Market, By Region, 2020–2033(USD Billion)
20. Global Osteoarthritis Therapeutics Market, By Region, 2020–2033(USD Billion)
21. North America Osteoarthritis Therapeutics Market, By Drug Type, 2020–2033(USD Billion)
22. North America Osteoarthritis Therapeutics Market, By Anatomy, 2020–2033(USD Billion)
23. North America Osteoarthritis Therapeutics Market, By Route of Administration, 2020–2033(USD Billion)
24. North America Osteoarthritis Therapeutics Market, By Distribution Channel, 2020–2033(USD Billion)
25. U.S. Osteoarthritis Therapeutics Market, By Drug Type, 2020–2033(USD Billion)
26. U.S. Osteoarthritis Therapeutics Market, By Anatomy, 2020–2033(USD Billion)
27. U.S. Osteoarthritis Therapeutics Market, By Route of Administration, 2020–2033(USD Billion)
28. U.S. Osteoarthritis Therapeutics Market, By Distribution Channel, 2020–2033(USD Billion)
29. Canada Osteoarthritis Therapeutics Market, By Drug Type, 2020–2033(USD Billion)
30. Canada Osteoarthritis Therapeutics Market, By Anatomy, 2020–2033(USD Billion)
31. Canada Osteoarthritis Therapeutics Market, By Route of Administration, 2020–2033(USD Billion)
32. Canada Osteoarthritis Therapeutics Market, By Distribution Channel, 2020–2033(USD Billion)
33. Mexico Osteoarthritis Therapeutics Market, By Drug Type, 2020–2033(USD Billion)
34. Mexico Osteoarthritis Therapeutics Market, By Anatomy, 2020–2033(USD Billion)
35. Mexico Osteoarthritis Therapeutics Market, By Route of Administration, 2020–2033(USD Billion)
36. Mexico Osteoarthritis Therapeutics Market, By Distribution Channel, 2020–2033(USD Billion)
37. Europe Osteoarthritis Therapeutics Market, By Drug Type, 2020–2033(USD Billion)
38. Europe Osteoarthritis Therapeutics Market, By Anatomy, 2020–2033(USD Billion)
39. Europe Osteoarthritis Therapeutics Market, By Route of Administration, 2020–2033(USD Billion)
40. Europe Osteoarthritis Therapeutics Market, By Distribution Channel, 2020–2033(USD Billion)
41. Germany Osteoarthritis Therapeutics Market, By Drug Type, 2020–2033(USD Billion)
42. Germany Osteoarthritis Therapeutics Market, By Anatomy, 2020–2033(USD Billion)
43. Germany Osteoarthritis Therapeutics Market, By Route of Administration, 2020–2033(USD Billion)
44. Germany Osteoarthritis Therapeutics Market, By Distribution Channel, 2020–2033(USD Billion)
45. France Osteoarthritis Therapeutics Market, By Drug Type, 2020–2033(USD Billion)
46. France Osteoarthritis Therapeutics Market, By Anatomy, 2020–2033(USD Billion)
47. France Osteoarthritis Therapeutics Market, By Route of Administration, 2020–2033(USD Billion)
48. France Osteoarthritis Therapeutics Market, By Distribution Channel, 2020–2033(USD Billion)
49. U.K. Osteoarthritis Therapeutics Market, By Drug Type, 2020–2033(USD Billion)
50. U.K. Osteoarthritis Therapeutics Market, By Anatomy, 2020–2033(USD Billion)
51. U.K. Osteoarthritis Therapeutics Market, By Route of Administration, 2020–2033(USD Billion)
52. U.K. Osteoarthritis Therapeutics Market, By Distribution Channel, 2020–2033(USD Billion)
53. Italy Osteoarthritis Therapeutics Market, By Drug Type, 2020–2033(USD Billion)
54. Italy Osteoarthritis Therapeutics Market, By Anatomy, 2020–2033(USD Billion)
55. Italy Osteoarthritis Therapeutics Market, By Route of Administration, 2020–2033(USD Billion)
56. Italy Osteoarthritis Therapeutics Market, By Distribution Channel, 2020–2033(USD Billion)
57. Spain Osteoarthritis Therapeutics Market, By Drug Type, 2020–2033(USD Billion)
58. Spain Osteoarthritis Therapeutics Market, By Anatomy, 2020–2033(USD Billion)
59. Spain Osteoarthritis Therapeutics Market, By Route of Administration, 2020–2033(USD Billion)
60. Spain Osteoarthritis Therapeutics Market, By Distribution Channel, 2020–2033(USD Billion)
61. Asia Pacific Osteoarthritis Therapeutics Market, By Drug Type, 2020–2033(USD Billion)
62. Asia Pacific Osteoarthritis Therapeutics Market, By Anatomy, 2020–2033(USD Billion)
63. Asia Pacific Osteoarthritis Therapeutics Market, By Route of Administration, 2020–2033(USD Billion)
64. Asia Pacific Osteoarthritis Therapeutics Market, By Distribution Channel, 2020–2033(USD Billion)
65. Japan Osteoarthritis Therapeutics Market, By Drug Type, 2020–2033(USD Billion)
66. Japan Osteoarthritis Therapeutics Market, By Anatomy, 2020–2033(USD Billion)
67. Japan Osteoarthritis Therapeutics Market, By Route of Administration, 2020–2033(USD Billion)
68. Japan Osteoarthritis Therapeutics Market, By Distribution Channel, 2020–2033(USD Billion)
69. China Osteoarthritis Therapeutics Market, By Drug Type, 2020–2033(USD Billion)
70. China Osteoarthritis Therapeutics Market, By Anatomy, 2020–2033(USD Billion)
71. China Osteoarthritis Therapeutics Market, By Route of Administration, 2020–2033(USD Billion)
72. China Osteoarthritis Therapeutics Market, By Distribution Channel, 2020–2033(USD Billion)
73. India Osteoarthritis Therapeutics Market, By Drug Type, 2020–2033(USD Billion)
74. India Osteoarthritis Therapeutics Market, By Anatomy, 2020–2033(USD Billion)
75. India Osteoarthritis Therapeutics Market, By Route of Administration, 2020–2033(USD Billion)
76. India Osteoarthritis Therapeutics Market, By Distribution Channel, 2020–2033(USD Billion)
77. South America Osteoarthritis Therapeutics Market, By Drug Type, 2020–2033(USD Billion)
78. South America Osteoarthritis Therapeutics Market, By Anatomy, 2020–2033(USD Billion)
79. South America Osteoarthritis Therapeutics Market, By Route of Administration, 2020–2033(USD Billion)
80. South America Osteoarthritis Therapeutics Market, By Distribution Channel, 2020–2033(USD Billion)
81. Brazil Osteoarthritis Therapeutics Market, By Drug Type, 2020–2033(USD Billion)
82. Brazil Osteoarthritis Therapeutics Market, By Anatomy, 2020–2033(USD Billion)
83. Brazil Osteoarthritis Therapeutics Market, By Route of Administration, 2020–2033(USD Billion)
84. Brazil Osteoarthritis Therapeutics Market, By Distribution Channel, 2020–2033(USD Billion)
85. Middle East and Africa Osteoarthritis Therapeutics Market, By Drug Type, 2020–2033(USD Billion)
86. Middle East and Africa Osteoarthritis Therapeutics Market, By Anatomy, 2020–2033(USD Billion)
87. Middle East and Africa Osteoarthritis Therapeutics Market, By Route of Administration, 2020–2033(USD Billion)
88. Middle East and Africa Osteoarthritis Therapeutics Market, By Distribution Channel, 2020–2033(USD Billion)
89. UAE Osteoarthritis Therapeutics Market, By Drug Type, 2020–2033(USD Billion)
90. UAE Osteoarthritis Therapeutics Market, By Anatomy, 2020–2033(USD Billion)
91. UAE Osteoarthritis Therapeutics Market, By Route of Administration, 2020–2033(USD Billion)
92. UAE Osteoarthritis Therapeutics Market, By Distribution Channel, 2020–2033(USD Billion)
93. South Africa Osteoarthritis Therapeutics Market, By Drug Type, 2020–2033(USD Billion)
94. South Africa Osteoarthritis Therapeutics Market, By Anatomy, 2020–2033(USD Billion)
95. South Africa Osteoarthritis Therapeutics Market, By Route of Administration, 2020–2033(USD Billion)
96. South Africa Osteoarthritis Therapeutics Market, By Distribution Channel, 2020–2033(USD Billion)
List of Figures
1. Global Osteoarthritis Therapeutics Market Segmentation
2. Osteoarthritis Therapeutics Market: Research Methodology
3. Market Size Estimation Methodology: Bottom-Up Approach
4. Market Size Estimation Methodology: Top-Down Approach
5. Data Triangulation
6. Porter’s Five Forces Analysis
7. Value Chain Analysis
8. Global Osteoarthritis Therapeutics Market Attractiveness Analysis By Drug Type
9. Global Osteoarthritis Therapeutics Market Attractiveness Analysis By Anatomy
10. Global Osteoarthritis Therapeutics Market Attractiveness Analysis By Route of Administration
11. Global Osteoarthritis Therapeutics Market Attractiveness Analysis By Distribution Channel
12. Global Osteoarthritis Therapeutics Market Attractiveness Analysis By Region
13. Global Osteoarthritis Therapeutics Market: Dynamics
14. Global Osteoarthritis Therapeutics Market Share By Drug Type (2023 & 2033)
15. Global Osteoarthritis Therapeutics Market Share By Anatomy (2023 & 2033)
16. Global Osteoarthritis Therapeutics Market Share By Route of Administration (2023 & 2033)
17. Global Osteoarthritis Therapeutics Market Share By Distribution Channel (2023 & 2033)
18. Global Osteoarthritis Therapeutics Market Share by Regions (2023 & 2033)
19. Global Osteoarthritis Therapeutics Market Share by Company (2023)
This study forecasts revenue and volume growth at global, regional, and country levels from 2020 to 2033. The Brainy Insights has segmented the global osteoarthritis therapeutics market on the basis of below mentioned segments:
Global Osteoarthritis Therapeutics Market by Anatomy:
Global Osteoarthritis Therapeutics Market by Drug Type:
Global Osteoarthritis Therapeutics Market by Route of Administration:
Global Osteoarthritis Therapeutics Market by Distribution Channel:
Global Osteoarthritis therapeutics Market by Region:
Research has its special purpose to undertake marketing efficiently. In this competitive scenario, businesses need information across all industry verticals; the information about customer wants, market demand, competition, industry trends, distribution channels etc. This information needs to be updated regularly because businesses operate in a dynamic environment. Our organization, The Brainy Insights incorporates scientific and systematic research procedures in order to get proper market insights and industry analysis for overall business success. The analysis consists of studying the market from a miniscule level wherein we implement statistical tools which helps us in examining the data with accuracy and precision.
Our research reports feature both; quantitative and qualitative aspects for any market. Qualitative information for any market research process are fundamental because they reveal the customer needs and wants, usage and consumption for any product/service related to a specific industry. This in turn aids the marketers/investors in knowing certain perceptions of the customers. Qualitative research can enlighten about the different product concepts and designs along with unique service offering that in turn, helps define marketing problems and generate opportunities. On the other hand, quantitative research engages with the data collection process through interviews, e-mail interactions, surveys and pilot studies. Quantitative aspects for the market research are useful to validate the hypotheses generated during qualitative research method, explore empirical patterns in the data with the help of statistical tools, and finally make the market estimations.
The Brainy Insights offers comprehensive research and analysis, based on a wide assortment of factual insights gained through interviews with CXOs and global experts and secondary data from reliable sources. Our analysts and industry specialist assume vital roles in building up statistical tools and analysis models, which are used to analyse the data and arrive at accurate insights with exceedingly informative research discoveries. The data provided by our organization have proven precious to a diverse range of companies, facilitating them to address issues such as determining which products/services are the most appealing, whether or not customers use the product in the manner anticipated, the purchasing intentions of the market and many others.
Our research methodology encompasses an idyllic combination of primary and secondary initiatives. Key phases involved in this process are listed below:

The phase involves the gathering and collecting of market data and its related information with the help of different sources & research procedures.

The data procurement stage involves in data gathering and collecting through various data sources.
This stage involves in extensive research. These data sources includes:
Purchased Database: Purchased databases play a crucial role in estimating the market sizes irrespective of the domain. Our purchased database includes:
Primary Research: The Brainy Insights interacts with leading companies and experts of the concerned domain to develop the analyst team’s market understanding and expertise. It improves and substantiates every single data presented in the market reports. Primary research mainly involves in telephonic interviews, E-mail interactions and face-to-face interviews with the raw material providers, manufacturers/producers, distributors, & independent consultants. The interviews that we conduct provides valuable data on market size and industry growth trends prevailing in the market. Our organization also conducts surveys with the various industry experts in order to gain overall insights of the industry/market. For instance, in healthcare industry we conduct surveys with the pharmacists, doctors, surgeons and nurses in order to gain insights and key information of a medical product/device/equipment which the customers are going to usage. Surveys are conducted in the form of questionnaire designed by our own analyst team. Surveys plays an important role in primary research because surveys helps us to identify the key target audiences of the market. Additionally, surveys helps to identify the key target audience engaged with the market. Our survey team conducts the survey by targeting the key audience, thus gaining insights from them. Based on the perspectives of the customers, this information is utilized to formulate market strategies. Moreover, market surveys helps us to understand the current competitive situation of the industry. To be precise, our survey process typically involve with the 360 analysis of the market. This analytical process begins by identifying the prospective customers for a product or service related to the market/industry to obtain data on how a product/service could fit into customers’ lives.

Secondary Research: The secondary data sources includes information published by the on-profit organizations such as World bank, WHO, company fillings, investor presentations, annual reports, national government documents, statistical databases, blogs, articles, white papers and others. From the annual report, we analyse a company’s revenue to understand the key segment and market share of that organization in a particular region. We analyse the company websites and adopt the product mapping technique which is important for deriving the segment revenue. In the product mapping method, we select and categorize the products offered by the companies catering to domain specific market, deduce the product revenue for each of the companies so as to get overall estimation of the market size. We also source data and analyses trends based on information received from supply side and demand side intermediaries in the value chain. The supply side denotes the data gathered from supplier, distributor, wholesaler and the demand side illustrates the data gathered from the end customers for respective market domain.

The supply side for a domain specific market is analysed by:
The demand side for the market is estimated through:
In-house Library: Apart from these third-party sources, we have our in-house library of qualitative and quantitative information. Our in-house database includes market data for various industry and domains. These data are updated on regular basis as per the changing market scenario. Our library includes, historic databases, internal audit reports and archives.
Sometimes there are instances where there is no metadata or raw data available for any domain specific market. For those cases, we use our expertise to forecast and estimate the market size in order to generate comprehensive data sets. Our analyst team adopt a robust research technique in order to produce the estimates:
Data Synthesis: This stage involves the analysis & mapping of all the information obtained from the previous step. It also involves in scrutinizing the data for any discrepancy observed while data gathering related to the market. The data is collected with consideration to the heterogeneity of sources. Robust scientific techniques are in place for synthesizing disparate data sets and provide the essential contextual information that can orient market strategies. The Brainy Insights has extensive experience in data synthesis where the data passes through various stages:


Market Deduction & Formulation: The final stage comprises of assigning data points at appropriate market spaces so as to deduce feasible conclusions. Analyst perspective & subject matter expert based holistic form of market sizing coupled with industry analysis also plays a crucial role in this stage.
This stage involves in finalization of the market size and numbers that we have collected from data integration step. With data interpolation, it is made sure that there is no gap in the market data. Successful trend analysis is done by our analysts using extrapolation techniques, which provide the best possible forecasts for the market.
Data Validation & Market Feedback: Validation is the most important step in the process. Validation & re-validation via an intricately designed process helps us finalize data-points to be used for final calculations.

The Brainy Insights interacts with leading companies and experts of the concerned domain to develop the analyst team’s market understanding and expertise. It improves and substantiates every single data presented in the market reports. The data validation interview and discussion panels are typically composed of the most experienced industry members. The participants include, however, are not limited to:
Moreover, we always validate our data and findings through primary respondents from all the major regions we are working on.


Free Customization
Fortune 500 Clients
Free Yearly Update On Purchase Of Multi/Corporate License
Companies Served Till Date