- +1-315-215-1633
- sales@thebrainyinsights.com

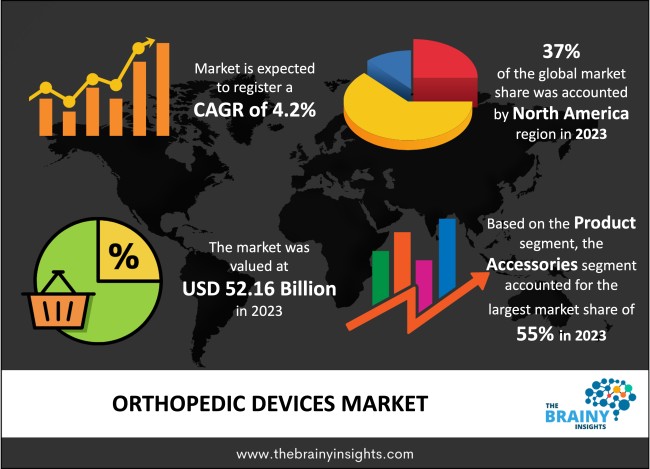
The global orthopaedic devices market was valued at USD 52.16 billion in 2023 and is anticipated to grow at a CAGR of 4.2% from 2024 to 2033. The global orthopaedic devices market is expected to reach USD 78.71 billion by 2033. The Asia Pacific is expected to grow the fastest during the forecast period. The demand for orthopedic devices is increasing due to the growing aged population. The aged population continues to suffer from osteoporosis, arthritis, and other musculoskeletal disorders, and orthopedic devices are used to treat them.
Arthroscopic devices, spinal devices, joint reconstruction devices, trauma fixation devices, accessories, braces, and orthobiologics are some types of orthopaedic equipment used to diagnose and treat muscle-skeletal abnormalities and injuries. The high prevalence of orthopaedic problems, such as degenerative bone disease, the ageing population's growth and the increase in traffic accidents are all factors contributing to the market's expansion. Additionally, the market is expected to rise due to the early onset of musculoskeletal problems, which are usually brought on by obesity and a sedentary lifestyle. Due to a lack of effective surgical equipment, current trauma care techniques cannot fully replace bodily components. As a result, market players make significant R&D investments to create novel and effective gadgets. This boost in R&D activity is projected to guarantee rapid market expansion over the forecast period. The market is anticipated to grow even more due to technological developments and the prevalence of other bone-related ailments. One of the main things that can cause arthritis is obesity. Studies published in the BMJ Journal in 2020 showed that compared to people of average weight, being overweight or obese raised the incidence of knee osteoarthritis (OA) by 2.5 to 4.6 times. Hospitals are being compelled to upgrade their equipment and services continually due to growing public awareness of the availability of cutting-edge items. The popularity of orthopaedic operations has also been fuelled by financial coverage for orthopaedic treatments. These elements enable clients to select more expensive and sophisticated treatment alternatives, increasing overall income. The cost of more traditional orthopaedic devices is projected to drop dramatically with the advent of more modern ones. In Asia Pacific and the Middle East, developing economies with limited access to medical reimbursement encourage further adoption of the latter. It is anticipated that the combined impact of these actions will increase procedure volume and market growth during the forecast period.
Get an overview of this study by requesting a free sample
In February 2022, 4WEB Medical introduced a broad selection of hyperlordotic lateral implants. With the help of 4WEB's Lumbar Spine Plating Solution, the implants enable more affordable treatment alternatives and lessen the need for more extensive posterior corrective surgeries.
In February 2022, Spire Orthopedic Partners announced collaborations with Orthopaedic Surgical Associates and Middlesex Orthopedic Surgeons, PC (MOS). (OSA). Both are outstanding surgical facilities committed to providing complete orthopaedic and spine care.
High Prevalence Bone Disorders – Age-related bone conditions such as osteoarthritis, rickets, and osteomalacia are more common in geriatric patients, which is expected to drive the market's growth. In the past several years, there has been a noticeable rise in the number of elderly patients seeking joint replacement surgery. According to the Global Arthritis Network, 350 million people worldwide have arthritis. Osteoarthritis causes about 25 out of every 1,000 persons to need orthopaedic surgery. The World Health Organization (WHO) estimates that by 2050, there will be 2 billion people worldwide who are 60 years of age or older.
Stringent Regulations- The growth of the orthopaedic devices market is expected to be hindered by stringent government regulations. As there is increasing use of orthopaedic devices by hospitals and clinics to earn money. Furthermore, several hospitals and doctors also use low-quality materials, affecting patients' health. This has forced the government to impose stringent regulations on the use of orthopaedic devices, hindering the market's growth.
Role of Technological Advancements- The market for orthopaedic devices is being pushed by an increase in outpatient operations and the launch of innovative product ideas. The market is driven by the rapid development of the spine, hip, and knee replacement devices in design and functionality, including smart implants with built-in sensors for real-time data processing and metal-on-metal and metal-on-ceramic implants. The industry's growth is also supported by advancements in tissue engineering and gene editing technologies.
High Cost- With the increased use of orthopaedic devices, the cost of treating orthopaedic problems is rising. Only some people can afford the treatment, which has become a challenge for the market's growth. Furthermore, there is an increase in the quality of devices used for orthopaedic devices, which increases its overall cost. The surgical cost of orthopaedic treatment also adds to the cost challenging the market's growth.
The regions analyzed for the market include North America, Europe, South America, Asia Pacific, the Middle East, and Africa. North America emerged as the largest market for the global Orthopedic Devices Market, with a 37% share of the market revenue in 2023.
North America currently dominates the Orthopedic Devices Market. The presence of industry, a well-developed healthcare infrastructure, and payment coverage is projected to fuel the area market's high demand for sophisticated healthcare services. The target patient population is continuously growing due to ageing and an increase in traffic accidents, further boosting the number of orthopaedic surgeries performed in the area. The high frequency of orthopaedic diseases and the widespread use of cutting-edge treatment methods are expected to drive market expansion in the United States.
The Asia Pacific is expected to be the fastest-growing region. The large pool of elderly population in the world are anticipated to be in China and India. Therefore, it is anticipated that these nations' demand will increase significantly in the near future. In addition, the expanding medical tourism sector is anticipated to draw more patients from the target patient group due to the affordable availability of cutting-edge medical treatments. Japan has more implant makers than most other nations in its region, spending more on healthcare. Furthermore, it is anticipated that the widespread use of new technology will support regional market expansion.
North America Region Orthopedic Devices Market Share in 2023 - 37%
www.thebrainyinsights.com
Check the geographical analysis of this market by requesting a free sample
The Product segment is divided into accessories and surgical devices. The accessories segment dominated, with a market share of around 55% in 2023. The accessories segment covers products such as arthroscopes, braces, and other consumables, which propels the segment's growth. Furthermore, this segment also includes other devices, such as plaster materials, sutures, and screws, adding impetus to the segment's growth.
The application segment is divided into Hip Orthopedic Devices, Joint Reconstruction, Knee Orthopedic Devices, Spine Orthopedic Devices, Trauma Fixation Devices, Dental Orthopedic Devices, and Others. Over the forecast period, the joint reconstruction segment is expected to grow at the fastest CAGR of 4.9%. The joint reconstruction diagnostics segment has been growing owing to the ageing population, increasing rates of osteoporosis and osteoarthritis, and increasing numbers of auto accidents and sports injuries. For instance, according to the United Nations estimate, almost 703 million individuals worldwide were 65 years of age or older in 2019. In 2050, it is predicted that there will be 1.5 billion senior people.
| Attribute | Description |
|---|---|
| Market Size | Revenue (USD Billion) |
| Market size value in 2023 | USD 52.16 Billion |
| Market size value in 2033 | USD 78.71 Billion |
| CAGR (2024 to 2033) | 4.2% |
| Historical data | 2020-2022 |
| Base Year | 2023 |
| Forecast | 2024-2033 |
| Regional Segments | North America, Asia Pacific, Europe, Latin America, Middle East and Africa |
| Segments | Product, Application |
As per The Brainy Insights, the size of the orthopaedic devices market was valued at USD 52.16 billion in 2023 to USD 78.71 billion by 2033.
The global orthopaedic devices market is growing at a CAGR of 4.2% during the forecast period 2024-2033.
North America emerged as the largest market for orthopaedic devices.
Key players in the orthopaedic devices market are Medtronic PLC, Stryker Corporation, Zimmer-Biomet Holdings, Inc., DePuy Synthes, Smith and Nephew PLC, Aesculap Implant Systems, LLC, Conmed Corporation, Donjoy, Inc., and NuVasive, Inc.
1. Introduction
1.1. Objectives of the Study
1.2. Market Definition
1.3. Research Scope
1.4. Currency
1.5. Key Target Audience
2. Research Methodology and Assumptions
3. Executive Summary
4. Premium Insights
4.1. Porter’s Five Forces Analysis
4.2. Value Chain Analysis
4.3. Top Investment Pockets
4.3.1. Market Attractiveness Analysis By Product
4.3.2. Market Attractiveness Analysis By Application
4.3.3. Market Attractiveness Analysis By Region
4.4. Industry Trends
5. Market Dynamics
5.1. Market Evaluation
5.2. Drivers
5.2.1. High Prevalence Bone Disorders
5.3. Restraints
5.3.1. Stringent Regulations
5.4. Opportunities
5.4.1. Role of Technological Advancements
5.5. Challenges
5.5.1. High Cost
6. Global Orthopedic Devices Market Analysis and Forecast, By Product
6.1. Segment Overview
6.2. Accessories
6.3. Surgical Devices
7. Global Orthopedic Devices Market Analysis and Forecast, By ApplicatioN
7.1. Segment Overview
7.2. Hip Orthopedic Devices
7.3. Joint Reconstruction
7.4. Knee Orthopedic Devices
7.5. Spine Orthopedic Devices
7.6. Trauma Fixation Devices
7.7. Dental Orthopedic Devices
7.8. Others
8. Global Orthopedic Devices Market Analysis and Forecast, By Regional Analysis
8.1. Segment Overview
8.2. North America
8.2.1. U.S.
8.2.2. Canada
8.2.3. Mexico
8.3. Europe
8.3.1. Germany
8.3.2. France
8.3.3. U.K.
8.3.4. Italy
8.3.5. Spain
8.4. Asia-Pacific
8.4.1. Japan
8.4.2. China
8.4.3. India
8.5. South America
8.5.1. Brazil
8.6. Middle East and Africa
8.6.1. UAE
8.6.2. South Africa
9. Global Orthopedic Devices Market-Competitive Landscape
9.1. Overview
9.2. Market Share of Key Players in Global Orthopedic Devices Market
9.2.1. Global Company Market Share
9.2.2. North America Company Market Share
9.2.3. Europe Company Market Share
9.2.4. APAC Company Market Share
9.3. Competitive Situations and Trends
9.3.1. Product Launches and Developments
9.3.2. Partnerships, Collaborations, and Agreements
9.3.3. Mergers & Acquisitions
9.3.4. Expansions
10. Company Profiles
10.1. Medtronic PLC
10.1.1. Business Overview
10.1.2. Company Snapshot
10.1.3. Company Market Share Analysis
10.1.4. Company Product Portfolio
10.1.5. Recent Developments
10.1.6. SWOT Analysis
10.2. Stryker Corporation
10.2.1. Business Overview
10.2.2. Company Snapshot
10.2.3. Company Market Share Analysis
10.2.4. Company Product Portfolio
10.2.5. Recent Developments
10.2.6. SWOT Analysis
10.3. Zimmer-Biomet Holdings, Inc.
10.3.1. Business Overview
10.3.2. Company Snapshot
10.3.3. Company Market Share Analysis
10.3.4. Company Product Portfolio
10.3.5. Recent Developments
10.3.6. SWOT Analysis
10.4. DePuy Synthes
10.4.1. Business Overview
10.4.2. Company Snapshot
10.4.3. Company Market Share Analysis
10.4.4. Company Product Portfolio
10.4.5. Recent Developments
10.4.6. SWOT Analysis
10.5. Smith and Nephew PLC
10.5.1. Business Overview
10.5.2. Company Snapshot
10.5.3. Company Market Share Analysis
10.5.4. Company Product Portfolio
10.5.5. Recent Developments
10.5.6. SWOT Analysis
10.6. Aesculap Implant Systems, LLC
10.6.1. Business Overview
10.6.2. Company Snapshot
10.6.3. Company Market Share Analysis
10.6.4. Company Product Portfolio
10.6.5. Recent Developments
10.6.6. SWOT Analysis
10.7. Conmed Corporation
10.7.1. Business Overview
10.7.2. Company Snapshot
10.7.3. Company Market Share Analysis
10.7.4. Company Product Portfolio
10.7.5. Recent Developments
10.7.6. SWOT Analysis
10.8. Donjoy, Inc.
10.8.1. Business Overview
10.8.2. Company Snapshot
10.8.3. Company Market Share Analysis
10.8.4. Company Product Portfolio
10.8.5. Recent Developments
10.8.6. SWOT Analysis
10.9. NuVasive, Inc.
10.9.1. Business Overview
10.9.2. Company Snapshot
10.9.3. Company Market Share Analysis
10.9.4. Company Product Portfolio
10.9.5. Recent Developments
10.9.6. SWOT Analysis
List of Table
1. Global Orthopedic Devices Market, By Product, 2020-2033 (USD Billion)
2. Global Accessories, Orthopedic Devices Market, By Region, 2020-2033 (USD Billion)
3. Global Surgical Devices, Orthopedic Devices Market, By Region, 2020-2033 (USD Billion)
4. Global Orthopedic Devices Market, By Application, 2020-2033 (USD Billion)
5. Global Hip Orthopedic Devices, Orthopedic Devices Market, By Region, 2020-2033 (USD Billion)
6. Global Joint Reconstruction, Orthopedic Devices Market, By Region, 2020-2033 (USD Billion)
7. Global Knee Orthopedic Devices, Orthopedic Devices Market, By Region, 2020-2033 (USD Billion)
8. Global Spine Orthopedic Devices, Orthopedic Devices Market, By Region, 2020-2033 (USD Billion)
9. Global Trauma Fixation Devices, Orthopedic Devices Market, By Region, 2020-2033 (USD Billion)
10. Global Dental Orthopedic Devices, Orthopedic Devices Market, By Region, 2020-2033 (USD Billion)
11. Global Others, Orthopedic Devices Market, By Region, 2020-2033 (USD Billion)
12. North America Orthopedic Devices Market, By Product, 2020-2033 (USD Billion)
13. North America Orthopedic Devices Market, By Application, 2020-2033 (USD Billion)
14. U.S. Orthopedic Devices Market, By Product, 2020-2033 (USD Billion)
15. U.S. Orthopedic Devices Market, By Application, 2020-2033 (USD Billion)
16. Canada Orthopedic Devices Market, By Product, 2020-2033 (USD Billion)
17. Canada Orthopedic Devices Market, By Application, 2020-2033 (USD Billion)
18. Mexico Orthopedic Devices Market, By Product, 2020-2033 (USD Billion)
19. Mexico Orthopedic Devices Market, By Application, 2020-2033 (USD Billion)
20. Europe Orthopedic Devices Market, By Product, 2020-2033 (USD Billion)
21. Europe Orthopedic Devices Market, By Application, 2020-2033 (USD Billion)
22. Germany Orthopedic Devices Market, By Product, 2020-2033 (USD Billion)
23. Germany Orthopedic Devices Market, By Application, 2020-2033 (USD Billion)
24. France Orthopedic Devices Market, By Product, 2020-2033 (USD Billion)
25. France Orthopedic Devices Market, By Application, 2020-2033 (USD Billion)
26. U.K. Orthopedic Devices Market, By Product, 2020-2033 (USD Billion)
27. U.K. Orthopedic Devices Market, By Application, 2020-2033 (USD Billion)
28. Italy Orthopedic Devices Market, By Product, 2020-2033 (USD Billion)
29. Italy Orthopedic Devices Market, By Application, 2020-2033 (USD Billion)
30. Spain Orthopedic Devices Market, By Product, 2020-2033 (USD Billion)
31. Spain Orthopedic Devices Market, By Application, 2020-2033 (USD Billion)
32. Asia Pacific Orthopedic Devices Market, By Product, 2020-2033 (USD Billion)
33. Asia Pacific Orthopedic Devices Market, By Application, 2020-2033 (USD Billion)
34. Japan Orthopedic Devices Market, By Product, 2020-2033 (USD Billion)
35. Japan Orthopedic Devices Market, By Application, 2020-2033 (USD Billion)
36. China Orthopedic Devices Market, By Product, 2020-2033 (USD Billion)
37. China Orthopedic Devices Market, By Application, 2020-2033 (USD Billion)
38. India Orthopedic Devices Market, By Product, 2020-2033 (USD Billion)
39. India Orthopedic Devices Market, By Application, 2020-2033 (USD Billion)
40. South America Orthopedic Devices Market, By Product, 2020-2033 (USD Billion)
41. South America Orthopedic Devices Market, By Application, 2020-2033 (USD Billion)
42. Brazil Orthopedic Devices Market, By Product, 2020-2033 (USD Billion)
43. Brazil Orthopedic Devices Market, By Application, 2020-2033 (USD Billion)
44. Middle East and Africa Orthopedic Devices Market, By Product, 2020-2033 (USD Billion)
45. Middle East and Africa Orthopedic Devices Market, By Application, 2020-2033 (USD Billion)
46. UAE Orthopedic Devices Market, By Product, 2020-2033 (USD Billion)
47. UAE Orthopedic Devices Market, By Application, 2020-2033 (USD Billion)
48. South Africa Orthopedic Devices Market, By Product, 2020-2033 (USD Billion)
49. South Africa Orthopedic Devices Market, By Application, 2020-2033 (USD Billion)
List of Figures
1. Global Orthopedic Devices Market Segmentation
2. Global Orthopedic Devices Market: Research Methodology
3. Market Size Estimation Methodology: Bottom-Up Approach
4. Market Size Estimation Methodology: Top-Down Approach
5. Data Triangulation
6. Porter’s Five Forces Analysis
7. Value Chain Analysis
8. Global Orthopedic Devices Market Attractiveness Analysis By Product
9. Global Orthopedic Devices Market Attractiveness Analysis By Application
10. Global Orthopedic Devices Market Attractiveness Analysis By Region
11. Global Orthopedic Devices Market: Dynamics
12. Global Orthopedic Devices Market Share By Product (2023 & 2033)
13. Global Orthopedic Devices Market Share By Application (2023 & 2033)
14. Global Orthopedic Devices Market Share By Regions (2023 & 2033)
15. Global Orthopedic Devices Market Share By Company (2023)
This study forecasts global, regional, and country revenue from 2020 to 2033. Brainy Insights has segmented the global orthopaedic devices market based on the below-mentioned segments:
Global Orthopaedic Devices Market by Product:
Global Orthopaedic Devices Market by Application:
Global Orthopaedic Devices Market by Region:
Research has its special purpose to undertake marketing efficiently. In this competitive scenario, businesses need information across all industry verticals; the information about customer wants, market demand, competition, industry trends, distribution channels etc. This information needs to be updated regularly because businesses operate in a dynamic environment. Our organization, The Brainy Insights incorporates scientific and systematic research procedures in order to get proper market insights and industry analysis for overall business success. The analysis consists of studying the market from a miniscule level wherein we implement statistical tools which helps us in examining the data with accuracy and precision.
Our research reports feature both; quantitative and qualitative aspects for any market. Qualitative information for any market research process are fundamental because they reveal the customer needs and wants, usage and consumption for any product/service related to a specific industry. This in turn aids the marketers/investors in knowing certain perceptions of the customers. Qualitative research can enlighten about the different product concepts and designs along with unique service offering that in turn, helps define marketing problems and generate opportunities. On the other hand, quantitative research engages with the data collection process through interviews, e-mail interactions, surveys and pilot studies. Quantitative aspects for the market research are useful to validate the hypotheses generated during qualitative research method, explore empirical patterns in the data with the help of statistical tools, and finally make the market estimations.
The Brainy Insights offers comprehensive research and analysis, based on a wide assortment of factual insights gained through interviews with CXOs and global experts and secondary data from reliable sources. Our analysts and industry specialist assume vital roles in building up statistical tools and analysis models, which are used to analyse the data and arrive at accurate insights with exceedingly informative research discoveries. The data provided by our organization have proven precious to a diverse range of companies, facilitating them to address issues such as determining which products/services are the most appealing, whether or not customers use the product in the manner anticipated, the purchasing intentions of the market and many others.
Our research methodology encompasses an idyllic combination of primary and secondary initiatives. Key phases involved in this process are listed below:

The phase involves the gathering and collecting of market data and its related information with the help of different sources & research procedures.

The data procurement stage involves in data gathering and collecting through various data sources.
This stage involves in extensive research. These data sources includes:
Purchased Database: Purchased databases play a crucial role in estimating the market sizes irrespective of the domain. Our purchased database includes:
Primary Research: The Brainy Insights interacts with leading companies and experts of the concerned domain to develop the analyst team’s market understanding and expertise. It improves and substantiates every single data presented in the market reports. Primary research mainly involves in telephonic interviews, E-mail interactions and face-to-face interviews with the raw material providers, manufacturers/producers, distributors, & independent consultants. The interviews that we conduct provides valuable data on market size and industry growth trends prevailing in the market. Our organization also conducts surveys with the various industry experts in order to gain overall insights of the industry/market. For instance, in healthcare industry we conduct surveys with the pharmacists, doctors, surgeons and nurses in order to gain insights and key information of a medical product/device/equipment which the customers are going to usage. Surveys are conducted in the form of questionnaire designed by our own analyst team. Surveys plays an important role in primary research because surveys helps us to identify the key target audiences of the market. Additionally, surveys helps to identify the key target audience engaged with the market. Our survey team conducts the survey by targeting the key audience, thus gaining insights from them. Based on the perspectives of the customers, this information is utilized to formulate market strategies. Moreover, market surveys helps us to understand the current competitive situation of the industry. To be precise, our survey process typically involve with the 360 analysis of the market. This analytical process begins by identifying the prospective customers for a product or service related to the market/industry to obtain data on how a product/service could fit into customers’ lives.

Secondary Research: The secondary data sources includes information published by the on-profit organizations such as World bank, WHO, company fillings, investor presentations, annual reports, national government documents, statistical databases, blogs, articles, white papers and others. From the annual report, we analyse a company’s revenue to understand the key segment and market share of that organization in a particular region. We analyse the company websites and adopt the product mapping technique which is important for deriving the segment revenue. In the product mapping method, we select and categorize the products offered by the companies catering to domain specific market, deduce the product revenue for each of the companies so as to get overall estimation of the market size. We also source data and analyses trends based on information received from supply side and demand side intermediaries in the value chain. The supply side denotes the data gathered from supplier, distributor, wholesaler and the demand side illustrates the data gathered from the end customers for respective market domain.

The supply side for a domain specific market is analysed by:
The demand side for the market is estimated through:
In-house Library: Apart from these third-party sources, we have our in-house library of qualitative and quantitative information. Our in-house database includes market data for various industry and domains. These data are updated on regular basis as per the changing market scenario. Our library includes, historic databases, internal audit reports and archives.
Sometimes there are instances where there is no metadata or raw data available for any domain specific market. For those cases, we use our expertise to forecast and estimate the market size in order to generate comprehensive data sets. Our analyst team adopt a robust research technique in order to produce the estimates:
Data Synthesis: This stage involves the analysis & mapping of all the information obtained from the previous step. It also involves in scrutinizing the data for any discrepancy observed while data gathering related to the market. The data is collected with consideration to the heterogeneity of sources. Robust scientific techniques are in place for synthesizing disparate data sets and provide the essential contextual information that can orient market strategies. The Brainy Insights has extensive experience in data synthesis where the data passes through various stages:


Market Deduction & Formulation: The final stage comprises of assigning data points at appropriate market spaces so as to deduce feasible conclusions. Analyst perspective & subject matter expert based holistic form of market sizing coupled with industry analysis also plays a crucial role in this stage.
This stage involves in finalization of the market size and numbers that we have collected from data integration step. With data interpolation, it is made sure that there is no gap in the market data. Successful trend analysis is done by our analysts using extrapolation techniques, which provide the best possible forecasts for the market.
Data Validation & Market Feedback: Validation is the most important step in the process. Validation & re-validation via an intricately designed process helps us finalize data-points to be used for final calculations.

The Brainy Insights interacts with leading companies and experts of the concerned domain to develop the analyst team’s market understanding and expertise. It improves and substantiates every single data presented in the market reports. The data validation interview and discussion panels are typically composed of the most experienced industry members. The participants include, however, are not limited to:
Moreover, we always validate our data and findings through primary respondents from all the major regions we are working on.


Free Customization
Fortune 500 Clients
Free Yearly Update On Purchase Of Multi/Corporate License
Companies Served Till Date