- +1-315-215-1633
- sales@thebrainyinsights.com

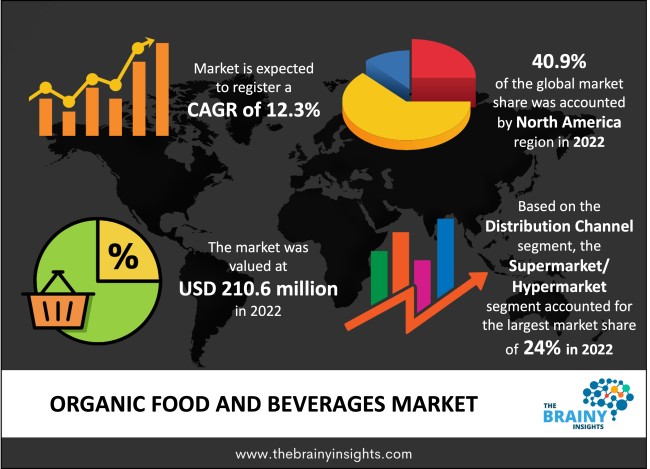
The global organic food and beverages market was valued at USD 210.6 billion in 2022, growing at a CAGR of 12.3% from 2023 to 2032. The market is expected to reach USD 671.8 billion by 2032. The global market for organic food and beverages has grown due to consumers' growing health consciousness and the numerous health advantages of consuming organic food and beverages.
Agricultural items developed or produced using organic farming practices are known as organic foods and beverages. Reusing resources, preserving ecological equilibrium, and practising biodiversity conservation are all aided by organic farming. Agribusiness items developed without artificial fertilisers, growth regulators, or other additives are classified as organic foods and beverages. They are now easily found in fast-food restaurants, internet merchants, and traditional grocers. Due to increased distribution, customers now find it easier to incorporate organic options into their routine shopping routines. In addition, people are becoming more conscious of and concerned about how conventional agricultural practices affect the environment. These actions frequently exacerbate problems, including biodiversity loss, water pollution, and soil deterioration. On the other hand, organic agricultural techniques prioritise environmentally friendly approaches that support healthy soil, preserve wildlife habitats, and conserve water. An increasing number of consumers who deliberately seek products that match their beliefs of sustainability and ethical consumerism find resonance in this strong emphasis on environmental sustainability.
Get an overview of this study by requesting a free sample
In August 2022, Danone purchased Happy Family, an organic food manufacturer. Happy Family produces a range of organic items. Danone's management disclosed that the company has agreed to acquire 92% of Happy Family, a manufacturer of organic infant food.
In July 2022, Grain Forests released additional organic products to bring the country farm closer to the city. Newly introduced goods include sprouted ragi for newborns, diabetic-friendly Health Mix, powdered moringa for daily nourishment, and nutrient-dense ragi dosa for a hearty breakfast.
In February 2021, Danone purchased Your Heart, a leading pioneer in plant-based products. The acquisition may be part of a corporate expansion plan to satisfy consumer demand and keep market leadership over competitors offering similar organic products.
Growing awareness about the benefits of organic food and beverages- Organic food and beverages market growth is fueled by rising consumer knowledge of the advantages of the organic food and beverages. The organic food and beverages business enhances living standards by lowering health worries, boosting consumer understanding of health-conscious consumers, and avoiding pesticides, chemical fertilisers, synthetic chemicals, and genetically modified organisms. Because of this, organic food and beverages benefit human health, the environment, and animal welfare. Compared to a typical diet, it offers nutritional benefits.
Limited shelf life- Organic food and beverages have a limited shelf life, which is expected to hinder the market's growth. These foods do not contain preservatives, which decreases their shelf life, negatively affecting the market's growth.
Increasing working population- Growth opportunities anticipated to propel global market expansion during the forecast period include an expanding retail sector, a growing working population, and an increased demand for ready-to-use items. The global organic food and beverages market will expand due to the personal care industry's increasing usage of organic food and beverages as natural ingredients. The expansion of the organic food and beverage industry is also anticipated to be fueled by rising levels of disposable income, rising costs associated with food and beverages, and rising consumer awareness of healthy living.
The regions analyzed for the market include North America, Europe, South America, Asia Pacific, the Middle East, and Africa. North America emerged as the largest global organic food and beverages market, with a 40.9% market revenue share in 2022.
North America accounted for the largest market share throughout the projected period because of the goods' distinct benefits, which include being healthier than conventional food, having no chemicals or residues, and being environmentally friendly. In the near future, rising consumer knowledge of the advantages of consuming non-genetically modified or altered products will drive the North American market. Because there is enough farmland in the United States, Australia, and Argentina for organic farming, policymakers have been compelled to create regulations to encourage the growth of the organic food industry. Throughout the projection period, this aspect is anticipated to positively affect the market demand for organic foods and beverages.
North America Region Organic Food And Beverages Market Share in 2022 - 40.9%
www.thebrainyinsights.com
Check the geographical analysis of this market by requesting a free sample
The product segment is divided into organic beverages and organic food. The organic food segment dominated the market, with a market share of around 59% in 2022. Organic vegetable consumption gained popularity in industrialized nations like North America and Europe and spread to developing nations like China and India. North America and Europe are the two regions that consume the most organic food.
The distribution channel segment is divided into speciality stores, convenience stores, supermarkets/hypermarkets, online sales channels, and others. The supermarket/hypermarket segment dominated the market, with a market share of around 24% in 2022. These shops stock a wide range of domestic and branded goods. This distribution channel offers some brick-and-mortar locations, and its capacity to carry well-known brands has been supporting the expansion of this segment. Product sales through this channel are rising due to the growing number of supermarket and hypermarket chains and changes in the retail environment, especially in emerging nations.
| Attribute | Description |
|---|---|
| Market Size | Revenue (USD Billion) |
| Market size value in 2022 | USD 210.6 Billion |
| Market size value in 2032 | USD 671.8 Billion |
| CAGR (2023 to 2032) | 12.3% |
| Historical data | 2019-2021 |
| Base Year | 2022 |
| Forecast | 2023-2032 |
| Region | The regions analyzed for the market are Asia Pacific, Europe, South America, North America, and Middle East & Africa. Furthermore, the regions are further analyzed at the country level. |
| Segments | Product, Distribution Channel |
As per The Brainy Insights, the size of the organic food and beverages market was valued at USD 210.6 billion in 2022 to USD 671.8 billion by 2032.
The global organic food and beverages market is growing at a CAGR of 12.3% during the forecast period 2023-2032.
North America emerged as the largest organic food and beverages market.
1. Introduction
1.1. Objectives of the Study
1.2. Market Definition
1.3. Research Scope
1.4. Currency
1.5. Key Target Audience
2. Research Methodology and Assumptions
3. Executive Summary
4. Premium Insights
4.1. Porter’s Five Forces Analysis
4.2. Value Chain Analysis
4.3. Top Investment Pockets
4.3.1. Market Attractiveness Analysis by Product
4.3.2. Market Attractiveness Analysis by Distribution Channel
4.3.3. Market Attractiveness Analysis by Region
4.4. Industry Trends
5. Market Dynamics
5.1. Market Evaluation
5.2. Drivers
5.2.1. Growing awareness about the benefits of organic food and Beverages
5.3. Restraints
5.3.1. Limited shelf life
5.4. Opportunities
5.4.1. Increasing working population
5.5. Challenges
5.5.1. High price
6. Global Organic Food And Beverages Market Analysis and Forecast, By Product
6.1. Segment Overview
6.2. Organic Beverages
6.3. Organic Food
7. Global Organic Food And Beverages Market Analysis and Forecast, By Distribution Channel
7.1. Segment Overview
7.2. Specialty Stores
7.3. Convenience Stores
7.4. Supermarket/Hypermarket
7.5. Online Sales Channel
7.6. Others
8. Global Organic Food And Beverages Market Analysis and Forecast, By Regional Analysis
8.1. Segment Overview
8.2. North America
8.2.1. U.S.
8.2.2. Canada
8.2.3. Mexico
8.3. Europe
8.3.1. Germany
8.3.2. France
8.3.3. U.K.
8.3.4. Italy
8.3.5. Spain
8.4. Asia-Pacific
8.4.1. Japan
8.4.2. China
8.4.3. India
8.5. South America
8.5.1. Brazil
8.6. Middle East and Africa
8.6.1. UAE
8.6.2. South Africa
9. Global Organic Food And Beverages Market-Competitive Landscape
9.1. Overview
9.2. Market Share of Key Players in Global Organic Food And Beverages Market
9.2.1. Global Company Market Share
9.2.2. North America Company Market Share
9.2.3. Europe Company Market Share
9.2.4. APAC Company Market Share
9.3. Competitive Situations and Trends
9.3.1. Product Launches and Developments
9.3.2. Partnerships, Collaborations, and Agreements
9.3.3. Mergers & Acquisitions
9.3.4. Expansions
10. Company Profiles
10.1. Hain celestial Group, Inc.
10.1.1. Business Overview
10.1.2. Company Snapshot
10.1.3. Company Market Share Analysis
10.1.4. Company Product Portfolio
10.1.5. Recent Developments
10.1.6. SWOT Analysis
10.2. Dean Foods Company
10.2.1. Business Overview
10.2.2. Company Snapshot
10.2.3. Company Market Share Analysis
10.2.4. Company Product Portfolio
10.2.5. Recent Developments
10.2.6. SWOT Analysis
10.3. WhiteWave Foods Co.
10.3.1. Business Overview
10.3.2. Company Snapshot
10.3.3. Company Market Share Analysis
10.3.4. Company Product Portfolio
10.3.5. Recent Developments
10.3.6. SWOT Analysis
10.4. Amy’s Kitchen, Inc.
10.4.1. Business Overview
10.4.2. Company Snapshot
10.4.3. Company Market Share Analysis
10.4.4. Company Product Portfolio
10.4.5. Recent Developments
10.4.6. SWOT Analysis
10.5. United Natural Foods, Inc.
10.5.1. Business Overview
10.5.2. Company Snapshot
10.5.3. Company Market Share Analysis
10.5.4. Company Product Portfolio
10.5.5. Recent Developments
10.5.6. SWOT Analysis
10.6. Starbucks Corporation
10.6.1. Business Overview
10.6.2. Company Snapshot
10.6.3. Company Market Share Analysis
10.6.4. Company Product Portfolio
10.6.5. Recent Developments
10.6.6. SWOT Analysis
10.7. SpartanNash Company
10.7.1. Business Overview
10.7.2. Company Snapshot
10.7.3. Company Market Share Analysis
10.7.4. Company Product Portfolio
10.7.5. Recent Developments
10.7.6. SWOT Analysis
10.8. The Kroger Co.
10.8.1. Business Overview
10.8.2. Company Snapshot
10.8.3. Company Market Share Analysis
10.8.4. Company Product Portfolio
10.8.5. Recent Developments
10.8.6. SWOT Analysis
10.9. General Mills Inc.
10.9.1. Business Overview
10.9.2. Company Snapshot
10.9.3. Company Market Share Analysis
10.9.4. Company Product Portfolio
10.9.5. Recent Developments
10.9.6. SWOT Analysis
10.10. Whole Foods Market Inc.
10.10.1. Business Overview
10.10.2. Company Snapshot
10.10.3. Company Market Share Analysis
10.10.4. Company Product Portfolio
10.10.5. Recent Developments
10.10.6. SWOT Analysis
List of Table
1. Global Organic Food And Beverages Market, By Product, 2019-2032 (USD Billion)
2. Global Organic Beverages, Organic Food And Beverages Market, By Region, 2019-2032 (USD Billion)
3. Global Organic Food, Organic Food And Beverages Market, By Region, 2019-2032 (USD Billion)
4. Global Organic Food And Beverages Market, By Distribution Channel, 2019-2032 (USD Billion)
5. Global Specialty Stores, Organic Food And Beverages Market, By Region, 2019-2032 (USD Billion)
6. Global Convenience Stores, Organic Food And Beverages Market, By Region, 2019-2032 (USD Billion)
7. Global Supermarket/Hypermarket, Organic Food And Beverages Market, By Region, 2019-2032 (USD Billion)
8. Global Online Sales Channel, Organic Food And Beverages Market, By Region, 2019-2032 (USD Billion)
9. Global Others, Organic Food And Beverages Market, By Region, 2019-2032 (USD Billion)
10. North America Organic Food And Beverages Market, By Product, 2019-2032 (USD Billion)
11. North America Organic Food And Beverages Market, By Distribution Channel, 2019-2032 (USD Billion)
12. U.S. Organic Food And Beverages Market, By Product, 2019-2032 (USD Billion)
13. U.S. Organic Food And Beverages Market, By Distribution Channel, 2019-2032 (USD Billion)
14. Canada Organic Food And Beverages Market, By Product, 2019-2032 (USD Billion)
15. Canada Organic Food And Beverages Market, By Distribution Channel, 2019-2032 (USD Billion)
16. Mexico Organic Food And Beverages Market, By Product, 2019-2032 (USD Billion)
17. Mexico Organic Food And Beverages Market, By Distribution Channel, 2019-2032 (USD Billion)
18. Europe Organic Food And Beverages Market, By Product, 2019-2032 (USD Billion)
19. Europe Organic Food And Beverages Market, By Distribution Channel, 2019-2032 (USD Billion)
20. Germany Organic Food And Beverages Market, By Product, 2019-2032 (USD Billion)
21. Germany Organic Food And Beverages Market, By Distribution Channel, 2019-2032 (USD Billion)
22. France Organic Food And Beverages Market, By Product, 2019-2032 (USD Billion)
23. France Organic Food And Beverages Market, By Distribution Channel, 2019-2032 (USD Billion)
24. U.K. Organic Food And Beverages Market, By Product, 2019-2032 (USD Billion)
25. U.K. Organic Food And Beverages Market, By Distribution Channel, 2019-2032 (USD Billion)
26. Italy Organic Food And Beverages Market, By Product, 2019-2032 (USD Billion)
27. Italy Organic Food And Beverages Market, By Distribution Channel, 2019-2032 (USD Billion)
28. Spain Organic Food And Beverages Market, By Product, 2019-2032 (USD Billion)
29. Spain Organic Food And Beverages Market, By Distribution Channel, 2019-2032 (USD Billion)
30. Asia Pacific Organic Food And Beverages Market, By Product, 2019-2032 (USD Billion)
31. Asia Pacific Organic Food And Beverages Market, By Distribution Channel, 2019-2032 (USD Billion)
32. Japan Organic Food And Beverages Market, By Product, 2019-2032 (USD Billion)
33. Japan Organic Food And Beverages Market, By Distribution Channel, 2019-2032 (USD Billion)
34. China Organic Food And Beverages Market, By Product, 2019-2032 (USD Billion)
35. China Organic Food And Beverages Market, By Distribution Channel, 2019-2032 (USD Billion)
36. India Organic Food And Beverages Market, By Product, 2019-2032 (USD Billion)
37. India Organic Food And Beverages Market, By Distribution Channel, 2019-2032 (USD Billion)
38. South America Organic Food And Beverages Market, By Product, 2019-2032 (USD Billion)
39. South America Organic Food And Beverages Market, By Distribution Channel, 2019-2032 (USD Billion)
40. Brazil Organic Food And Beverages Market, By Product, 2019-2032 (USD Billion)
41. Brazil Organic Food And Beverages Market, By Distribution Channel, 2019-2032 (USD Billion)
42. Middle East and Africa Organic Food And Beverages Market, By Product, 2019-2032 (USD Billion)
43. Middle East and Africa Organic Food And Beverages Market, By Distribution Channel, 2019-2032 (USD Billion)
44. UAE Organic Food And Beverages Market, By Product, 2019-2032 (USD Billion)
45. UAE Organic Food And Beverages Market, By Distribution Channel, 2019-2032 (USD Billion)
46. South Africa Organic Food And Beverages Market, By Product, 2019-2032 (USD Billion)
47. South Africa Organic Food And Beverages Market, By Distribution Channel, 2019-2032 (USD Billion)
List of Figures
1. Global Organic Food And Beverages Market Segmentation
2. Global Organic Food And Beverages Market: Research Methodology
3. Market Size Estimation Methodology: Bottom-Up Approach
4. Market Size Estimation Methodology: Top-Down Approach
5. Data Triangulation
6. Porter’s Five Forces Analysis
7. Value Chain Analysis
8. Global Organic Food And Beverages Market Attractiveness Analysis by Product
9. Global Organic Food And Beverages Market Attractiveness Analysis by Distribution Channel
10. Global Organic Food And Beverages Market Attractiveness Analysis by Region
11. Global Organic Food And Beverages Market: Dynamics
12. Global Organic Food And Beverages Market Share by Product (2023 & 2032)
13. Global Organic Food And Beverages Market Share by Distribution Channel (2023 & 2032)
14. Global Organic Food And Beverages Market Share by Regions (2023 & 2032)
15. Global Organic Food And Beverages Market Share by Company (2022)
This study forecasts global, regional, and country revenue from 2019 to 2032. The Brainy Insights has segmented the global organic food and beverage market based on the below-mentioned segments:
Global Organic Food And Beverages Market By Product:
Global Organic Food And Beverages Market By Distribution Channel:
Global Organic Food And Beverages Market By Region:
Research has its special purpose to undertake marketing efficiently. In this competitive scenario, businesses need information across all industry verticals; the information about customer wants, market demand, competition, industry trends, distribution channels etc. This information needs to be updated regularly because businesses operate in a dynamic environment. Our organization, The Brainy Insights incorporates scientific and systematic research procedures in order to get proper market insights and industry analysis for overall business success. The analysis consists of studying the market from a miniscule level wherein we implement statistical tools which helps us in examining the data with accuracy and precision.
Our research reports feature both; quantitative and qualitative aspects for any market. Qualitative information for any market research process are fundamental because they reveal the customer needs and wants, usage and consumption for any product/service related to a specific industry. This in turn aids the marketers/investors in knowing certain perceptions of the customers. Qualitative research can enlighten about the different product concepts and designs along with unique service offering that in turn, helps define marketing problems and generate opportunities. On the other hand, quantitative research engages with the data collection process through interviews, e-mail interactions, surveys and pilot studies. Quantitative aspects for the market research are useful to validate the hypotheses generated during qualitative research method, explore empirical patterns in the data with the help of statistical tools, and finally make the market estimations.
The Brainy Insights offers comprehensive research and analysis, based on a wide assortment of factual insights gained through interviews with CXOs and global experts and secondary data from reliable sources. Our analysts and industry specialist assume vital roles in building up statistical tools and analysis models, which are used to analyse the data and arrive at accurate insights with exceedingly informative research discoveries. The data provided by our organization have proven precious to a diverse range of companies, facilitating them to address issues such as determining which products/services are the most appealing, whether or not customers use the product in the manner anticipated, the purchasing intentions of the market and many others.
Our research methodology encompasses an idyllic combination of primary and secondary initiatives. Key phases involved in this process are listed below:

The phase involves the gathering and collecting of market data and its related information with the help of different sources & research procedures.

The data procurement stage involves in data gathering and collecting through various data sources.
This stage involves in extensive research. These data sources includes:
Purchased Database: Purchased databases play a crucial role in estimating the market sizes irrespective of the domain. Our purchased database includes:
Primary Research: The Brainy Insights interacts with leading companies and experts of the concerned domain to develop the analyst team’s market understanding and expertise. It improves and substantiates every single data presented in the market reports. Primary research mainly involves in telephonic interviews, E-mail interactions and face-to-face interviews with the raw material providers, manufacturers/producers, distributors, & independent consultants. The interviews that we conduct provides valuable data on market size and industry growth trends prevailing in the market. Our organization also conducts surveys with the various industry experts in order to gain overall insights of the industry/market. For instance, in healthcare industry we conduct surveys with the pharmacists, doctors, surgeons and nurses in order to gain insights and key information of a medical product/device/equipment which the customers are going to usage. Surveys are conducted in the form of questionnaire designed by our own analyst team. Surveys plays an important role in primary research because surveys helps us to identify the key target audiences of the market. Additionally, surveys helps to identify the key target audience engaged with the market. Our survey team conducts the survey by targeting the key audience, thus gaining insights from them. Based on the perspectives of the customers, this information is utilized to formulate market strategies. Moreover, market surveys helps us to understand the current competitive situation of the industry. To be precise, our survey process typically involve with the 360 analysis of the market. This analytical process begins by identifying the prospective customers for a product or service related to the market/industry to obtain data on how a product/service could fit into customers’ lives.

Secondary Research: The secondary data sources includes information published by the on-profit organizations such as World bank, WHO, company fillings, investor presentations, annual reports, national government documents, statistical databases, blogs, articles, white papers and others. From the annual report, we analyse a company’s revenue to understand the key segment and market share of that organization in a particular region. We analyse the company websites and adopt the product mapping technique which is important for deriving the segment revenue. In the product mapping method, we select and categorize the products offered by the companies catering to domain specific market, deduce the product revenue for each of the companies so as to get overall estimation of the market size. We also source data and analyses trends based on information received from supply side and demand side intermediaries in the value chain. The supply side denotes the data gathered from supplier, distributor, wholesaler and the demand side illustrates the data gathered from the end customers for respective market domain.

The supply side for a domain specific market is analysed by:
The demand side for the market is estimated through:
In-house Library: Apart from these third-party sources, we have our in-house library of qualitative and quantitative information. Our in-house database includes market data for various industry and domains. These data are updated on regular basis as per the changing market scenario. Our library includes, historic databases, internal audit reports and archives.
Sometimes there are instances where there is no metadata or raw data available for any domain specific market. For those cases, we use our expertise to forecast and estimate the market size in order to generate comprehensive data sets. Our analyst team adopt a robust research technique in order to produce the estimates:
Data Synthesis: This stage involves the analysis & mapping of all the information obtained from the previous step. It also involves in scrutinizing the data for any discrepancy observed while data gathering related to the market. The data is collected with consideration to the heterogeneity of sources. Robust scientific techniques are in place for synthesizing disparate data sets and provide the essential contextual information that can orient market strategies. The Brainy Insights has extensive experience in data synthesis where the data passes through various stages:


Market Deduction & Formulation: The final stage comprises of assigning data points at appropriate market spaces so as to deduce feasible conclusions. Analyst perspective & subject matter expert based holistic form of market sizing coupled with industry analysis also plays a crucial role in this stage.
This stage involves in finalization of the market size and numbers that we have collected from data integration step. With data interpolation, it is made sure that there is no gap in the market data. Successful trend analysis is done by our analysts using extrapolation techniques, which provide the best possible forecasts for the market.
Data Validation & Market Feedback: Validation is the most important step in the process. Validation & re-validation via an intricately designed process helps us finalize data-points to be used for final calculations.

The Brainy Insights interacts with leading companies and experts of the concerned domain to develop the analyst team’s market understanding and expertise. It improves and substantiates every single data presented in the market reports. The data validation interview and discussion panels are typically composed of the most experienced industry members. The participants include, however, are not limited to:
Moreover, we always validate our data and findings through primary respondents from all the major regions we are working on.


Free Customization
Fortune 500 Clients
Free Yearly Update On Purchase Of Multi/Corporate License
Companies Served Till Date