- +1-315-215-1633
- sales@thebrainyinsights.com

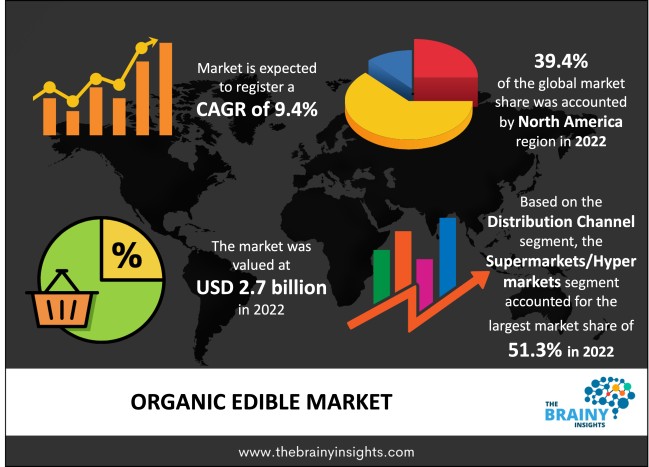
The global organic edible oil market was valued at USD 2.7 billion in 2022 and grew at a CAGR of 9.4% from 2023 to 2032. The market is expected to reach USD 6.6 billion by 2032. Cooking oil that is produced from different plants, flowers, and oil seeds that are cultivated without the use of chemicals is known as organic edible oil. The most widely used organic edible oils consumed on a large scale across the world include palm oil, sunflower oil, olive oil, mustard oil, coconut oil, avocado oil, and canola oil. Vegetable edible oil is used to manufacture spreads like margarine, which have several uses in baking and cooking, in addition to meal preparation. Organic edible oil has a high level of saturated fats, which has various health advantages for users. For consumers concerned about their health, a product that includes medium-chain fatty acids and is good for the immune system and brain function is offered at reasonable costs.
Vegetable oils produced utilizing organic agricultural methods, which implies they were cultivated without the use of synthetic pesticides, fertilizers, or other chemicals, are known as organic edible oils. The main factors driving the market demand globally are the growing consumer awareness of the health benefits of organic products, the high demand for natural and healthy foods, the rising incidence of chronic diseases, the increasing government support for organic agriculture, and the rising acceptance of organic edible oils.
Get an overview of this study by requesting a free sample
Edible oils are increasingly in demand as customers become more health aware and seek for organic and natural food options. Due to their low processing, lack of synthetic additives, and increased nutritional content, organic edible oils are seen as healthier alternatives to conventional oils. The market for organic edible oils is significantly influenced by consumer demand for a wholesome, nutrient-dense diet.
Edible oils that are organic are often more expensive than oils that are conventional. Costly certification procedures, smaller-scale manufacturing, and organic agricultural methods all raise production expenses, which are then passed on to customers. For customers that are sensitive to price, the premium pricing might be an obstacle since they might choose less expensive alternatives.
The market for organic edible oils offers lots of opportunities for product innovation and uniqueness. To differentiate themselves from rivals, manufacturers might experiment with distinctive oil mixtures, tastes, and packaging alternatives. Offering value-added goods might draw customers searching for new and intriguing culinary experiences, such as infused organic oils or specialty oils. Additionally, there is a growing consumer desire for natural and organic food items, including edible oils. Market growth is greatly facilitated by the rising public awareness of the environmental sustainability and health advantages of organic products. To meet the vast range of customer tastes, producers and merchants should take advantage of this need by providing a wide selection of organic edible oils.
North America region led the market in 2022 with the largest market share of 39.4%. Over the past few decades, Americans' desire for organic food has been gradually increasing. Increased consumption of organic foods is mostly driven by people’s concerns about their health. More people than not think organically produced goods are healthier than those made traditionally. In addition, the abundance of raw materials owing to the expansion of organic oilseed farming in North American nations is projected to sustain the continued expansion of the regional market in the years to come. The area used to produce organic oilseeds in the United States grew from 61,164 hectares in 2017 to 83,883 hectares in 2019, according to the Research Center of Organic Agriculture (FIBL).
North America Region Organic Edible Oil Market Share in 2022 - 39.4%
www.thebrainyinsights.com
Check the geographical analysis of this market by requesting a free sample
The soybean segment dominated the global market in 2022 with a market share of 44.6%. The primary driver of the segment's growth is the wide availability of organic soy. The FIBL study 2022 found that organic oilseeds had been cultivated on almost 578,000 acres in Asia, or around 32.7% of the global organic oilseeds area, with organic soybean production accounting for 74% of the region's total organic oilseeds area. Polyunsaturated fatty acids make up the majority of soybean oil's composition and are found in significant concentrations. The oil has a high concentration of vitamin K, that helps control the metabolism of bones. It has a bland and moderate flavor that allows the actual flavor of the cuisine to come through.
The Supermarkets/hypermarkets segment dominated the global market in 2022 with a market share of 51.3%. Supermarkets and hypermarkets provide a wide variety of brands and products all in one place. The main element influencing demand for supermarkets is their high level of ease in the shopping process. Customers may get a wide variety of foods at one location. Sales of food from supermarkets are boosted by the rise of private-label brands and the advancement of grocers.
| Attribute | Description |
|---|---|
| Market Size | Revenue (USD Billion) |
| Market size value in 2022 | USD 2.7 Billion |
| Market size value in 2032 | USD 6.6 Billion |
| CAGR (2023 to 2032) | 9.4% |
| Historical data | 2019-2021 |
| Base Year | 2022 |
| Forecast | 2023-2032 |
| Region | The regions analyzed for the market are Asia Pacific, Europe, South America, North America, and Middle East & Africa. Furthermore, the regions are further analyzed at the country level. |
| Segments | Type, Distribution channel |
As per The Brainy Insights, the size of the organic edible oil market was valued at USD 2.7 billion in 2022 to USD 6.6 billion by 2032.
The global organic edible oil market is growing at a CAGR of 9.4% during the forecast period 2023-2032.
The North America region emerged as the largest market for the organic edible oil.
The rise in adoption of organic and natural food options will influence the market's growth.
1. Introduction
1.1. Objectives of the Study
1.2. Market Definition
1.3. Research Scope
1.4. Currency
1.5. Key Target Audience
2. Research Methodology and Assumptions
3. Executive Summary
4. Premium Insights
4.1. Porter’s Five Forces Analysis
4.2. Value Chain Analysis
4.3. Top Investment Pockets
4.3.1. Market Attractiveness Analysis by Type
4.3.2. Market Attractiveness Analysis by Distribution Channel
4.3.3. Market Attractiveness Analysis by Region
4.4. Industry Trends
5. Market Dynamics
5.1. Market Evaluation
5.2. Drivers
5.2.1. Rise in adoption of organic and natural food options
5.3. Restraints
5.3.1. High cost
5.4. Opportunities
5.4.1. Product innovation
6. Global Organic Edible Oil Market Analysis and Forecast, By Type
6.1. Segment Overview
6.2. Soybean Oil
6.3. Palm Oil
6.4. Sunflower Oil
6.5. Coconut Oil
6.6. Rapeseed Oil
6.7. Others
7. Global Organic Edible Oil Market Analysis and Forecast, By Distribution Channel
7.1. Segment Overview
7.2. Supermarket/Hypermarket
7.3. Specialty Stores
7.4. Convenient Stores
7.5. Online
7.6. Others
8. Global Organic Edible Oil Market Analysis and Forecast, By Regional Analysis
8.1. Segment Overview
8.2. North America
8.2.1. U.S.
8.2.2. Canada
8.2.3. Mexico
8.3. Europe
8.3.1. Germany
8.3.2. France
8.3.3. U.K.
8.3.4. Italy
8.3.5. Spain
8.4. Asia-Pacific
8.4.1. Japan
8.4.2. China
8.4.3. India
8.5. South America
8.5.1. Brazil
8.6. Middle East and Africa
8.6.1. UAE
8.6.2. South Africa
9. Global Organic Edible Oil Market-Competitive Landscape
9.1. Overview
9.2. Market Share of Key Players in the Organic Edible Oil Market
9.2.1. Global Company Market Share
9.2.2. North America Company Market Share
9.2.3. Europe Company Market Share
9.2.4. APAC Company Market Share
9.3. Competitive Situations and Trends
9.3.1. Product Launches and Developments
9.3.2. Partnerships, Collaborations, and Agreements
9.3.3. Mergers & Acquisitions
9.3.4. Expansions
10. Company Profiles
10.1. Cargill Inc
10.1.1. Business Overview
10.1.2. Company Snapshot
10.1.3. Company Market Share Analysis
10.1.4. Company Product Portfolio
10.1.5. Recent Developments
10.1.6. SWOT Analysis
10.2. Nutna
10.2.1. Business Overview
10.2.2. Company Snapshot
10.2.3. Company Market Share Analysis
10.2.4. Company Product Portfolio
10.2.5. Recent Developments
10.2.6. SWOT Analysis
10.3. Catania Spagna
10.3.1. Business Overview
10.3.2. Company Snapshot
10.3.3. Company Market Share Analysis
10.3.4. Company Product Portfolio
10.3.5. Recent Developments
10.3.6. SWOT Analysis
10.4. EFKO Group
10.4.1. Business Overview
10.4.2. Company Snapshot
10.4.3. Company Market Share Analysis
10.4.4. Company Product Portfolio
10.4.5. Recent Developments
10.4.6. SWOT Analysis
10.5. Aryan International
10.5.1. Business Overview
10.5.2. Company Snapshot
10.5.3. Company Market Share Analysis
10.5.4. Company Product Portfolio
10.5.5. Recent Developments
10.5.6. SWOT Analysis
10.6. Adams Group
10.6.1. Business Overview
10.6.2. Company Snapshot
10.6.3. Company Market Share Analysis
10.6.4. Company Product Portfolio
10.6.5. Recent Developments
10.6.6. SWOT Analysis
10.7. Daabon Organic
10.7.1. Business Overview
10.7.2. Company Snapshot
10.7.3. Company Market Share Analysis
10.7.4. Company Product Portfolio
10.7.5. Recent Developments
10.7.6. SWOT Analysis
10.8. NOW Foods
10.8.1. Business Overview
10.8.2. Company Snapshot
10.8.3. Company Market Share Analysis
10.8.4. Company Product Portfolio
10.8.5. Recent Developments
10.8.6. SWOT Analysis
10.9. B&G Foods, Inc.
10.9.1. Business Overview
10.9.2. Company Snapshot
10.9.3. Company Market Share Analysis
10.9.4. Company Product Portfolio
10.9.5. Recent Developments
10.9.6. SWOT Analysis
10.10. Viva Naturals
10.10.1. Business Overview
10.10.2. Company Snapshot
10.10.3. Company Market Share Analysis
10.10.4. Company Product Portfolio
10.10.5. Recent Developments
10.10.6. SWOT Analysis
List of Table
1. Global Organic Edible Oil Market, By Type, 2019-2032 (USD Billion)
2. Global Soybean Oil, Organic Edible Oil Market, By Region, 2019-2032 (USD Billion)
3. Global Palm Oil, Organic Edible Oil Market, By Region, 2019-2032 (USD Billion)
4. Global Sunflower Oil, Organic Edible Oil Market, By Region, 2019-2032 (USD Billion)
5. Global Coconut Oil, Organic Edible Oil Market, By Region, 2019-2032 (USD Billion)
6. Global Rapeseed Oil, Organic Edible Oil Market, By Region, 2019-2032 (USD Billion)
7. Global Others, Organic Edible Oil Market, By Region, 2019-2032 (USD Billion)
8. Global Organic Edible Oil Market, By Distribution Channel, 2019-2032 (USD Billion)
9. Global Supermarket/Hypermarket, Organic Edible Oil Market, By Region, 2019-2032 (USD Billion)
10. Global Specialty Stores, Organic Edible Oil Market, By Region, 2019-2032 (USD Billion)
11. Global Convenient Stores, Organic Edible Oil Market, By Region, 2019-2032 (USD Billion)
12. Global Online, Organic Edible Oil Market, By Region, 2019-2032 (USD Billion)
13. Global Others, Organic Edible Oil Market, By Region, 2019-2032 (USD Billion)
14. Global Organic Edible Oil Market, By Region, 2019-2032 (USD Billion)
15. North America Organic Edible Oil Market, By Type, 2019-2032 (USD Billion)
16. North America Organic Edible Oil Market, By Distribution Channel, 2019-2032 (USD Billion)
17. U.S. Organic Edible Oil Market, By Type, 2019-2032 (USD Billion)
18. U.S. Organic Edible Oil Market, By Distribution Channel, 2019-2032 (USD Billion)
19. Canada Organic Edible Oil Market, By Type, 2019-2032 (USD Billion)
20. Canada Organic Edible Oil Market, By Distribution Channel, 2019-2032 (USD Billion)
21. Mexico Organic Edible Oil Market, By Type, 2019-2032 (USD Billion)
22. Mexico Organic Edible Oil Market, By Distribution Channel, 2019-2032 (USD Billion)
23. Europe Organic Edible Oil Market, By Type, 2019-2032 (USD Billion)
24. Europe Organic Edible Oil Market, By Distribution Channel, 2019-2032 (USD Billion)
25. Germany Organic Edible Oil Market, By Type, 2019-2032 (USD Billion)
26. Germany Organic Edible Oil Market, By Distribution Channel, 2019-2032 (USD Billion)
27. France Organic Edible Oil Market, By Type, 2019-2032 (USD Billion)
28. France Organic Edible Oil Market, By Distribution Channel, 2019-2032 (USD Billion)
29. U.K. Organic Edible Oil Market, By Type, 2019-2032 (USD Billion)
30. U.K. Organic Edible Oil Market, By Distribution Channel, 2019-2032 (USD Billion)
31. Italy Organic Edible Oil Market, By Type, 2019-2032 (USD Billion)
32. Italy Organic Edible Oil Market, By Distribution Channel, 2019-2032 (USD Billion)
33. Spain Organic Edible Oil Market, By Type, 2019-2032 (USD Billion)
34. Spain Organic Edible Oil Market, By Distribution Channel, 2019-2032 (USD Billion)
35. Asia Pacific Organic Edible Oil Market, By Type, 2019-2032 (USD Billion)
36. Asia Pacific Organic Edible Oil Market, By Distribution Channel, 2019-2032 (USD Billion)
37. Japan Organic Edible Oil Market, By Type, 2019-2032 (USD Billion)
38. Japan Organic Edible Oil Market, By Distribution Channel, 2019-2032 (USD Billion)
39. China Organic Edible Oil Market, By Type, 2019-2032 (USD Billion)
40. China Organic Edible Oil Market, By Distribution Channel, 2019-2032 (USD Billion)
41. India Organic Edible Oil Market, By Type, 2019-2032 (USD Billion)
42. India Organic Edible Oil Market, By Distribution Channel, 2019-2032 (USD Billion)
43. South America Organic Edible Oil Market, By Type, 2019-2032 (USD Billion)
44. South America Organic Edible Oil Market, By Distribution Channel, 2019-2032 (USD Billion)
45. Brazil Organic Edible Oil Market, By Type, 2019-2032 (USD Billion)
46. Brazil Organic Edible Oil Market, By Distribution Channel, 2019-2032 (USD Billion)
47. Middle East and Africa Organic Edible Oil Market, By Type, 2019-2032 (USD Billion)
48. Middle East and Africa Organic Edible Oil Market, By Distribution Channel, 2019-2032 (USD Billion)
49. UAE Organic Edible Oil Market, By Type, 2019-2032 (USD Billion)
50. UAE Organic Edible Oil Market, By Distribution Channel, 2019-2032 (USD Billion)
51. South Africa Organic Edible Oil Market, By Type, 2019-2032 (USD Billion)
52. South Africa Organic Edible Oil Market, By Distribution Channel, 2019-2032 (USD Billion)
List of Figures
1. Global Organic Edible Oil Market Segmentation
2. Organic Edible Oil Market: Research Methodology
3. Market Size Estimation Methodology: Bottom-Up Approach
4. Market Size Estimation Methodology: Top-Down Approach
5. Data Triangulation
6. Porter’s Five Forces Analysis
7. Value Chain Analysis
8. Global Organic Edible Oil Market Attractiveness Analysis by Type
9. Global Organic Edible Oil Market Attractiveness Analysis by Distribution Channel
10. Global Organic Edible Oil Market Attractiveness Analysis by Region
11. Global Organic Edible Oil Market: Dynamics
12. Global Organic Edible Oil Market Share by Type (2022 & 2032)
13. Global Organic Edible Oil Market Share by Distribution Channel (2022 & 2032)
14. Global Organic Edible Oil Market Share by Regions (2022 & 2032)
15. Global Organic Edible Oil Market Share by Company (2022)
This study forecasts revenue at global, regional, and country levels from 2019 to 2032. The Brainy Insights has segmented the global organic edible oil market based on below-mentioned segments:
Global Organic Edible Oil Market by Type:
Global Organic Edible Oil Market by Distribution Channel:
Global Organic Edible Oil Market by Region:
Research has its special purpose to undertake marketing efficiently. In this competitive scenario, businesses need information across all industry verticals; the information about customer wants, market demand, competition, industry trends, distribution channels etc. This information needs to be updated regularly because businesses operate in a dynamic environment. Our organization, The Brainy Insights incorporates scientific and systematic research procedures in order to get proper market insights and industry analysis for overall business success. The analysis consists of studying the market from a miniscule level wherein we implement statistical tools which helps us in examining the data with accuracy and precision.
Our research reports feature both; quantitative and qualitative aspects for any market. Qualitative information for any market research process are fundamental because they reveal the customer needs and wants, usage and consumption for any product/service related to a specific industry. This in turn aids the marketers/investors in knowing certain perceptions of the customers. Qualitative research can enlighten about the different product concepts and designs along with unique service offering that in turn, helps define marketing problems and generate opportunities. On the other hand, quantitative research engages with the data collection process through interviews, e-mail interactions, surveys and pilot studies. Quantitative aspects for the market research are useful to validate the hypotheses generated during qualitative research method, explore empirical patterns in the data with the help of statistical tools, and finally make the market estimations.
The Brainy Insights offers comprehensive research and analysis, based on a wide assortment of factual insights gained through interviews with CXOs and global experts and secondary data from reliable sources. Our analysts and industry specialist assume vital roles in building up statistical tools and analysis models, which are used to analyse the data and arrive at accurate insights with exceedingly informative research discoveries. The data provided by our organization have proven precious to a diverse range of companies, facilitating them to address issues such as determining which products/services are the most appealing, whether or not customers use the product in the manner anticipated, the purchasing intentions of the market and many others.
Our research methodology encompasses an idyllic combination of primary and secondary initiatives. Key phases involved in this process are listed below:

The phase involves the gathering and collecting of market data and its related information with the help of different sources & research procedures.

The data procurement stage involves in data gathering and collecting through various data sources.
This stage involves in extensive research. These data sources includes:
Purchased Database: Purchased databases play a crucial role in estimating the market sizes irrespective of the domain. Our purchased database includes:
Primary Research: The Brainy Insights interacts with leading companies and experts of the concerned domain to develop the analyst team’s market understanding and expertise. It improves and substantiates every single data presented in the market reports. Primary research mainly involves in telephonic interviews, E-mail interactions and face-to-face interviews with the raw material providers, manufacturers/producers, distributors, & independent consultants. The interviews that we conduct provides valuable data on market size and industry growth trends prevailing in the market. Our organization also conducts surveys with the various industry experts in order to gain overall insights of the industry/market. For instance, in healthcare industry we conduct surveys with the pharmacists, doctors, surgeons and nurses in order to gain insights and key information of a medical product/device/equipment which the customers are going to usage. Surveys are conducted in the form of questionnaire designed by our own analyst team. Surveys plays an important role in primary research because surveys helps us to identify the key target audiences of the market. Additionally, surveys helps to identify the key target audience engaged with the market. Our survey team conducts the survey by targeting the key audience, thus gaining insights from them. Based on the perspectives of the customers, this information is utilized to formulate market strategies. Moreover, market surveys helps us to understand the current competitive situation of the industry. To be precise, our survey process typically involve with the 360 analysis of the market. This analytical process begins by identifying the prospective customers for a product or service related to the market/industry to obtain data on how a product/service could fit into customers’ lives.

Secondary Research: The secondary data sources includes information published by the on-profit organizations such as World bank, WHO, company fillings, investor presentations, annual reports, national government documents, statistical databases, blogs, articles, white papers and others. From the annual report, we analyse a company’s revenue to understand the key segment and market share of that organization in a particular region. We analyse the company websites and adopt the product mapping technique which is important for deriving the segment revenue. In the product mapping method, we select and categorize the products offered by the companies catering to domain specific market, deduce the product revenue for each of the companies so as to get overall estimation of the market size. We also source data and analyses trends based on information received from supply side and demand side intermediaries in the value chain. The supply side denotes the data gathered from supplier, distributor, wholesaler and the demand side illustrates the data gathered from the end customers for respective market domain.

The supply side for a domain specific market is analysed by:
The demand side for the market is estimated through:
In-house Library: Apart from these third-party sources, we have our in-house library of qualitative and quantitative information. Our in-house database includes market data for various industry and domains. These data are updated on regular basis as per the changing market scenario. Our library includes, historic databases, internal audit reports and archives.
Sometimes there are instances where there is no metadata or raw data available for any domain specific market. For those cases, we use our expertise to forecast and estimate the market size in order to generate comprehensive data sets. Our analyst team adopt a robust research technique in order to produce the estimates:
Data Synthesis: This stage involves the analysis & mapping of all the information obtained from the previous step. It also involves in scrutinizing the data for any discrepancy observed while data gathering related to the market. The data is collected with consideration to the heterogeneity of sources. Robust scientific techniques are in place for synthesizing disparate data sets and provide the essential contextual information that can orient market strategies. The Brainy Insights has extensive experience in data synthesis where the data passes through various stages:


Market Deduction & Formulation: The final stage comprises of assigning data points at appropriate market spaces so as to deduce feasible conclusions. Analyst perspective & subject matter expert based holistic form of market sizing coupled with industry analysis also plays a crucial role in this stage.
This stage involves in finalization of the market size and numbers that we have collected from data integration step. With data interpolation, it is made sure that there is no gap in the market data. Successful trend analysis is done by our analysts using extrapolation techniques, which provide the best possible forecasts for the market.
Data Validation & Market Feedback: Validation is the most important step in the process. Validation & re-validation via an intricately designed process helps us finalize data-points to be used for final calculations.

The Brainy Insights interacts with leading companies and experts of the concerned domain to develop the analyst team’s market understanding and expertise. It improves and substantiates every single data presented in the market reports. The data validation interview and discussion panels are typically composed of the most experienced industry members. The participants include, however, are not limited to:
Moreover, we always validate our data and findings through primary respondents from all the major regions we are working on.


Free Customization
Fortune 500 Clients
Free Yearly Update On Purchase Of Multi/Corporate License
Companies Served Till Date