- +1-315-215-1633
- sales@thebrainyinsights.com

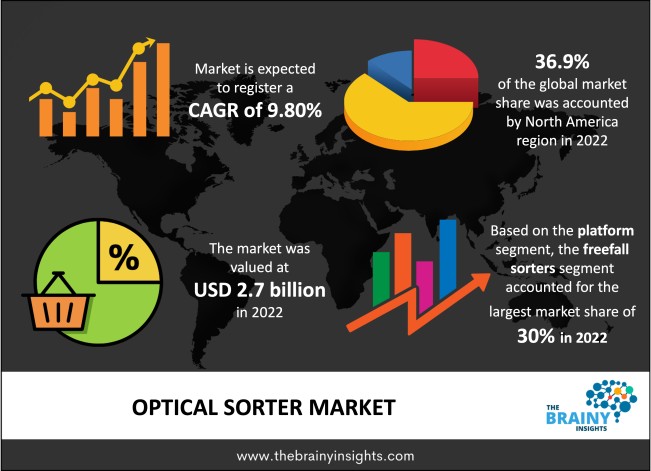
The global optical sorter market was valued at USD 2.7 billion in 2022 and growing at a CAGR of 9.80% from 2023 to 2032. The market is expected to reach USD 6.8 billion by 2032. The essential aspect pushing the development of the optical sorter market is improved food security and safety concerns. As customers expect an increased standard of product quality, there is a need for high-sort performance to catch minor and subtler flaws. There is strict regulation saying that all food makers are involved in the safety and security of their products, and due to this, the food cannot be harmful or toxic to consumers' health.
An optical sorter is a machine that automatically sorts objects based on visual criteria. It is also called sorting machines; optical sorters are usually found in food processing and manufacturing facilities. They are used to locate defects and isolate different types of items. There are different types of sorters, including some that use light sensors while others use infrared light. Optical sorters use reflected light to explore products allotment and presented to the viewing area. The singulation can be performed by using low-friction inclined chutes or conveyor belts. Specially designed optical filters narrow the reflected light into precise wavelengths that highlight the distinction between the acceptable product and the product to be rejected. Specialized IR, UV, CCD, or RGB cameras accept the reflected light from the product and send this information to be amplified and classified. The effective use of an optical sorter is to discover defects in products and extract defective items from the manufacturing process. These defects may be external or indicate a defective or unsafe product. For instance, a defect or size variation with one of the products could generate considerable problems in a factory that delivers a specific size item. An optical sorter can notice the defect and release the improperly sized part before it is removed from the factory. There are different kinds of optical sorters. The most basic design uses a simple light sensor known as a photodetector. These can sense the amount of light reflected by an object. Due to the dark things absorb light, an optical sorter with a photodetector can categorize items based on colour contrast. An optical sorting machine is essential in any processing operation. An optical sorting machine sorts food, plastic, and grain, achieving cleaner product quality. The sorting engine uses various inventions, including lighting, cameras, and Machine learning software. The machine eliminates the product of unknown materials. Therefore, it has a wide item range dependent on a financial plan, limit, and the item quality needed.
Get an overview of this study by requesting a free sample
In October 2021, PETKUS and Seed-X have declared their partnership and contract to create, distribute, and sell next-generation Artificial Intelligence optical seed and grain sorting machines. Seed-X is specialized in AI and deep-learning algorithms for seeds and grains profiling. The company will work with PETKUS, a global manufacturer of optical sorter machines for seed and grain. The agreement is to create next-generation sorters for upgrading seed lots and setting higher benchmarks for germination, purity, and usability.
In June 2022, Inaba Peanuts Co., Ltd., a Japan-based food processing manufacturer, executed the TOMRA 5B sorter for production in volumes and product consistency. It is used for sorting different snacks like almonds, chestnuts, cashews, almonds, fish, dried plums, walnuts, fried beans, and others.
Data storage facility- The sorting system can store data while it is working and storing it in the system. The primary goal of data storage is to confirm that the goods are sorted accurately and that the sorted goods are retrieved. When sorting goods manually, there are usually sorting errors or lost goods, leading to various problems in sorting. Therefore, sorting system data storage can effectively bypass such issues.
Cleaning and maintenance lead to machine downtime- Machine downtime is one of the most significant aspects of increased cost/ton in an MRF. It is essential to regularly clean and maintain optical sorters to provide system reliability and high performance, which includes the glass windows in front of the halogen lamps and NIR spectrometer, as well as the splitter rollers inside the catcher hood. A routine cleaning schedule helps reduce the potential for jams and keeps the sorting performance at its peak.
Multi-function operations- Colour sorters are effective as they can process coffee, wheat, rice, plastic, peanut, beans, and many other materials. The machine can be used in industries like farming, food, chemical, and other areas.
The regions analyzed for the market include North America, Europe, South America, Asia Pacific, the Middle East, and Africa. North America emerged as the largest market for the global optical sorter market, with a 36.9% share of the market revenue in 2022.
North America had the most significant market share. Optical sorting solutions produced by North American players such as CP Global, Machinex, Key Technology, and National Recovery Technologies push the market growth. Organizations in the region are concentrating on adopting the latest technologies in optical sorters, metal detectors, and hyperspectral cameras.
North America Region Optical Sorter Market Share in 2022 - 36.9%
www.thebrainyinsights.com
Check the geographical analysis of this market by requesting a free sample
The type segment is divided into lasers, hyperspectral cameras & combined sorters, NIR, cameras, and others. The hyperspectral cameras & combined sorters segment dominated the market, with a market share of around 25% in 2022. The technology enhances the removal of foreign material, and EVM outside vegetable matter, often with fewer false reject rates. The two primary hyperspectral imaging techniques are detecting rock minerals and catching foreign substances in food processing.
The platform segment is divided into belt, freefall, hybrid, and lane. The freefall sorters segment dominated the market, with a market share of around 30% in 2022. The advantages of a freefall sorter over a belt sorter are its lower price, smaller size (takes up less space), and absence of moving elements such as the belt, making it more comfortable to maintain.
The application segment is divided into recycling, mining, food, and others. The food segment dominated the market, with a market share of around 32% in 2022. The development of the market is the rising focus on automation to promote productivity, the rising need for the food industry to lower process and delivery times, the increasing cost of labour, and the emergence of stringent government rules about food safety.
| Attribute | Description |
|---|---|
| Market Size | Revenue (USD Billion), Volume (Units) |
| Market size value in 2022 | USD 2.7 Billion |
| Market size value in 2032 | USD 6.8 Billion |
| CAGR (2023 to 2032) | 9.80% |
| Historical data | 2019-2021 |
| Base Year | 2022 |
| Forecast | 2023-2032 |
| Regional Segments | The regions analyzed for the market are Asia Pacific, Europe, South America, North America, and Middle East & Africa. Furthermore, the regions are further analyzed at the country level. |
| Segments | Type, Platform, Application |
As per The Brainy Insights, the size of the optical sorter market was valued at USD 2.7 billion in 2022 to USD 6.8 billion by 2032.
Global optical sorter market is growing at a CAGR of 9.80% during the forecast period 2023-2032.
North America region emerged as the largest market for the optical sorter market.
Data storage facility drives the market growth.
1. Introduction
1.1. Objectives of the Study
1.2. Market Definition
1.3. Research Scope
1.4. Currency
1.5. Key Target Audience
2. Research Methodology and Assumptions
3. Executive Summary
4. Premium Insights
4.1. Porter’s Five Forces Analysis
4.2. Value Chain Analysis
4.3. Top Investment Pockets
4.3.1. Market Attractiveness Analysis by Type
4.3.2. Market Attractiveness Analysis by Platform
4.3.3. Market Attractiveness Analysis by Application
4.3.4. Market Attractiveness Analysis by Region
4.4. Industry Trends
5. Market Dynamics
5.1. Market Evaluation
5.2. Drivers
5.2.1. Data storage facility
5.3. Restraints
5.3.1. Cleaning and maintenance lead to machine downtime
5.4. Opportunities
5.4.1. Multi-function operations are pushing market growth
6. Global Optical Sorter Market Analysis and Forecast, By Type:
6.1. Segment Overview
6.2. Lasers
6.3. Hyperspectral cameras & Combined Sorters
6.4. NIR
6.5. Cameras
6.6. Others
7. Global Optical Sorter Market Analysis and Forecast, By Platform
7.1. Segment Overview
7.2. Belt
7.3. Freefall
7.4. Hybrid
7.5. Lane
8. Global Optical Sorter Market Analysis and Forecast, By Application
8.1. Segment Overview
8.2. Recycling
8.3. Mining
8.4. Food
8.5. Others
9. Global Optical Sorter Market Analysis and Forecast, By Regional Analysis
9.1. Segment Overview
9.2. North America
9.2.1. U.S.
9.2.2. Canada
9.2.3. Mexico
9.3. Europe
9.3.1. Germany
9.3.2. France
9.3.3. U.K.
9.3.4. Italy
9.3.5. Spain
9.4. Asia-Pacific
9.4.1. Japan
9.4.2. China
9.4.3. India
9.5. South America
9.5.1. Brazil
9.6. Middle East and Africa
9.6.1. UAE
9.6.2. South Africa
10. Global Optical Sorter Market-Competitive Landscape
10.1. Overview
10.2. Market Share of Key Players in the Optical Sorter Market
10.2.1. Global Company Market Share
10.2.2. North America Company Market Share
10.2.3. Europe Company Market Share
10.2.4. APAC Company Market Share
10.3. Competitive Situations and Trends
10.3.1. Product Launches and Developments
10.3.2. Partnerships, Collaborations, and Agreements
10.3.3. Mergers & Acquisitions
10.3.4. Expansions
11. Company Profiles
11.1. TOMRA Systems ASA
11.1.1. Business Overview
11.1.2. Company Snapshot
11.1.3. Company Market Share Analysis
11.1.4. Company Product Portfolio
11.1.5. Recent Developments
11.1.6. SWOT Analysis
11.2. STEINERT Global.
11.2.1. Business Overview
11.2.2. Company Snapshot
11.2.3. Company Market Share Analysis
11.2.4. Company Product Portfolio
11.2.5. Recent Developments
11.2.6. SWOT Analysis
11.3. Sesotec GmbH
11.3.1. Business Overview
11.3.2. Company Snapshot
11.3.3. Company Market Share Analysis
11.3.4. Company Product Portfolio
11.3.5. Recent Developments
11.3.6. SWOT Analysis
11.4. SATAKE Group.
11.4.1. Business Overview
11.4.2. Company Snapshot
11.4.3. Company Market Share Analysis
11.4.4. Company Product Portfolio
11.4.5. Recent Developments
11.4.6. SWOT Analysis
11.5. Raytec Vision S.p.A.
11.5.1. Business Overview
11.5.2. Company Snapshot
11.5.3. Company Market Share Analysis
11.5.4. Company Product Portfolio
11.5.5. Recent Developments
11.5.6. SWOT Analysis
11.6. Pellence ST
11.6.1. Business Overview
11.6.2. Company Snapshot
11.6.3. Company Market Share Analysis
11.6.4. Company Product Portfolio
11.6.5. Recent Developments
11.6.6. SWOT Analysis
11.7. NEWTEC.
11.7.1. Business Overview
11.7.2. Company Snapshot
11.7.3. Company Market Share Analysis
11.7.4. Company Product Portfolio
11.7.5. Recent Developments
11.7.6. SWOT Analysis
11.8. National Recovery Technologies
11.8.1. Business Overview
11.8.2. Company Snapshot
11.8.3. Company Market Share Analysis
11.8.4. Company Product Portfolio
11.8.5. Recent Developments
11.8.6. SWOT Analysis
11.9. Key Technologies Inc
11.9.1. Business Overview
11.9.2. Company Snapshot
11.9.3. Company Market Share Analysis
11.9.4. Company Product Portfolio
11.9.5. Recent Developments
11.9.6. SWOT Analysis
11.10. GREEFA
11.10.1. Business Overview
11.10.2. Company Snapshot
11.10.3. Company Market Share Analysis
11.10.4. Company Product Portfolio
11.10.5. Recent Developments
11.10.6. SWOT Analysis
11.11. CP Manufacturing Inc.
11.11.1. Business Overview
11.11.2. Company Snapshot
11.11.3. Company Market Share Analysis
11.11.4. Company Product Portfolio
11.11.5. Recent Developments
11.11.6. SWOT Analysis
11.12. Cimbria Heid GmbH.
11.12.1. Business Overview
11.12.2. Company Snapshot
11.12.3. Company Market Share Analysis
11.12.4. Company Product Portfolio
11.12.5. Recent Developments
11.12.6. SWOT Analysis
11.13. Buhler Group
11.13.1. Business Overview
11.13.2. Company Snapshot
11.13.3. Company Market Share Analysis
11.13.4. Company Product Portfolio
11.13.5. Recent Developments
11.13.6. SWOT Analysis
11.14. BINDER GmbH
11.14.1. Business Overview
11.14.2. Company Snapshot
11.14.3. Company Market Share Analysis
11.14.4. Company Product Portfolio
11.14.5. Recent Developments
11.14.6. SWOT Analysis
11.15. Allgaier Werke Group
11.15.1. Business Overview
11.15.2. Company Snapshot
11.15.3. Company Market Share Analysis
11.15.4. Company Product Portfolio
11.15.5. Recent Developments
11.15.6. SWOT Analysis
List of Table
1. Global Optical Sorter Market, By Type, 2019-2032 (USD Billion)
2. Global Lasers Optical Sorter Market, By Region, 2019-2032 (USD Billion)
3. Global Hyperspectral cameras & Combined Sorters Optical Sorter Market, By Region, 2019-2032 (USD Billion)
4. Global NIR Optical Sorter Market, By Region, 2019-2032 (USD Billion)
5. Global Cameras Optical Sorter Market, By Region, 2019-2032 (USD Billion)
6. Global Others Optical Sorter Market, By Region, 2019-2032 (USD Billion)
7. Global Optical Sorter Market, By Platform, 2019-2032 (USD Billion)
8. Global Belt Optical Sorter Market, By Region, 2019-2032 (USD Billion)
9. Global Freefall Optical Sorter Market, By Region, 2019-2032 (USD Billion)
10. Global Hybrid Optical Sorter Market, By Region, 2019-2032 (USD Billion)
11. Global Lane Optical Sorter Market, By Region, 2019-2032 (USD Billion)
12. Global Optical Sorter Market, By Application, 2019-2032 (USD Billion)
13. Global Recycling Optical Sorter Market, By Region, 2019-2032 (USD Billion)
14. Global Mining Optical Sorter Market, By Region, 2019-2032 (USD Billion)
15. Global Food Optical Sorter Market, By Region, 2019-2032 (USD Billion)
16. Global Others Optical Sorter Market, By Region, 2019-2032 (USD Billion)
17. North America Optical Sorter Market, By Type, 2019-2032 (USD Billion)
18. North America Optical Sorter Market, By Platform, 2019-2032 (USD Billion)
19. North America Optical Sorter Market, By Application, 2019-2032 (USD Billion)
20. U.S. Optical Sorter Market, By Type, 2019-2032 (USD Billion)
21. U.S. Optical Sorter Market, By Platform, 2019-2032 (USD Billion)
22. U.S. Optical Sorter Market, By Application, 2019-2032 (USD Billion)
23. Canada Optical Sorter Market, By Type, 2019-2032 (USD Billion)
24. Canada Optical Sorter Market, By Platform, 2019-2032 (USD Billion)
25. Canada Optical Sorter Market, By Application, 2019-2032 (USD Billion)
26. Mexico Optical Sorter Market, By Type, 2019-2032 (USD Billion)
27. Mexico Optical Sorter Market, By Platform, 2019-2032 (USD Billion)
28. Mexico Optical Sorter Market, By Application, 2019-2032 (USD Billion)
29. Europe Optical Sorter Market, By Type, 2019-2032 (USD Billion)
30. Europe Optical Sorter Market, By Platform, 2019-2032 (USD Billion)
31. Europe Optical Sorter Market, By Application, 2019-2032 (USD Billion)
32. Germany Optical Sorter Market, By Type, 2019-2032 (USD Billion)
33. Germany Optical Sorter Market, By Platform, 2019-2032 (USD Billion)
34. Germany Optical Sorter Market, By Application, 2019-2032 (USD Billion)
35. France Optical Sorter Market, By Type 2019-2032 (USD Billion)
36. France Optical Sorter Market, By Platform, 2019-2032 (USD Billion)
37. France Optical Sorter Market, By Application, 2019-2032 (USD Billion)
38. U.K. Optical Sorter Market, By Type, 2019-2032 (USD Billion)
39. U.K. Optical Sorter Market, By Platform, 2019-2032 (USD Billion)
40. U.K. Optical Sorter Market, By Application, 2019-2032 (USD Billion)
41. Italy Optical Sorter Market, By Type, 2019-2032 (USD Billion)
42. Italy Optical Sorter Market, By Platform, 2019-2032 (USD Billion)
43. Italy Optical Sorter Market, By Application, 2019-2032 (USD Billion)
44. Spain Optical Sorter Market, By Type, 2019-2032 (USD Billion)
45. Spain Optical Sorter Market, By Platform, 2019-2032 (USD Billion)
46. Spain Optical Sorter Market, By Application, 2019-2032 (USD Billion)
47. Asia Pacific Optical Sorter Market, By Type, 2019-2032 (USD Billion)
48. Asia Pacific Optical Sorter Market, By Platform, 2019-2032 (USD Billion)
49. Asia Pacific Optical Sorter Market, By Application, 2019-2032 (USD Billion)
50. Japan Optical Sorter Market, By Type, 2019-2032 (USD Billion)
51. Japan Optical Sorter Market, By Platform, 2019-2032 (USD Billion)
52. Japan Optical Sorter Market, By Application, 2019-2032 (USD Billion)
53. China Optical Sorter Market, By Type 2019-2032 (USD Billion)
54. China Optical Sorter Market, By Platform, 2019-2032 (USD Billion)
55. China Optical Sorter Market, By Application, 2019-2032 (USD Billion)
56. India Optical Sorter Market, By Type 2019-2032 (USD Billion)
57. India Optical Sorter Market, By Platform, 2019-2032 (USD Billion)
58. India Optical Sorter Market, By Application, 2019-2032 (USD Billion)
59. South America Optical Sorter Market, By Type, 2019-2032 (USD Billion)
60. South America Optical Sorter Market, By Platform, 2019-2032 (USD Billion)
61. South America Optical Sorter Market, By Application, 2019-2032 (USD Billion)
62. Brazil Optical Sorter Market, By Type 2019-2032 (USD Billion)
63. Brazil Optical Sorter Market, By Platform, 2019-2032 (USD Billion)
64. Brazil Optical Sorter Market, By Application, 2019-2032 (USD Billion)
65. Middle East and Africa Optical Sorter Market, By Type, 2019-2032 (USD Billion)
66. Middle East and Africa Optical Sorter Market, By Platform, 2019-2032 (USD Billion)
67. Middle East and Africa Optical Sorter Market, By Application, 2019-2032 (USD Billion)
68. UAE Optical Sorter Market, By Type, 2019-2032 (USD Billion)
69. UAE Optical Sorter Market, By Platform, 2019-2032 (USD Billion)
70. UAE Optical Sorter Market, By Application, 2019-2032 (USD Billion)
71. South Africa Optical Sorter Market, By Type 2019-2032 (USD Billion)
72. South Africa Optical Sorter Market, By Platform, 2019-2032 (USD Billion)
73. South Africa Optical Sorter Market, By Application, 2019-2032 (USD Billion)
List of Figures
1. Global Optical Sorter Market Segmentation
2. Optical Sorter Market: Research Methodology
3. Market Size Estimation Methodology: Bottom-Up Approach
4. Market Size Estimation Methodology: Top-Down Approach
5. Data Triangulation
6. Porter’s Five Forces Analysis
7. Value Chain Analysis
8. Global Optical Sorter Market Attractiveness Analysis by Type
9. Global Optical Sorter Market Attractiveness Analysis by Platform
10. Global Optical Sorter Market Attractiveness Analysis by Application
11. Global Optical Sorter Market Attractiveness Analysis by Region
12. Global Optical Sorter Market: Dynamics
13. Global Optical Sorter Market Share by Type (2022 & 2032)
14. Global Optical Sorter Market Share by Platform (2022 & 2032)
15. Global Optical Sorter Market Share by Application (2022 & 2032)
16. Global Optical Sorter Market Share by Regions (2022 & 2032)
17. Global Optical Sorter Market Share by Company (2022)
This study forecasts revenue at global, regional, and country levels from 2019 to 2032. The Brainy Insights has segmented the global optical sorter market based on below mentioned segments:
Global Optical Sorter Market Type:
Global Optical Sorter Market Platform:
Global Optical Sorter Market Application:
Global Optical Sorter Market by Region:
Research has its special purpose to undertake marketing efficiently. In this competitive scenario, businesses need information across all industry verticals; the information about customer wants, market demand, competition, industry trends, distribution channels etc. This information needs to be updated regularly because businesses operate in a dynamic environment. Our organization, The Brainy Insights incorporates scientific and systematic research procedures in order to get proper market insights and industry analysis for overall business success. The analysis consists of studying the market from a miniscule level wherein we implement statistical tools which helps us in examining the data with accuracy and precision.
Our research reports feature both; quantitative and qualitative aspects for any market. Qualitative information for any market research process are fundamental because they reveal the customer needs and wants, usage and consumption for any product/service related to a specific industry. This in turn aids the marketers/investors in knowing certain perceptions of the customers. Qualitative research can enlighten about the different product concepts and designs along with unique service offering that in turn, helps define marketing problems and generate opportunities. On the other hand, quantitative research engages with the data collection process through interviews, e-mail interactions, surveys and pilot studies. Quantitative aspects for the market research are useful to validate the hypotheses generated during qualitative research method, explore empirical patterns in the data with the help of statistical tools, and finally make the market estimations.
The Brainy Insights offers comprehensive research and analysis, based on a wide assortment of factual insights gained through interviews with CXOs and global experts and secondary data from reliable sources. Our analysts and industry specialist assume vital roles in building up statistical tools and analysis models, which are used to analyse the data and arrive at accurate insights with exceedingly informative research discoveries. The data provided by our organization have proven precious to a diverse range of companies, facilitating them to address issues such as determining which products/services are the most appealing, whether or not customers use the product in the manner anticipated, the purchasing intentions of the market and many others.
Our research methodology encompasses an idyllic combination of primary and secondary initiatives. Key phases involved in this process are listed below:

The phase involves the gathering and collecting of market data and its related information with the help of different sources & research procedures.

The data procurement stage involves in data gathering and collecting through various data sources.
This stage involves in extensive research. These data sources includes:
Purchased Database: Purchased databases play a crucial role in estimating the market sizes irrespective of the domain. Our purchased database includes:
Primary Research: The Brainy Insights interacts with leading companies and experts of the concerned domain to develop the analyst team’s market understanding and expertise. It improves and substantiates every single data presented in the market reports. Primary research mainly involves in telephonic interviews, E-mail interactions and face-to-face interviews with the raw material providers, manufacturers/producers, distributors, & independent consultants. The interviews that we conduct provides valuable data on market size and industry growth trends prevailing in the market. Our organization also conducts surveys with the various industry experts in order to gain overall insights of the industry/market. For instance, in healthcare industry we conduct surveys with the pharmacists, doctors, surgeons and nurses in order to gain insights and key information of a medical product/device/equipment which the customers are going to usage. Surveys are conducted in the form of questionnaire designed by our own analyst team. Surveys plays an important role in primary research because surveys helps us to identify the key target audiences of the market. Additionally, surveys helps to identify the key target audience engaged with the market. Our survey team conducts the survey by targeting the key audience, thus gaining insights from them. Based on the perspectives of the customers, this information is utilized to formulate market strategies. Moreover, market surveys helps us to understand the current competitive situation of the industry. To be precise, our survey process typically involve with the 360 analysis of the market. This analytical process begins by identifying the prospective customers for a product or service related to the market/industry to obtain data on how a product/service could fit into customers’ lives.

Secondary Research: The secondary data sources includes information published by the on-profit organizations such as World bank, WHO, company fillings, investor presentations, annual reports, national government documents, statistical databases, blogs, articles, white papers and others. From the annual report, we analyse a company’s revenue to understand the key segment and market share of that organization in a particular region. We analyse the company websites and adopt the product mapping technique which is important for deriving the segment revenue. In the product mapping method, we select and categorize the products offered by the companies catering to domain specific market, deduce the product revenue for each of the companies so as to get overall estimation of the market size. We also source data and analyses trends based on information received from supply side and demand side intermediaries in the value chain. The supply side denotes the data gathered from supplier, distributor, wholesaler and the demand side illustrates the data gathered from the end customers for respective market domain.

The supply side for a domain specific market is analysed by:
The demand side for the market is estimated through:
In-house Library: Apart from these third-party sources, we have our in-house library of qualitative and quantitative information. Our in-house database includes market data for various industry and domains. These data are updated on regular basis as per the changing market scenario. Our library includes, historic databases, internal audit reports and archives.
Sometimes there are instances where there is no metadata or raw data available for any domain specific market. For those cases, we use our expertise to forecast and estimate the market size in order to generate comprehensive data sets. Our analyst team adopt a robust research technique in order to produce the estimates:
Data Synthesis: This stage involves the analysis & mapping of all the information obtained from the previous step. It also involves in scrutinizing the data for any discrepancy observed while data gathering related to the market. The data is collected with consideration to the heterogeneity of sources. Robust scientific techniques are in place for synthesizing disparate data sets and provide the essential contextual information that can orient market strategies. The Brainy Insights has extensive experience in data synthesis where the data passes through various stages:


Market Deduction & Formulation: The final stage comprises of assigning data points at appropriate market spaces so as to deduce feasible conclusions. Analyst perspective & subject matter expert based holistic form of market sizing coupled with industry analysis also plays a crucial role in this stage.
This stage involves in finalization of the market size and numbers that we have collected from data integration step. With data interpolation, it is made sure that there is no gap in the market data. Successful trend analysis is done by our analysts using extrapolation techniques, which provide the best possible forecasts for the market.
Data Validation & Market Feedback: Validation is the most important step in the process. Validation & re-validation via an intricately designed process helps us finalize data-points to be used for final calculations.

The Brainy Insights interacts with leading companies and experts of the concerned domain to develop the analyst team’s market understanding and expertise. It improves and substantiates every single data presented in the market reports. The data validation interview and discussion panels are typically composed of the most experienced industry members. The participants include, however, are not limited to:
Moreover, we always validate our data and findings through primary respondents from all the major regions we are working on.


Free Customization
Fortune 500 Clients
Free Yearly Update On Purchase Of Multi/Corporate License
Companies Served Till Date