- +1-315-215-1633
- sales@thebrainyinsights.com

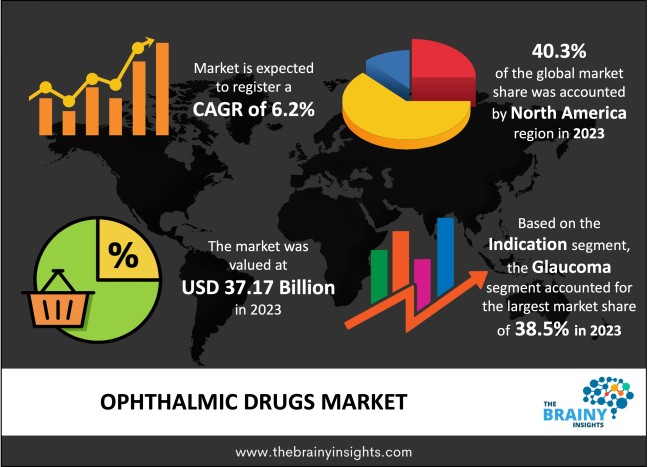
The global ophthalmic drugs market was valued at USD 37.17 billion in 2023 and grew at a CAGR of 6.2% from 2024 to 2033. The market is expected to reach USD 67.83 billion by 2033. The increasing incidence of eye disorders will drive the growth of the global ophthalmic drugs market. For years, ophthalmic drugs have been an important area of focus in pharmaceutical technology. This is because it's difficult to deliver medicinal substances effectively when applied directly onto the eye due to various factors such as its complex anatomical structure, limited surface for absorption and low lipophilicity resulting from a cornea that has poor transparency. Other barriers include metabolic breakdowns, drug-protein binding tears, and defence mechanisms like tearing up or blinking, restraining the market growth and development in the current situation. Despite these challenges, extensive research efforts are ongoing, with consistent innovations leading to significant growth within the market for ophthalmic medications today.
Ophthalmic drugs are medications offered for eyes when damaged, irritated, injured or swollen, among other things. Ophthalmic drugs are mostly manufactured as eye drops, given the ease of use they offer consumers. Furthermore, eye drops enable the manufacturers to curate and produce optimal dosages. They treat various eye diseases and infections and offer relief to the user. Dry eye, glaucoma, and ocular damage from bacterial infections are treated with the help of ophthalmic drugs. Ophthalmic antibiotics, a niche segment of ophthalmic drugs, treat eye infections. The ease of preparation and application, precise dose, and high patient comfort and compliance make ophthalmic drugs like eye drops one of the most popular drug delivery methods. Sterility, preservation, particle limitations, pH, stability, and eye comfort — are the foundational elements of ophthalmic preparations.
Get an overview of this study by requesting a free sample
The prevalent expansion of the digital age – The world is becoming digitally advanced and automated in every sphere of life. The lifestyle changes, the nature of work and life revolves around screens. Prolonged screen exposure has contributed to rising eye disorders and infections. The environmental changes associated with climate change also contribute to the rise of eye infections and diseases. The increasing use of smartphones, laptops, PCs, and tablets for educational, recreational and work purposes contributes to the rise of eye disorders wherein the eye becomes dry, irritated, red and loses flexibility. The increasing screen time will contribute to the rising incidence of eye disorders, infections and diseases, driving the demand for ophthalmic drugs worldwide.
The risks associated with ophthalmic drugs – The eyes are an extremely sensitive organ of the human body. Any medications used to treat eye disorders or infections are thoroughly examined, tried and tested to ensure their safety, efficacy and reliability. However, there have been several instances wherein lapses in manufacturing, assembly, storage or packaging have led to contamination of ophthalmic drugs, eventually leading to loss of vision, discomfort in the patient or death in some cases. Therefore, the risks associated with ophthalmic drugs impede the market's growth.
The increasing research and development – The increasing incidence of eye disorders, infections, and patients have led to the development of novel ophthalmic drugs to treat them. Both public and private market players are investing heavily towards developing affordable, accessible and effective generic ophthalmic drugs to improve community health. Therefore, the increasing research and development will contribute to the global ophthalmic drugs market’s growth during the forecast period.
The regions analyzed for the market include North America, Europe, South America, Asia Pacific, the Middle East, and Africa. North America emerged as the most significant global ophthalmic drugs market, with a 40.3% market revenue share in 2023.
The increasing prevalence of the geriatric population will contribute to the market's growth. Given the lifestyle and environmental changes, the increasing incidence of eye infections and disorders will also augment the market's growth. The accessibility of ophthalmic drugs, given the well-established and networked healthcare infrastructure, will also bode well for the market's growth. The presence of significant market players will also contribute to the market's development during the forecast period.
North America Region Ophthalmic Drugs Market Share in 2023 – 40.3%
www.thebrainyinsights.com
Check the geographical analysis of this market by requesting a free sample
The indication segment is divided into dry eye, allergies, infection, retinal disorders, glaucoma, and others. The glaucoma segment dominated the market, with a market share of 38.5% in 2023. A collection of eye conditions known as glaucoma can result in vision loss and blindness. It is caused when the optic nerve is damaged due to pressure or fluid buildup. The symptoms appear gradually. The administered eye drop for glaucoma is Xalatan. Glaucoma can affect individuals from any age group. However, it is most common in elders, and the increasing geriatric population will drive the segment's growth.
The drug class segment is divided into anti-allergy, anti-glaucoma, anti-inflammatory, anti-VEGF agents, anti-allergy and others. The anti-VEGF segment dominated the market, with a market share of 39.2% in 2023. These drugs are highly effective as they are known to prevent blindness due to blockage in the optic nerve. VEGF stands for vascular endothelial growth factor, a protein that builds up and can lead to blindness.
The dosage form segment is divided into gels, capsules and tablets, eye drops, eye solutions and suspensions, and ointments. The eye drops segment dominated the market, with a market share of 43.3% in 2023. Eye drops are the most known and highly accessible ophthalmic drugs, driving the segment's growth. They are easy to use and offer instant relief to the patient. They are available over the counter as well. They are affordable, given the wide variety of generic forms available. Furthermore, regular usage of ophthalmic drugs is often preferred through eye drops over others, given the convenience, familiarity and ease of use.
The distribution channel segment is divided into hospital pharmacies, drug stores, online pharmacies, and others. The drug stores segment dominated the market, with a market share of 40.6% in 2023. Over-the-counter ophthalmic drugs are available at nearby drug stores across regions, given their easy accessibility and affordability offered by these platforms. The increasing presence of retail drug store chains has increased their accessibility across regions.
| Attribute | Description |
|---|---|
| Market Size | Revenue (USD Billion) |
| Market size value in 2023 | USD 37.17 Billion |
| Market size value in 2033 | USD 67.83 Billion |
| CAGR (2024 to 2033) | 6.2% |
| Historical data | 2020-2022 |
| Base Year | 2023 |
| Forecast | 2024-2033 |
| Region | The regions analyzed for the market are Asia Pacific, Europe, South America, North America, and Middle East Africa. Furthermore, the regions are further analyzed at the country level. |
| Segments | Indication, Drug Class, Dosage Form and Distribution Channel |
As per The Brainy Insights, the size of the global ophthalmic drugs market was valued at USD 37.17 billion in 2023 to USD 67.83 billion by 2033.
Global ophthalmic drugs market is growing at a CAGR of 6.2% during the forecast period 2024-2033.
The market's growth will be influenced by the prevalent expansion of digital age.
The risks associated with ophthalmic drugs could hamper the market growth.
1. Introduction
1.1. Objectives of the Study
1.2. Market Definition
1.3. Research Scope
1.4. Currency
1.5. Key Target Audience
2. Research Methodology and Assumptions
3. Executive Summary
4. Premium Insights
4.1. Porter’s Five Forces Analysis
4.2. Value Chain Analysis
4.3. Top Investment Pockets
4.3.1. Market Attractiveness Analysis by Indication
4.3.2. Market Attractiveness Analysis by Drug Class
4.3.3. Market Attractiveness Analysis by Dosage Form
4.3.4. Market Attractiveness Analysis by Distribution Channel
4.3.5. Market Attractiveness Analysis by Region
4.4. Industry Trends
5. Market Dynamics
5.1. Market Evaluation
5.2. Drivers
5.2.1. The prevalent expansion of digital age
5.3. Restraints
5.3.1. The risks associated with ophthalmic drugs
5.4. Opportunities
5.4.1. The increasing research and development
5.5. Challenges
5.5.1. Stringent government regulations
6. Global Ophthalmic Drugs Market Analysis and Forecast, By Indication
6.1. Segment Overview
6.2. Dry Eye
6.3. Allergies
6.4. Infection
6.5. Retinal Disorders
6.6. Glaucoma
6.7. Others
7. Global Ophthalmic Drugs Market Analysis and Forecast, By Drug Class
7.1. Segment Overview
7.2. Anti-Allergy
7.3. Anti-Glaucoma
7.4. Anti-Inflammatory
7.5. Anti-VEGF Agents
7.6. Anti-Allergy
7.7. Others
8. Global Ophthalmic Drugs Market Analysis and Forecast, By Dosage Form
8.1. Segment Overview
8.2. Gels
8.3. Capsules and Tablets
8.4. Eye Drops
8.5. Eye Solutions and Suspensions
8.6. Ointments
9. Global Ophthalmic Drugs Market Analysis and Forecast, By Distribution Channel
9.1. Segment Overview
9.2. Hospital Pharmacies
9.3. Drug Stores
9.4. Online Pharmacies
9.5. Others
10. Global Ophthalmic Drugs Market Analysis and Forecast, By Regional Analysis
10.1. Segment Overview
10.2. North America
10.2.1. U.S.
10.2.2. Canada
10.2.3. Mexico
10.3. Europe
10.3.1. Germany
10.3.2. France
10.3.3. U.K.
10.3.4. Italy
10.3.5. Spain
10.4. Asia-Pacific
10.4.1. Japan
10.4.2. China
10.4.3. India
10.5. South America
10.5.1. Brazil
10.6. Middle East and Africa
10.6.1. UAE
10.6.2. South Africa
11. Global Ophthalmic Drugs Market-Competitive Landscape
11.1. Overview
11.2. Market Share of Key Players in the Ophthalmic Drugs Market
11.2.1. Global Company Market Share
11.2.2. North America Company Market Share
11.2.3. Europe Company Market Share
11.2.4. APAC Company Market Share
11.3. Competitive Situations and Trends
11.3.1. Product Launches and Developments
11.3.2. Partnerships, Collaborations, and Agreements
11.3.3. Mergers & Acquisitions
11.3.4. Expansions
12. Company Profiles
12.1. Alcon
12.1.1. Business Overview
12.1.2. Company Snapshot
12.1.3. Company Market Share Analysis
12.1.4. Company Product Portfolio
12.1.5. Recent Developments
12.1.6. SWOT Analysis
12.2. Allergan
12.2.1. Business Overview
12.2.2. Company Snapshot
12.2.3. Company Market Share Analysis
12.2.4. Company Product Portfolio
12.2.5. Recent Developments
12.2.6. SWOT Analysis
12.3. Bausch Health Companies Inc.
12.3.1. Business Overview
12.3.2. Company Snapshot
12.3.3. Company Market Share Analysis
12.3.4. Company Product Portfolio
12.3.5. Recent Developments
12.3.6. SWOT Analysis
12.4. Bayer AG
12.4.1. Business Overview
12.4.2. Company Snapshot
12.4.3. Company Market Share Analysis
12.4.4. Company Product Portfolio
12.4.5. Recent Developments
12.4.6. SWOT Analysis
12.5. Coherus Biosciences, Inc.
12.5.1. Business Overview
12.5.2. Company Snapshot
12.5.3. Company Market Share Analysis
12.5.4. Company Product Portfolio
12.5.5. Recent Developments
12.5.6. SWOT Analysis
12.6. Genentech, Inc.
12.6.1. Business Overview
12.6.2. Company Snapshot
12.6.3. Company Market Share Analysis
12.6.4. Company Product Portfolio
12.6.5. Recent Developments
12.6.6. SWOT Analysis
12.7. Merck & Co., Inc.
12.7.1. Business Overview
12.7.2. Company Snapshot
12.7.3. Company Market Share Analysis
12.7.4. Company Product Portfolio
12.7.5. Recent Developments
12.7.6. SWOT Analysis
12.8. Novartis AG
12.8.1. Business Overview
12.8.2. Company Snapshot
12.8.3. Company Market Share Analysis
12.8.4. Company Product Portfolio
12.8.5. Recent Developments
12.8.6. SWOT Analysis
12.9. Pfizer Inc.
12.9.1. Business Overview
12.9.2. Company Snapshot
12.9.3. Company Market Share Analysis
12.9.4. Company Product Portfolio
12.9.5. Recent Developments
12.9.6. SWOT Analysis
12.10. Santen Pharmaceutical Co. Ltd.
12.10.1. Business Overview
12.10.2. Company Snapshot
12.10.3. Company Market Share Analysis
12.10.4. Company Product Portfolio
12.10.5. Recent Developments
12.10.6. SWOT Analysis
List of Table
1. Global Ophthalmic Drugs Market, By Indication, 2020-2033 (USD Billion)
2. Global Dry Eye Ophthalmic Drugs Market, By Region, 2020-2033 (USD Billion)
3. Global Allergies Ophthalmic Drugs Market, By Region, 2020-2033 (USD Billion)
4. Global Infection Ophthalmic Drugs Market, By Region, 2020-2033 (USD Billion)
5. Global Retinal Disorders Ophthalmic Drugs Market, By Region, 2020-2033 (USD Billion)
6. Global Glaucoma Ophthalmic Drugs Market, By Region, 2020-2033 (USD Billion)
7. Global Others Ophthalmic Drugs Market, By Region, 2020-2033 (USD Billion)
8. Global Ophthalmic Drugs Market, By Drug Class, 2020-2033 (USD Billion)
9. Global Anti-Allergy Ophthalmic Drugs Market, By Region, 2020-2033 (USD Billion)
10. Global Anti-Glaucoma Ophthalmic Drugs Market, By Region, 2020-2033 (USD Billion)
11. Global Anti-Inflammatory Ophthalmic Drugs Market, By Region, 2020-2033 (USD Billion)
12. Global Anti-VEGF Agents Ophthalmic Drugs Market, By Region, 2020-2033 (USD Billion)
13. Global Anti-Allergy Ophthalmic Drugs Market, By Region, 2020-2033 (USD Billion)
14. Global Others Ophthalmic Drugs Market, By Region, 2020-2033 (USD Billion)
15. Global Ophthalmic Drugs Market, By Dosage Form, 2020-2033 (USD Billion)
16. Global Gels Ophthalmic Drugs Market, By Region, 2020-2033 (USD Billion)
17. Global Capsules and Tablets Ophthalmic Drugs Market, By Region, 2020-2033 (USD Billion)
18. Global Eye Drops Ophthalmic Drugs Market, By Region, 2020-2033 (USD Billion)
19. Global Eye Solutions and Suspensions Ophthalmic Drugs Market, By Region, 2020-2033 (USD Billion)
20. Global Ointments Ophthalmic Drugs Market, By Region, 2020-2033 (USD Billion)
21. Global Ophthalmic Drugs Market, By Distribution Channel, 2020-2033 (USD Billion)
22. Global Hospital Pharmacies Ophthalmic Drugs Market, By Region, 2020-2033 (USD Billion)
23. Global Drug Stores Ophthalmic Drugs Market, By Region, 2020-2033 (USD Billion)
24. Global Online Pharmacies Ophthalmic Drugs Market, By Region, 2020-2033 (USD Billion)
25. Global Others Ophthalmic Drugs Market, By Region, 2020-2033 (USD Billion)
26. Global Ophthalmic Drugs Market, By Region, 2020-2033 (USD Billion)
27. North America Ophthalmic Drugs Market, By Indication, 2020-2033 (USD Billion)
28. North America Ophthalmic Drugs Market, By Drug Class, 2020-2033 (USD Billion)
29. North America Ophthalmic Drugs Market, By Dosage Form, 2020-2033 (USD Billion)
30. North America Ophthalmic Drugs Market, By Distribution Channel, 2020-2033 (USD Billion)
31. U.S. Ophthalmic Drugs Market, By Indication, 2020-2033 (USD Billion)
32. U.S. Ophthalmic Drugs Market, By Drug Class, 2020-2033 (USD Billion)
33. U.S. Ophthalmic Drugs Market, By Dosage Form, 2020-2033 (USD Billion)
34. U.S. Ophthalmic Drugs Market, By Distribution Channel, 2020-2033 (USD Billion)
35. Canada Ophthalmic Drugs Market, By Indication, 2020-2033 (USD Billion)
36. Canada Ophthalmic Drugs Market, By Drug Class, 2020-2033 (USD Billion)
37. Canada Ophthalmic Drugs Market, By Dosage Form, 2020-2033 (USD Billion)
38. Canada Ophthalmic Drugs Market, By Distribution Channel, 2020-2033 (USD Billion)
39. Mexico Ophthalmic Drugs Market, By Indication, 2020-2033 (USD Billion)
40. Mexico Ophthalmic Drugs Market, By Drug Class, 2020-2033 (USD Billion)
41. Mexico Ophthalmic Drugs Market, By Dosage Form, 2020-2033 (USD Billion)
42. Mexico Ophthalmic Drugs Market, By Distribution Channel, 2020-2033 (USD Billion)
43. Europe Ophthalmic Drugs Market, By Indication, 2020-2033 (USD Billion)
44. Europe Ophthalmic Drugs Market, By Drug Class, 2020-2033 (USD Billion)
45. Europe Ophthalmic Drugs Market, By Dosage Form, 2020-2033 (USD Billion)
46. Europe Ophthalmic Drugs Market, By Distribution Channel, 2020-2033 (USD Billion)
47. Germany Ophthalmic Drugs Market, By Indication, 2020-2033 (USD Billion)
48. Germany Ophthalmic Drugs Market, By Drug Class, 2020-2033 (USD Billion)
49. Germany Ophthalmic Drugs Market, By Dosage Form, 2020-2033 (USD Billion)
50. Germany Ophthalmic Drugs Market, By Distribution Channel, 2020-2033 (USD Billion)
51. France Ophthalmic Drugs Market, By Indication, 2020-2033 (USD Billion)
52. France Ophthalmic Drugs Market, By Drug Class, 2020-2033 (USD Billion)
53. France Ophthalmic Drugs Market, By Dosage Form, 2020-2033 (USD Billion)
54. France Ophthalmic Drugs Market, By Distribution Channel, 2020-2033 (USD Billion)
55. U.K. Ophthalmic Drugs Market, By Indication, 2020-2033 (USD Billion)
56. U.K. Ophthalmic Drugs Market, By Drug Class, 2020-2033 (USD Billion)
57. U.K. Ophthalmic Drugs Market, By Dosage Form, 2020-2033 (USD Billion)
58. U.K. Ophthalmic Drugs Market, By Distribution Channel, 2020-2033 (USD Billion)
59. Italy Ophthalmic Drugs Market, By Indication, 2020-2033 (USD Billion)
60. Italy Ophthalmic Drugs Market, By Drug Class, 2020-2033 (USD Billion)
61. Italy Ophthalmic Drugs Market, By Dosage Form, 2020-2033 (USD Billion)
62. Italy Ophthalmic Drugs Market, By Distribution Channel, 2020-2033 (USD Billion)
63. Spain Ophthalmic Drugs Market, By Indication, 2020-2033 (USD Billion)
64. Spain Ophthalmic Drugs Market, By Drug Class, 2020-2033 (USD Billion)
65. Spain Ophthalmic Drugs Market, By Dosage Form, 2020-2033 (USD Billion)
66. Spain Ophthalmic Drugs Market, By Distribution Channel, 2020-2033 (USD Billion)
67. Asia Pacific Ophthalmic Drugs Market, By Indication, 2020-2033 (USD Billion)
68. Asia Pacific Ophthalmic Drugs Market, By Drug Class, 2020-2033 (USD Billion)
69. Asia Pacific Ophthalmic Drugs Market, By Dosage Form, 2020-2033 (USD Billion)
70. Asia Pacific Ophthalmic Drugs Market, By Distribution Channel, 2020-2033 (USD Billion)
71. Japan Ophthalmic Drugs Market, By Indication, 2020-2033 (USD Billion)
72. Japan Ophthalmic Drugs Market, By Drug Class, 2020-2033 (USD Billion)
73. Japan Ophthalmic Drugs Market, By Dosage Form, 2020-2033 (USD Billion)
74. Japan Ophthalmic Drugs Market, By Distribution Channel, 2020-2033 (USD Billion)
75. China Ophthalmic Drugs Market, By Indication, 2020-2033 (USD Billion)
76. China Ophthalmic Drugs Market, By Drug Class, 2020-2033 (USD Billion)
77. China Ophthalmic Drugs Market, By Dosage Form, 2020-2033 (USD Billion)
78. China Ophthalmic Drugs Market, By Distribution Channel, 2020-2033 (USD Billion)
79. India Ophthalmic Drugs Market, By Indication, 2020-2033 (USD Billion)
80. India Ophthalmic Drugs Market, By Drug Class, 2020-2033 (USD Billion)
81. India Ophthalmic Drugs Market, By Dosage Form, 2020-2033 (USD Billion)
82. India Ophthalmic Drugs Market, By Distribution Channel, 2020-2033 (USD Billion)
83. South America Ophthalmic Drugs Market, By Indication, 2020-2033 (USD Billion)
84. South America Ophthalmic Drugs Market, By Drug Class, 2020-2033 (USD Billion)
85. South America Ophthalmic Drugs Market, By Dosage Form, 2020-2033 (USD Billion)
86. South America Ophthalmic Drugs Market, By Distribution Channel, 2020-2033 (USD Billion)
87. Brazil Ophthalmic Drugs Market, By Indication, 2020-2033 (USD Billion)
88. Brazil Ophthalmic Drugs Market, By Drug Class, 2020-2033 (USD Billion)
89. Brazil Ophthalmic Drugs Market, By Dosage Form, 2020-2033 (USD Billion)
90. Brazil Ophthalmic Drugs Market, By Distribution Channel, 2020-2033 (USD Billion)
91. Middle East and Africa Ophthalmic Drugs Market, By Indication, 2020-2033 (USD Billion)
92. Middle East and Africa Ophthalmic Drugs Market, By Drug Class, 2020-2033 (USD Billion)
93. Middle East and Africa Ophthalmic Drugs Market, By Dosage Form, 2020-2033 (USD Billion)
94. Middle East and Africa Ophthalmic Drugs Market, By Distribution Channel, 2020-2033 (USD Billion)
95. UAE Ophthalmic Drugs Market, By Indication, 2020-2033 (USD Billion)
96. UAE Ophthalmic Drugs Market, By Drug Class, 2020-2033 (USD Billion)
97. UAE Ophthalmic Drugs Market, By Dosage Form, 2020-2033 (USD Billion)
98. UAE Ophthalmic Drugs Market, By Distribution Channel, 2020-2033 (USD Billion)
99. South Africa Ophthalmic Drugs Market, By Indication, 2020-2033 (USD Billion)
100. South Africa Ophthalmic Drugs Market, By Drug Class, 2020-2033 (USD Billion)
101. South Africa Ophthalmic Drugs Market, By Dosage Form, 2020-2033 (USD Billion)
102. South Africa Ophthalmic Drugs Market, By Distribution Channel, 2020-2033 (USD Billion)
List of Figures
1. Global Ophthalmic Drugs Market Segmentation
2. Ophthalmic Drugs Market: Research Methodology
3. Market Size Estimation Methodology: Bottom-Up Approach
4. Market Size Estimation Methodology: Top-Down Approach
5. Data Triangulation
6. Porter’s Five Forces Analysis
7. Value Chain Analysis
8. Global Ophthalmic Drugs Market Attractiveness Analysis by Indication
9. Global Ophthalmic Drugs Market Attractiveness Analysis by Drug Class
10. Global Ophthalmic Drugs Market Attractiveness Analysis by Dosage Form
11. Global Ophthalmic Drugs Market Attractiveness Analysis by Distribution Channel
12. Global Ophthalmic Drugs Market Attractiveness Analysis by Region
13. Global Ophthalmic Drugs Market: Dynamics
14. Global Ophthalmic Drugs Market Share by Indication (2023 & 2033)
15. Global Ophthalmic Drugs Market Share by Drug Class (2023 & 2033)
16. Global Ophthalmic Drugs Market Share by Dosage Form (2023 & 2033)
17. Global Ophthalmic Drugs Market Share by Distribution Channel (2023 & 2033)
18. Global Ophthalmic Drugs Market Share by Regions (2023 & 2033)
19. Global Ophthalmic Drugs Market Share by Company (2023)
This study forecasts revenue at global, regional, and country levels from 2020 to 2033. The Brainy Insights has segmented the global ophthalmic drugs market based on below mentioned segments:
Global Ophthalmic Drugs Market by Indication:
Global Ophthalmic Drugs Market by Drug Class:
Global Ophthalmic Drugs Market by Dosage Form:
Global Ophthalmic Drugs Market by Distribution Channel:
Global Ophthalmic Drugs Market by Region:
Research has its special purpose to undertake marketing efficiently. In this competitive scenario, businesses need information across all industry verticals; the information about customer wants, market demand, competition, industry trends, distribution channels etc. This information needs to be updated regularly because businesses operate in a dynamic environment. Our organization, The Brainy Insights incorporates scientific and systematic research procedures in order to get proper market insights and industry analysis for overall business success. The analysis consists of studying the market from a miniscule level wherein we implement statistical tools which helps us in examining the data with accuracy and precision.
Our research reports feature both; quantitative and qualitative aspects for any market. Qualitative information for any market research process are fundamental because they reveal the customer needs and wants, usage and consumption for any product/service related to a specific industry. This in turn aids the marketers/investors in knowing certain perceptions of the customers. Qualitative research can enlighten about the different product concepts and designs along with unique service offering that in turn, helps define marketing problems and generate opportunities. On the other hand, quantitative research engages with the data collection process through interviews, e-mail interactions, surveys and pilot studies. Quantitative aspects for the market research are useful to validate the hypotheses generated during qualitative research method, explore empirical patterns in the data with the help of statistical tools, and finally make the market estimations.
The Brainy Insights offers comprehensive research and analysis, based on a wide assortment of factual insights gained through interviews with CXOs and global experts and secondary data from reliable sources. Our analysts and industry specialist assume vital roles in building up statistical tools and analysis models, which are used to analyse the data and arrive at accurate insights with exceedingly informative research discoveries. The data provided by our organization have proven precious to a diverse range of companies, facilitating them to address issues such as determining which products/services are the most appealing, whether or not customers use the product in the manner anticipated, the purchasing intentions of the market and many others.
Our research methodology encompasses an idyllic combination of primary and secondary initiatives. Key phases involved in this process are listed below:

The phase involves the gathering and collecting of market data and its related information with the help of different sources & research procedures.

The data procurement stage involves in data gathering and collecting through various data sources.
This stage involves in extensive research. These data sources includes:
Purchased Database: Purchased databases play a crucial role in estimating the market sizes irrespective of the domain. Our purchased database includes:
Primary Research: The Brainy Insights interacts with leading companies and experts of the concerned domain to develop the analyst team’s market understanding and expertise. It improves and substantiates every single data presented in the market reports. Primary research mainly involves in telephonic interviews, E-mail interactions and face-to-face interviews with the raw material providers, manufacturers/producers, distributors, & independent consultants. The interviews that we conduct provides valuable data on market size and industry growth trends prevailing in the market. Our organization also conducts surveys with the various industry experts in order to gain overall insights of the industry/market. For instance, in healthcare industry we conduct surveys with the pharmacists, doctors, surgeons and nurses in order to gain insights and key information of a medical product/device/equipment which the customers are going to usage. Surveys are conducted in the form of questionnaire designed by our own analyst team. Surveys plays an important role in primary research because surveys helps us to identify the key target audiences of the market. Additionally, surveys helps to identify the key target audience engaged with the market. Our survey team conducts the survey by targeting the key audience, thus gaining insights from them. Based on the perspectives of the customers, this information is utilized to formulate market strategies. Moreover, market surveys helps us to understand the current competitive situation of the industry. To be precise, our survey process typically involve with the 360 analysis of the market. This analytical process begins by identifying the prospective customers for a product or service related to the market/industry to obtain data on how a product/service could fit into customers’ lives.

Secondary Research: The secondary data sources includes information published by the on-profit organizations such as World bank, WHO, company fillings, investor presentations, annual reports, national government documents, statistical databases, blogs, articles, white papers and others. From the annual report, we analyse a company’s revenue to understand the key segment and market share of that organization in a particular region. We analyse the company websites and adopt the product mapping technique which is important for deriving the segment revenue. In the product mapping method, we select and categorize the products offered by the companies catering to domain specific market, deduce the product revenue for each of the companies so as to get overall estimation of the market size. We also source data and analyses trends based on information received from supply side and demand side intermediaries in the value chain. The supply side denotes the data gathered from supplier, distributor, wholesaler and the demand side illustrates the data gathered from the end customers for respective market domain.

The supply side for a domain specific market is analysed by:
The demand side for the market is estimated through:
In-house Library: Apart from these third-party sources, we have our in-house library of qualitative and quantitative information. Our in-house database includes market data for various industry and domains. These data are updated on regular basis as per the changing market scenario. Our library includes, historic databases, internal audit reports and archives.
Sometimes there are instances where there is no metadata or raw data available for any domain specific market. For those cases, we use our expertise to forecast and estimate the market size in order to generate comprehensive data sets. Our analyst team adopt a robust research technique in order to produce the estimates:
Data Synthesis: This stage involves the analysis & mapping of all the information obtained from the previous step. It also involves in scrutinizing the data for any discrepancy observed while data gathering related to the market. The data is collected with consideration to the heterogeneity of sources. Robust scientific techniques are in place for synthesizing disparate data sets and provide the essential contextual information that can orient market strategies. The Brainy Insights has extensive experience in data synthesis where the data passes through various stages:


Market Deduction & Formulation: The final stage comprises of assigning data points at appropriate market spaces so as to deduce feasible conclusions. Analyst perspective & subject matter expert based holistic form of market sizing coupled with industry analysis also plays a crucial role in this stage.
This stage involves in finalization of the market size and numbers that we have collected from data integration step. With data interpolation, it is made sure that there is no gap in the market data. Successful trend analysis is done by our analysts using extrapolation techniques, which provide the best possible forecasts for the market.
Data Validation & Market Feedback: Validation is the most important step in the process. Validation & re-validation via an intricately designed process helps us finalize data-points to be used for final calculations.

The Brainy Insights interacts with leading companies and experts of the concerned domain to develop the analyst team’s market understanding and expertise. It improves and substantiates every single data presented in the market reports. The data validation interview and discussion panels are typically composed of the most experienced industry members. The participants include, however, are not limited to:
Moreover, we always validate our data and findings through primary respondents from all the major regions we are working on.


Free Customization
Fortune 500 Clients
Free Yearly Update On Purchase Of Multi/Corporate License
Companies Served Till Date