- +1-315-215-1633
- sales@thebrainyinsights.com

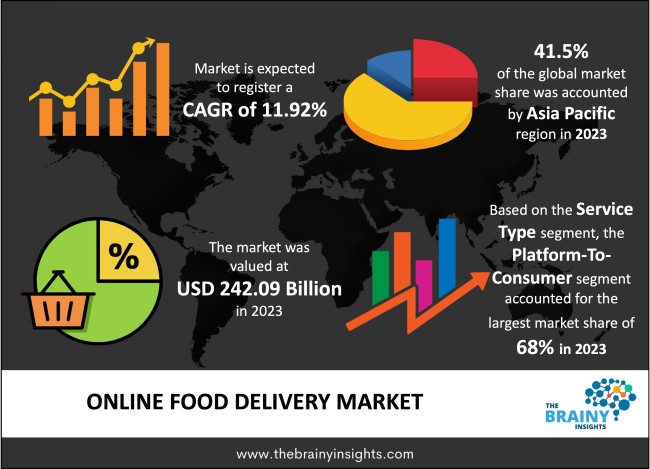
The global online food delivery market was valued at USD 242.09 Billion in 2023 and grew at a CAGR of 11.92% from 2024 to 2033. The market is expected to reach USD 746.55 Billion by 2033. The increasing demand for online food delivery can be attributed to the rising use of smartphones and the demand for convenience food. The increased network connectivity and rising innovation in the software used for online food delivery applications. Ghost kitchens, known as dark or cloud kitchens, present an innovative approach within the food delivery industry. These specialized kitchen spaces cater only to online orders and eliminate the need for physical dining amenities. They lower expenses considerably while enhancing operational performance, enabling eateries to extend their market reach without opening conventional brick-and-mortar units.
In addition, several meal delivery platforms have expanded their offerings to include different services such as pet food, groceries, and alcohol. This move towards diversification allows for flexibility in meeting consumers' changing demands. As new innovative services emerge within this industry, online food ordering will continue to establish itself as an essential aspect of modern living.
Online meal ordering might be considered the Internet's response to food delivery needs. People increasingly use their Internet connection to place orders from restaurants with interactive menus, particularly in urban areas and college campuses. Online meal ordering from a restaurant can happen in a variety of ways. People access the Internet, visit the restaurant's website, and place orders there instead of calling for delivery. The company may accept and manage online orders for delivery or takeaway using an online meal ordering platform. Customers place their orders, make payments, and browse a digital menu via a website or mobile app. After receiving the order information via online meal ordering, venues will prepare the order for delivery or customer pickup. Businesses can also outsource these services to a third-party delivery service rather than using their trucks and drivers. Online food ordering services can help their establishment attract more clients and increase revenues by providing a new source of income.
Get an overview of this study by requesting a free sample
Increasing preference for online food delivery: Due to the creation of tech-enabled driver networks, user-friendly apps, and changing consumer expectations, ready-to-eat food delivery has grown into a sizable sector. Early in the pandemic, the implication of the lockdown significantly boosted the market as the volume of online food ordering increased. It is likely to continue to be a dependable part of the eating scene in the future. Customers may now get their preferred food delivered right to their door without sacrificing quality or selling time. The fact that customers can access a variety of deals, offers, and discounts in one location and via a single app is the main driving factor. They are optional to go to each restaurant's website separately.
Lack of infrastructure: Most online food delivery cannot cope with the existing infrastructure. The reach of many apps varies between specified ranges, and thus, this serves as a restraint, especially in developing and under-developed companies. The interventions and services are only partially designed to be equipped in regular environments. The manufacturers must focus on efficient resource settings that can be sustainable for the online food delivery industry. Especially in developing countries with large population bases and congested areas, the operation ability of autonomous vehicles for food delivery is still a challenge for developers.
Application of artificial intelligence and big data: Artificial intelligence can make it much simpler to manage multiple orders at once and assign the best delivery partners, ensuring that the food is delivered on time. A meal delivery app can employ advanced AI algorithms to do several analyses to identify the nearby delivery partners and choose those most likely to deliver the order quickly. This can be accomplished by verifying the delivery partner's overall rating and prior reviews. Based on the findings, the AI programme can immediately select the most capable delivery partner to complete the order more quickly. In recent years, artificial intelligence has transformed from a science-fiction idea to a genuine technology with cutting-edge applications in several sectors. Artificial intelligence may be one of the most useful technologies for the on-demand food delivery sector to engage clients and increase customer repetition.
The regions analyzed for the market include North America, Europe, South America, Asia Pacific, the Middle East, and Africa. Asia Pacific emerged as the most significant online food delivery market, with a 41.5% market revenue share in 2023. Asia Pacific region will account for the largest market share with revenue growth. Nations such as Japan, China, India and South Korea have a tremendous demand for online food delivery due to several factors such as changing food preferences, increasing urbanization, rising per capita income and increasing number of online food delivery platforms. The service providers are investing in the development of software technology, enhancing the customer experience and thus promoting online food delivery among younger demographics.
Asia Pacific Region Online Food Delivery Market Share in 2023 - 41.5%
www.thebrainyinsights.com
Check the geographical analysis of this market by requesting a free sample
The service type segment is divided into platform to consumer and restaurant to consumer. The platform-to-consumer segment dominated the market, with a share of around 68% in 2023. The platform-to-consumer delivery niche is centred on web-based delivery services that offer clients meals from affiliated restaurants. Thus, these are only sometimes required to do food delivery themselves. In this instance, the platform manages the delivery procedure, not the restaurants.
The channel type segment is divided into mobile applications and websites. The mobile applications segment dominated the market, with a share of around 82% in 2023. Mobile application-based online food delivery portals are easy to use due to their accessibility. These applications can be easily downloaded on smartphones and provide various options. With the rise in sales of smartphones, the segment should register a tremendous growth rate during the forecast.
The payment method segment is divided into cash on delivery and online payment. The online payment segment dominated the market, with a share of around 69% in 2023. The hospitals keep different types of Online Food Delivery to treat various applications. The type of devices and procedures used in the hospitals also depends upon the condition and underlying diseases of the patient.
| Attribute | Description |
|---|---|
| Market Size | Revenue (USD Billion) |
| Market size value in 2023 | USD 242.09 Billion |
| Market size value in 2033 | USD 746.55 Billion |
| CAGR (2024 to 2033) | 11.92% |
| Historical data | 2020-2022 |
| Base Year | 2023 |
| Forecast | 2024-2033 |
| Region | The regions analyzed for the market are Asia Pacific, Europe, South America, North America, and Middle East & Africa. Furthermore, the regions are further analyzed at the country level. |
| Segments | Service Type, Channel Type and Payment Method |
As per The Brainy Insights, the size of the online food delivery market was valued USD 242.09 billion in 2023 to USD 746.55 billion by 2033.
Global online food delivery market is growing at a CAGR of 11.92% during the forecast period 2024-2033.
Asia-Pacific region emerged as the largest market for the online food delivery.
The market's growth will be influenced by the rising use of online food delivery platforms.
The lack of infrastructure in developing countries can hamper the market growth.
The rising sales of smart phones are providing huge opportunities to the market.
1. Introduction
1.1. Objectives of the Study
1.2. Market Definition
1.3. Research Scope
1.4. Currency
1.5. Key Target Audience
2. Research Methodology and Assumptions
3. Executive Summary
4. Premium Insights
4.1. Porter’s Five Forces Analysis
4.2. Value Chain Analysis
4.3. Top Investment Pockets
4.3.1. Market Attractiveness Analysis by Service Type
4.3.2. Market Attractiveness Analysis by Channel Type
4.3.3. Market Attractiveness Analysis by Payment Method
4.3.4. Market Attractiveness Analysis by Region
4.4. Industry Trends
5. Market Dynamics
5.1. Market Evaluation
5.2. Drivers
5.2.1. Increasing use of online food delivery services
5.3. Restraints
5.3.1. Lack of infrastructure
5.4. Opportunities
5.4.1. Rising use of smartphones
5.5. Challenges
5.5.1. Lack of data privacy
6. Global Online Food Delivery Market Analysis and Forecast, By Service Type
6.1. Segment Overview
6.2. Platform to Consumer
6.3. Restaurant to Consumer
7. Global Online Food Delivery Market Analysis and Forecast, By Channel Type
7.1. Segment Overview
7.2. Mobile Applications
7.3. Websites
8. Global Online Food Delivery Market Analysis and Forecast, By Payment Method
8.1. Segment Overview
8.2. Cash on Delivery
8.3. Online Payment
9. Global Online Food Delivery Market Analysis and Forecast, By Regional Analysis
9.1. Segment Overview
9.2. North America
9.2.1. U.S.
9.2.2. Canada
9.2.3. Mexico
9.3. Europe
9.3.1. Germany
9.3.2. France
9.3.3. U.K.
9.3.4. Italy
9.3.5. Spain
9.4. Asia-Pacific
9.4.1. Japan
9.4.2. China
9.4.3. India
9.5. South America
9.5.1. Brazil
9.6. Middle East and Africa
9.6.1. UAE
9.6.2. South Africa
10. Global Online Food Delivery Market-Competitive Landscape
10.1. Overview
10.2. Market Share of Key Players in the Online Food Delivery Market
10.2.1. Global Company Market Share
10.2.2. North America Company Market Share
10.2.3. Europe Company Market Share
10.2.4. APAC Company Market Share
10.3. Competitive Situations and Trends
10.3.1. Product Launches and Developments
10.3.2. Partnerships, Collaborations, and Agreements
10.3.3. Mergers & Acquisitions
10.3.4. Expansions
11. Company Profiles
11.1. DoorDash
11.1.1. Business Overview
11.1.2. Company Snapshot
11.1.3. Company Market Share Analysis
11.1.4. Company Product Portfolio
11.1.5. Recent Developments
11.1.6. SWOT Analysis
11.2. Domino's Pizza Inc.
11.2.1. Business Overview
11.2.2. Company Snapshot
11.2.3. Company Market Share Analysis
11.2.4. Company Product Portfolio
11.2.5. Recent Developments
11.2.6. SWOT Analysis
11.3. Delivery Hero SE
11.3.1. Business Overview
11.3.2. Company Snapshot
11.3.3. Company Market Share Analysis
11.3.4. Company Product Portfolio
11.3.5. Recent Developments
11.3.6. SWOT Analysis
11.4. Ele.me
11.4.1. Business Overview
11.4.2. Company Snapshot
11.4.3. Company Market Share Analysis
11.4.4. Company Product Portfolio
11.4.5. Recent Developments
11.4.6. SWOT Analysis
11.5. McDonald's
11.5.1. Business Overview
11.5.2. Company Snapshot
11.5.3. Company Market Share Analysis
11.5.4. Company Product Portfolio
11.5.5. Recent Developments
11.5.6. SWOT Analysis
11.6. Grubhub
11.6.1. Business Overview
11.6.2. Company Snapshot
11.6.3. Company Market Share Analysis
11.6.4. Company Product Portfolio
11.6.5. Recent Developments
11.6.6. SWOT Analysis
11.7. Deliveroo
11.7.1. Business Overview
11.7.2. Company Snapshot
11.7.3. Company Market Share Analysis
11.7.4. Company Product Portfolio
11.7.5. Recent Developments
11.7.6. SWOT Analysis
11.8. Pizza Hut
11.8.1. Business Overview
11.8.2. Company Snapshot
11.8.3. Company Market Share Analysis
11.8.4. Company Product Portfolio
11.8.5. Recent Developments
11.8.6. SWOT Analysis
11.9. Swiggy
11.9.1. Business Overview
11.9.2. Company Snapshot
11.9.3. Company Market Share Analysis
11.9.4. Company Product Portfolio
11.9.5. Recent Developments
11.9.6. SWOT Analysis
11.10. Papa John's International, Inc.
11.10.1. Business Overview
11.10.2. Company Snapshot
11.10.3. Company Market Share Analysis
11.10.4. Company Product Portfolio
11.10.5. Recent Developments
11.10.6. SWOT Analysis
11.11. Just Eat Takeaway.com
11.11.1. Business Overview
11.11.2. Company Snapshot
11.11.3. Company Market Share Analysis
11.11.4. Company Product Portfolio
11.11.5. Recent Developments
11.11.6. SWOT Analysis
11.12. Waiter.com, Inc.
11.12.1. Business Overview
11.12.2. Company Snapshot
11.12.3. Company Market Share Analysis
11.12.4. Company Product Portfolio
11.12.5. Recent Developments
11.12.6. SWOT Analysis
11.13. Uber Technologies Inc.
11.13.1. Business Overview
11.13.2. Company Snapshot
11.13.3. Company Market Share Analysis
11.13.4. Company Product Portfolio
11.13.5. Recent Developments
11.13.6. SWOT Analysis
11.14. Rappi Inc.
11.14.1. Business Overview
11.14.2. Company Snapshot
11.14.3. Company Market Share Analysis
11.14.4. Company Product Portfolio
11.14.5. Recent Developments
11.14.6. SWOT Analysis
11.15. Zomato Ltd.
11.15.1. Business Overview
11.15.2. Company Snapshot
11.15.3. Company Market Share Analysis
11.15.4. Company Product Portfolio
11.15.5. Recent Developments
11.15.6. SWOT Analysis
11.16. Meituan Inc.
11.16.1. Business Overview
11.16.2. Company Snapshot
11.16.3. Company Market Share Analysis
11.16.4. Company Product Portfolio
11.16.5. Recent Developments
11.16.6. SWOT Analysis
11.17. Roofoods Ltd
11.17.1. Business Overview
11.17.2. Company Snapshot
11.17.3. Company Market Share Analysis
11.17.4. Company Product Portfolio
11.17.5. Recent Developments
11.17.6. SWOT Analysis
11.18. Demae-Can Co., Ltd.
11.18.1. Business Overview
11.18.2. Company Snapshot
11.18.3. Company Market Share Analysis
11.18.4. Company Product Portfolio
11.18.5. Recent Developments
11.18.6. SWOT Analysis
11.19. Yum! Brands Inc.
11.19.1. Business Overview
11.19.2. Company Snapshot
11.19.3. Company Market Share Analysis
11.19.4. Company Product Portfolio
11.19.5. Recent Developments
11.19.6. SWOT Analysis
11.20. Bundl Technologies Private Limited
11.20.1. Business Overview
11.20.2. Company Snapshot
11.20.3. Company Market Share Analysis
11.20.4. Company Product Portfolio
11.20.5. Recent Developments
11.20.6. SWOT Analysis
11.21. Yandex.Eda, LLC
11.21.1. Business Overview
11.21.2. Company Snapshot
11.21.3. Company Market Share Analysis
11.21.4. Company Product Portfolio
11.21.5. Recent Developments
11.21.6. SWOT Analysis
List of Table
1. Global Online Food Delivery Market, By Service Type, 2020-2033 (USD Billion)
2. Global Platform to Consumer, Online Food Delivery Market, By Region, 2020-2033 (USD Billion)
3. Global Restaurant to Consumer, Online Food Delivery Market, By Region, 2020-2033 (USD Billion)
4. Global Online Food Delivery Market, By Channel Type, 2020-2033 (USD Billion)
5. Global Mobile Applications, Online Food Delivery Market, By Region, 2020-2033 (USD Billion)
6. Global Websites, Online Food Delivery Market, By Region, 2020-2033 (USD Billion)
7. Global Online Food Delivery Market, By Payment Method, 2020-2033 (USD Billion)
8. Global Cash on Delivery, Online Food Delivery Market, By Region, 2020-2033 (USD Billion)
9. Global Online Payment, Online Food Delivery Market, By Region, 2020-2033 (USD Billion)
10. Global Online Food Delivery Market, By Region, 2020-2033 (USD Billion)
11. North America Online Food Delivery Market, By Service Type, 2020-2033 (USD Billion)
12. North America Online Food Delivery Market, By Channel Type, 2020-2033 (USD Billion)
13. North America Online Food Delivery Market, By Payment Method, 2020-2033 (USD Billion)
14. U.S. Online Food Delivery Market, By Service Type, 2020-2033 (USD Billion)
15. U.S. Online Food Delivery Market, By Channel Type, 2020-2033 (USD Billion)
16. U.S. Online Food Delivery Market, By Payment Method, 2020-2033 (USD Billion)
17. Canada Online Food Delivery Market, By Service Type, 2020-2033 (USD Billion)
18. Canada Online Food Delivery Market, By Channel Type, 2020-2033 (USD Billion)
19. Canada Online Food Delivery Market, By Payment Method, 2020-2033 (USD Billion)
20. Mexico Online Food Delivery Market, By Service Type, 2020-2033 (USD Billion)
21. Mexico Online Food Delivery Market, By Channel Type, 2020-2033 (USD Billion)
22. Mexico Online Food Delivery Market, By Payment Method, 2020-2033 (USD Billion)
23. Europe Online Food Delivery Market, By Service Type, 2020-2033 (USD Billion)
24. Europe Online Food Delivery Market, By Channel Type, 2020-2033 (USD Billion)
25. Europe Online Food Delivery Market, By Payment Method, 2020-2033 (USD Billion)
26. Germany Online Food Delivery Market, By Service Type, 2020-2033 (USD Billion)
27. Germany Online Food Delivery Market, By Channel Type, 2020-2033 (USD Billion)
28. Germany Online Food Delivery Market, By Payment Method, 2020-2033 (USD Billion)
29. France Online Food Delivery Market, By Service Type, 2020-2033 (USD Billion)
30. France Online Food Delivery Market, By Channel Type, 2020-2033 (USD Billion)
31. France Online Food Delivery Market, By Payment Method, 2020-2033 (USD Billion)
32. U.K. Online Food Delivery Market, By Service Type, 2020-2033 (USD Billion)
33. U.K. Online Food Delivery Market, By Channel Type, 2020-2033 (USD Billion)
34. U.K. Online Food Delivery Market, By Payment Method, 2020-2033 (USD Billion)
35. Italy Online Food Delivery Market, By Service Type, 2020-2033 (USD Billion)
36. Italy Online Food Delivery Market, By Channel Type, 2020-2033 (USD Billion)
37. Italy Online Food Delivery Market, By Payment Method, 2020-2033 (USD Billion)
38. Spain Online Food Delivery Market, By Service Type, 2020-2033 (USD Billion)
39. Spain Online Food Delivery Market, By Channel Type, 2020-2033 (USD Billion)
40. Spain Online Food Delivery Market, By Payment Method, 2020-2033 (USD Billion)
41. Asia Pacific Online Food Delivery Market, By Service Type, 2020-2033 (USD Billion)
42. Asia Pacific Online Food Delivery Market, By Channel Type, 2020-2033 (USD Billion)
43. Asia Pacific Online Food Delivery Market, By Payment Method, 2020-2033 (USD Billion)
44. Japan Online Food Delivery Market, By Service Type, 2020-2033 (USD Billion)
45. Japan Online Food Delivery Market, By Channel Type, 2020-2033 (USD Billion)
46. Japan Online Food Delivery Market, By Payment Method, 2020-2033 (USD Billion)
47. China Online Food Delivery Market, By Service Type, 2020-2033 (USD Billion)
48. China Online Food Delivery Market, By Channel Type, 2020-2033 (USD Billion)
49. China Online Food Delivery Market, By Payment Method, 2020-2033 (USD Billion)
50. India Online Food Delivery Market, By Service Type, 2020-2033 (USD Billion)
51. India Online Food Delivery Market, By Channel Type, 2020-2033 (USD Billion)
52. India Online Food Delivery Market, By Payment Method, 2020-2033 (USD Billion)
53. South America Online Food Delivery Market, By Service Type, 2020-2033 (USD Billion)
54. South America Online Food Delivery Market, By Channel Type, 2020-2033 (USD Billion)
55. South America Online Food Delivery Market, By Payment Method, 2020-2033 (USD Billion)
56. Brazil Online Food Delivery Market, By Service Type, 2020-2033 (USD Billion)
57. Brazil Online Food Delivery Market, By Channel Type, 2020-2033 (USD Billion)
58. Brazil Online Food Delivery Market, By Payment Method, 2020-2033 (USD Billion)
59. Middle East and Africa Online Food Delivery Market, By Service Type, 2020-2033 (USD Billion)
60. Middle East and Africa Online Food Delivery Market, By Channel Type, 2020-2033 (USD Billion)
61. Middle East and Africa Online Food Delivery Market, By Payment Method, 2020-2033 (USD Billion)
62. UAE Online Food Delivery Market, By Service Type, 2020-2033 (USD Billion)
63. UAE Online Food Delivery Market, By Channel Type, 2020-2033 (USD Billion)
64. UAE Online Food Delivery Market, By Payment Method, 2020-2033 (USD Billion)
65. South Africa Online Food Delivery Market, By Service Type, 2020-2033 (USD Billion)
66. South Africa Online Food Delivery Market, By Channel Type, 2020-2033 (USD Billion)
67. South Africa Online Food Delivery Market, By Payment Method, 2020-2033 (USD Billion)
List of Figures
1. Global Online Food Delivery Market Segmentation
2. Online Food Delivery Market: Research Methodology
3. Market Size Estimation Methodology: Bottom-Up Approach
4. Market Size Estimation Methodology: Top-Down Approach
5. Data Triangulation
6. Porter’s Five Forces Analysis
7. Value Chain Analysis
8. Global Online Food Delivery Market Attractiveness Analysis by Service Type
9. Global Online Food Delivery Market Attractiveness Analysis by Channel Type
10. Global Online Food Delivery Market Attractiveness Analysis by Payment Method
11. Global Online Food Delivery Market Attractiveness Analysis by Region
12. Global Online Food Delivery Market: Dynamics
13. Global Online Food Delivery Market Share by Service Type (2023 & 2033)
14. Global Online Food Delivery Market Share by Channel Type (2023 & 2033)
15. Global Online Food Delivery Market Share by Payment Method (2023 & 2033)
16. Global Online Food Delivery Market Share by Regions (2023 & 2033)
17. Global Online Food Delivery Market Share by Company (2023)
This study forecasts revenue at global, regional, and country levels from 2020 to 2033. The Brainy Insights has segmented the global online food delivery market based on below mentioned segments:
Global Online Food Delivery Market by Service Type:
Global Online Food Delivery Market by Channel Type:
Global Online Food Delivery Market by Payment Method:
Global Online Food Delivery Market by Region:
Research has its special purpose to undertake marketing efficiently. In this competitive scenario, businesses need information across all industry verticals; the information about customer wants, market demand, competition, industry trends, distribution channels etc. This information needs to be updated regularly because businesses operate in a dynamic environment. Our organization, The Brainy Insights incorporates scientific and systematic research procedures in order to get proper market insights and industry analysis for overall business success. The analysis consists of studying the market from a miniscule level wherein we implement statistical tools which helps us in examining the data with accuracy and precision.
Our research reports feature both; quantitative and qualitative aspects for any market. Qualitative information for any market research process are fundamental because they reveal the customer needs and wants, usage and consumption for any product/service related to a specific industry. This in turn aids the marketers/investors in knowing certain perceptions of the customers. Qualitative research can enlighten about the different product concepts and designs along with unique service offering that in turn, helps define marketing problems and generate opportunities. On the other hand, quantitative research engages with the data collection process through interviews, e-mail interactions, surveys and pilot studies. Quantitative aspects for the market research are useful to validate the hypotheses generated during qualitative research method, explore empirical patterns in the data with the help of statistical tools, and finally make the market estimations.
The Brainy Insights offers comprehensive research and analysis, based on a wide assortment of factual insights gained through interviews with CXOs and global experts and secondary data from reliable sources. Our analysts and industry specialist assume vital roles in building up statistical tools and analysis models, which are used to analyse the data and arrive at accurate insights with exceedingly informative research discoveries. The data provided by our organization have proven precious to a diverse range of companies, facilitating them to address issues such as determining which products/services are the most appealing, whether or not customers use the product in the manner anticipated, the purchasing intentions of the market and many others.
Our research methodology encompasses an idyllic combination of primary and secondary initiatives. Key phases involved in this process are listed below:

The phase involves the gathering and collecting of market data and its related information with the help of different sources & research procedures.

The data procurement stage involves in data gathering and collecting through various data sources.
This stage involves in extensive research. These data sources includes:
Purchased Database: Purchased databases play a crucial role in estimating the market sizes irrespective of the domain. Our purchased database includes:
Primary Research: The Brainy Insights interacts with leading companies and experts of the concerned domain to develop the analyst team’s market understanding and expertise. It improves and substantiates every single data presented in the market reports. Primary research mainly involves in telephonic interviews, E-mail interactions and face-to-face interviews with the raw material providers, manufacturers/producers, distributors, & independent consultants. The interviews that we conduct provides valuable data on market size and industry growth trends prevailing in the market. Our organization also conducts surveys with the various industry experts in order to gain overall insights of the industry/market. For instance, in healthcare industry we conduct surveys with the pharmacists, doctors, surgeons and nurses in order to gain insights and key information of a medical product/device/equipment which the customers are going to usage. Surveys are conducted in the form of questionnaire designed by our own analyst team. Surveys plays an important role in primary research because surveys helps us to identify the key target audiences of the market. Additionally, surveys helps to identify the key target audience engaged with the market. Our survey team conducts the survey by targeting the key audience, thus gaining insights from them. Based on the perspectives of the customers, this information is utilized to formulate market strategies. Moreover, market surveys helps us to understand the current competitive situation of the industry. To be precise, our survey process typically involve with the 360 analysis of the market. This analytical process begins by identifying the prospective customers for a product or service related to the market/industry to obtain data on how a product/service could fit into customers’ lives.

Secondary Research: The secondary data sources includes information published by the on-profit organizations such as World bank, WHO, company fillings, investor presentations, annual reports, national government documents, statistical databases, blogs, articles, white papers and others. From the annual report, we analyse a company’s revenue to understand the key segment and market share of that organization in a particular region. We analyse the company websites and adopt the product mapping technique which is important for deriving the segment revenue. In the product mapping method, we select and categorize the products offered by the companies catering to domain specific market, deduce the product revenue for each of the companies so as to get overall estimation of the market size. We also source data and analyses trends based on information received from supply side and demand side intermediaries in the value chain. The supply side denotes the data gathered from supplier, distributor, wholesaler and the demand side illustrates the data gathered from the end customers for respective market domain.

The supply side for a domain specific market is analysed by:
The demand side for the market is estimated through:
In-house Library: Apart from these third-party sources, we have our in-house library of qualitative and quantitative information. Our in-house database includes market data for various industry and domains. These data are updated on regular basis as per the changing market scenario. Our library includes, historic databases, internal audit reports and archives.
Sometimes there are instances where there is no metadata or raw data available for any domain specific market. For those cases, we use our expertise to forecast and estimate the market size in order to generate comprehensive data sets. Our analyst team adopt a robust research technique in order to produce the estimates:
Data Synthesis: This stage involves the analysis & mapping of all the information obtained from the previous step. It also involves in scrutinizing the data for any discrepancy observed while data gathering related to the market. The data is collected with consideration to the heterogeneity of sources. Robust scientific techniques are in place for synthesizing disparate data sets and provide the essential contextual information that can orient market strategies. The Brainy Insights has extensive experience in data synthesis where the data passes through various stages:


Market Deduction & Formulation: The final stage comprises of assigning data points at appropriate market spaces so as to deduce feasible conclusions. Analyst perspective & subject matter expert based holistic form of market sizing coupled with industry analysis also plays a crucial role in this stage.
This stage involves in finalization of the market size and numbers that we have collected from data integration step. With data interpolation, it is made sure that there is no gap in the market data. Successful trend analysis is done by our analysts using extrapolation techniques, which provide the best possible forecasts for the market.
Data Validation & Market Feedback: Validation is the most important step in the process. Validation & re-validation via an intricately designed process helps us finalize data-points to be used for final calculations.

The Brainy Insights interacts with leading companies and experts of the concerned domain to develop the analyst team’s market understanding and expertise. It improves and substantiates every single data presented in the market reports. The data validation interview and discussion panels are typically composed of the most experienced industry members. The participants include, however, are not limited to:
Moreover, we always validate our data and findings through primary respondents from all the major regions we are working on.


Free Customization
Fortune 500 Clients
Free Yearly Update On Purchase Of Multi/Corporate License
Companies Served Till Date